Integrating Prometheus Data
Compatibility
Collector: 4.2.0.0 or later, with the Guanyun Collector module enabled
Confirming the Collector Deployment Location
Collector needs to read data from the Prometheus Exporter interface. Therefore, ensure that the network between Collector and the Prometheus Exporter host is reachable.
Firewall Policy (Optional)
The following IP addresses and ports are examples. Update them based on your environment before applying the network rules.
| Source Address | Target Address | Target Port | Description |
|---|---|---|---|
| Collector Host | Guanyun Platform | 80 | Installing Collector and uploading data to Guanyun Platform |
| Collector Host | Prometheus Exporter | 9090 | Reading Prometheus Exporter data |
Installing Collector
-
Log in to Guanyun Platform.
-
In the left navigation bar, click All Apps, then click Deployment Status in the lite app list.
-
On the deployment status page, click the Collectors Operation tab at the top of the page.
-
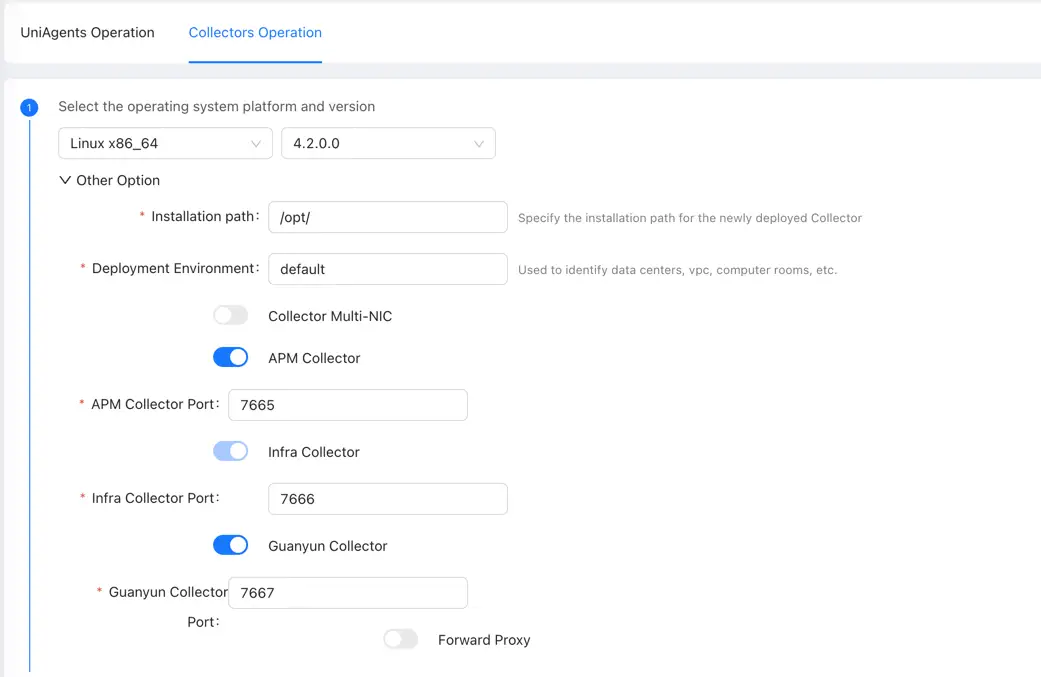
Click Create in the upper right corner and configure the Collector parameters:
- You need to enable Guanyun Collector to ingest Prometheus monitoring data.
-
Copy the Collector installation script and run it on the host where you want to deploy Collector to complete the installation.
Configuring Collector to Receive Prometheus Data
- Enter the Collector installation directory.
cd /opt/tingyun-collector/
- Enable the Prometheus module (Host metrics only).
cd conf.d/prometheus
cp host-receiver.yaml.example host-receiver.yaml
cp host-processor-exporter.yaml.example host-processor-exporter.yaml
- Edit the configuration for receiving Prometheus data. Make sure you update
targetsandmetrics_path.
vim host-receiver.yaml
receivers:
  prometheus/host:
    report_extra_scrape_metrics: false
    config:
      scrape_configs:
        - job_name: 'guanyun-default-prometheus'
          scrape_interval: 60s

          # password and password_file are mutually exclusive. password must be plaintext; password_file must also be plaintext and can be set chmod 600 for the current user
          #basic_auth:
          #  username: ""
          #  password: ""
          #  password_file:

          # Required
          # Prometheus scrape URI
          # Default /federate
          metrics_path: /federate
          params:
            'match[]':
              - '{__name__=~"node_cpu.*"}'
              - '{__name__=~"node_uname.*"}'
              - '{__name__="node_memory_MemFree_bytes"}'
              - '{__name__="node_memory_Shmem_bytes"}'
              - '{__name__="node_memory_Buffers_bytes"}'
              - '{__name__="node_memory_Cached_bytes"}'
              - '{__name__="node_memory_MemTotal_bytes"}'
              - '{__name__="node_memory_SwapTotal_bytes"}'
              - '{__name__="node_memory_SwapFree_bytes"}'
              - '{__name__=~"node_vmstat.*"}'
              - '{__name__=~"node_disk.*"}'
              - '{__name__=~"node_filesystem.*"}'
              - '{__name__=~"node_network.*"}'
              - '{__name__="node_netstat_Tcp_CurrEstab"}'
              - '{__name__="node_sockstat_TCP_tw"}'
              - '{__name__=~"node_load.*"}'
          static_configs:

            # Required
            # Prometheus scrape IP and port
            # Example: ['192.168.1.1:9090']
            - targets: ['']
          metric_relabel_configs:
            - source_labels: [exported_instance]
              target_label: exported_instance
              regex: '(.+):.*'
              replacement: '$${1}'
The default scrape path is /federate. If Prometheus is configured with --web-external-url=prometheus, set metrics_path: /prometheus/federate.
- Restart the Collector.
After updating the configuration, restart Collector:
sudo systemctl restart tingyun-collector
Validating Data
tail -f /opt/tingyun-collector/logs/guanyun/collector.log
Viewing Data in Guanyun Platform
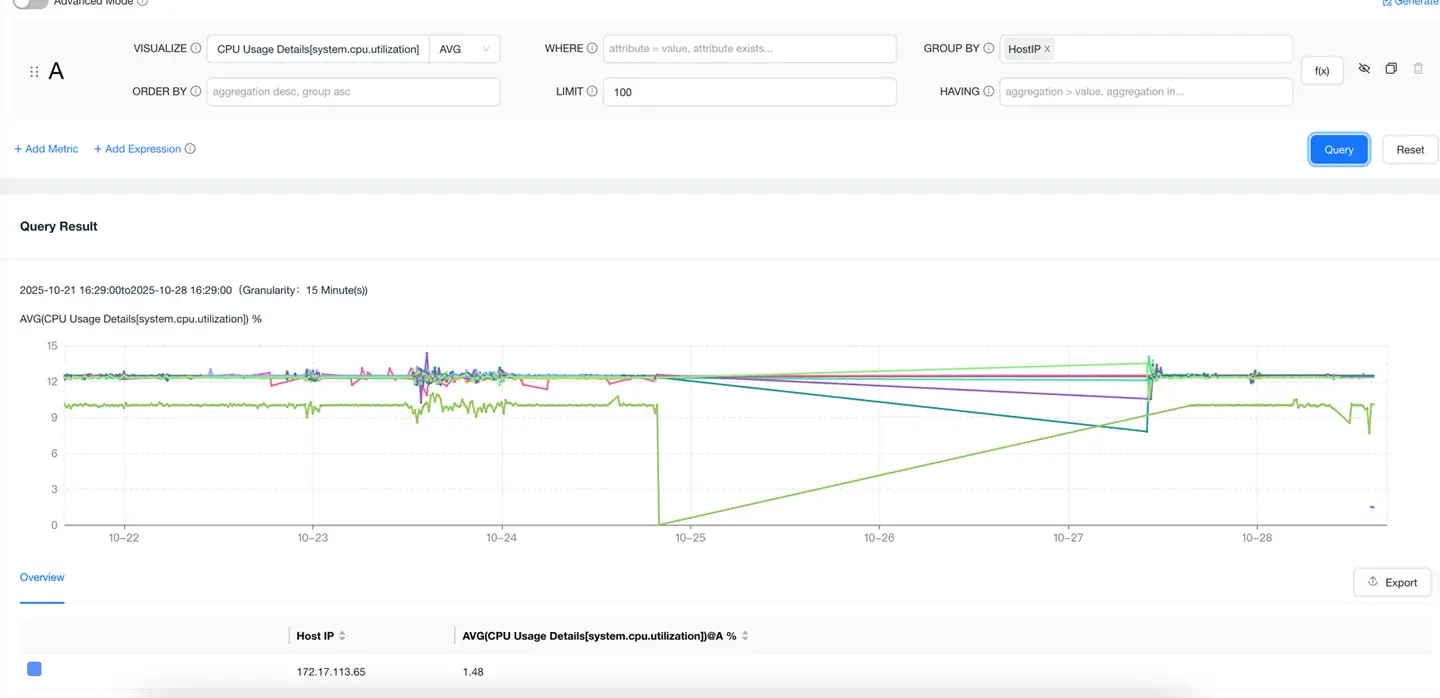
Go to the Data Explorer lite app, select METRIC as the data model, query any host metric, group by host IP, and confirm that the integrated Prometheus host IP appears in the list.