Integrating OpenTelemetry Trace and Metric Data
Compatibility
- Currently, only the OpenTelemetry Java Agent is supported. Supported agent versions: 2.0–2.21.
- Collector: 4.2.0.0 or later, with the Guanyun Collector module enabled.
Collector Host Resource Requirements
- Minimum resource requirements:
- Operating system: CentOS 7 or later, Red Hat Enterprise Linux 7 or later, Ubuntu 18 or later.
- CPU: 4 cores or more.
- Memory: 8 GB or more.
-
Deployment limitation: In the same deployment environment, only one Collector can be deployed to ingest OpenTelemetry traces. Horizontal scaling by deploying multiple Collector instances is not supported.
-
Capacity reference: Based on testing, a Collector deployed on a host with 4 CPU cores and 8 GB memory can handle about 1500 TPS of OpenTelemetry trace traffic.
-
Scaling recommendation: If the ingestion rate exceeds 1,500 TPS, scale up the Collector host. You can estimate CPU and memory using:
CPU cores = 4 * peak TPS per day / 1500

Memory (GB) = 8 * peak TPS per day / 1500
Firewall Policy (Optional)
OpenTelemetry Agent collects data on your application host and uploads it to Collector. Ensure network connectivity between the OpenTelemetry Agent host and the Collector host to guarantee data collection and transmission.
The following IP addresses and ports are examples. Update them based on your environment before applying the network rules.
| Source Address | Target Address | Target Port | Description |
|---|---|---|---|
| Collector Host | Guanyun Platform | 80 | Installing Collector and uploading data to Guanyun Platform |
| OpenTelemetry Agent Host | Collector Host | 7667 (HTTP) | Receiving data reported by the OpenTelemetry Agent |
Installing Collector
-
Log in to Guanyun Platform.
-
In the left navigation bar, click All Apps, then click Deployment Status in the lite app list.
-
On the deployment status page, click the Collectors Operation tab at the top of the page.
-
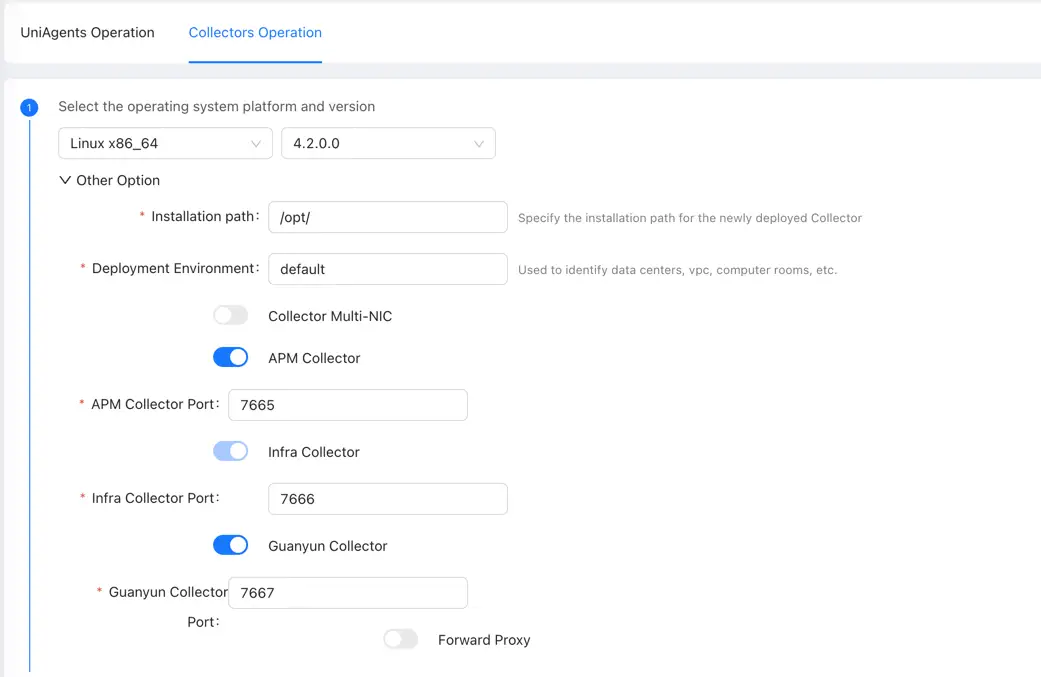
Click Create in the upper right corner and configure the Collector parameters:
- We recommend disabling APM Collector. APM features consume significant CPU resources, so disabling it helps reduce interference between APM and OpenTelemetry traces.
- You must enable Guanyun Collector to ingest monitoring data generated by OpenTelemetry.
-
Copy the Collector installation script to the target server and run it to install Collector.
Configuring Collector to Receive OpenTelemetry Data
-
Enter the Collector installation directory.
cd /opt/tingyun-collector/ -
Enable the OpenTelemetry module (currently, only Java Agent data collection is supported).
cd conf.d/o11y
cp o11y-processor-exporter.yaml.example o11y-processor-exporter.yaml
The ServiceGraph correlation window is set to 1 minute by default. If request intervals between services exceed 1 minute in the same trace, some relationships may not be correlated correctly.
To extend the correlation window, edit
connectors.servicegraph.store.ttlino11y-processor-exporter.yaml:store:
ttl: 1mNoteIncreasing this value will increase the Collector memory usage. Adjust carefully based on your actual workload.
-
Restart the Collector.
After updating the configuration, restart the Collector:
sudo systemctl restart tingyun-collector
Embedding OpenTelemetry Agent in a Java Application (Example)
-
Download the OpenTelemetry Java agent.
Example (v2.21.0):
wget https://github.com/open-telemetry/opentelemetry-java-instrumentation/releases/download/v2.21.0/opentelemetry-javaagent.jarOfficial reference: OpenTelemetry documentation
-
Modify the Java application startup script.
java -javaagent:path/to/opentelemetry-javaagent.jar \
  -Dotel.service.name=your-service-name \ #Application name
  -Dotel.traces.exporter=otlp \ #Set the traces exporter to Collector
  -Dotel.metrics.exporter=otlp \ #Set the metrics exporter to Collector
  -Dotel.exporter.otlp.protocol=http/protobuf \ #Protocol for exporting data to Collector (gRPC is not supported yet)
  -Dotel.exporter.otlp.endpoint=http://192.168.1.2:7667 \ #Collector address:port
  -Dotel.resource.attributes=service.port=8080,host.ip=192.168.1.8 \ #Add custom attributes
  -jar your-application.jar
Parameters:
-Dotel.service.name: Service name. We recommend using the application name so you can easily identify it in dashboards.-Dotel.exporter.otlp.endpoint: Collector receiver address:port. The default port is7667.-Dotel.resource.attributes: Custom attributes. You can add multiple attributes to make filtering easier:service.port: Application port (optional; OpenTelemetry Java Agent cannot capture the application port automatically). This is useful when multiple applications are deployed on the same host.host.ip: Application host IP (optional; OpenTelemetry Java Agent cannot capture host IP automatically). This is useful when applications are deployed across multiple hosts.
-
Validate that Collector is receiving OpenTelemetry data.
tail -f /opt/tingyun-collector/logs/guanyun/collector.log
# Check whether the log contains `Setting up own telemetry`
grep "Setting up own telemetry" collector.log
Viewing Data in Guanyun Platform
After data is ingested, verify it in Guanyun Platform:
-
Go to the Entities lite app, select APM > Application, and filter by application name
your-service-name.
-
Go to the Application lite app and filter by application name
your-service-name.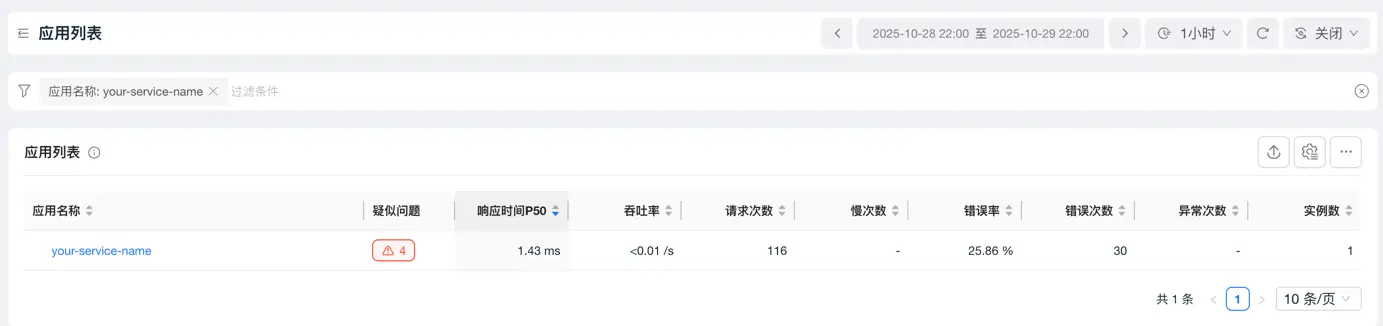
Troubleshooting
If no data appears in Guanyun Platform, troubleshoot using the following methods.
These troubleshooting methods temporarily change Collector configuration. After troubleshooting, revert the changes and restart Collector to avoid impacting performance and normal operation.
- Method 1: Enable a monitoring port and confirm data reception
Edit the Collector configuration to temporarily enable a Prometheus monitoring port (example: 8888). If the port is already in use, change it to another available port.
-
Edit the configuration file:
vim /opt/tingyun-collector/conf/guanyun/collector.yaml -
Under
service.telemetry.metrics.readers, add thepull/prometheusconfiguration. Iflevel: noneexists, comment it out temporarily:service:
telemetry:
logs:
level: INFO
output_paths: ${env:TINGYUN_COLLECTOR_HOME}/logs/guanyun/collector.log
metrics:
readers:
- pull:
exporter:
prometheus:
host: "0.0.0.0"
port: 8888
# level: none -
Restart Collector:
sudo systemctl restart tingyun-collector -
Check whether the aggregated metric count increases (an increase typically indicates normal data reception):
curl http://127.0.0.1:8888/metrics | grep "sent_metric_points"

- Method 2: Write metrics to a local file and inspect details
Temporarily write metrics to a local file via the file exporter (remove this configuration after troubleshooting).
-
Edit the Collector configuration file and add a
fileexporter:vim /opt/tingyun-collector/conf/guanyun/collector.yamlexporters:
debug:
verbosity: "${env:TINGYUN_GUANYUN_LOGLEVEL}"
file:
path: /opt/tingyun-collector/guanyun-collector.json -
Edit the pipeline configuration and add
filetoexportersin themetrics/o11ypipeline:vim /opt/tingyun-collector/conf.d/o11y/o11y-processor-exporter.yamlservice:
pipelines:
traces/o11y:
receivers: [otlp]
processors: [groupbytrace/o11y, groupbyattrs/o11y]
exporters: [servicegraph, otlphttp/default]
metrics/servicegraph:
receivers: [servicegraph]
processors: [filter/servicegraph, cumulativetodelta/o11y/sg]
exporters: [otlphttp/default]
metrics/o11y:
receivers: [otlp]
processors: [filter/o11y, transform/o11y, cumulativetodelta/o11y/metric]
exporters: [file, otlphttp/default] -
Restart Collector:
sudo systemctl restart tingyun-collector -
Check whether the output file is receiving data:
tail -f /opt/tingyun-collector/guanyun-collector.json