接入Prometheus数据
适配范围
Collector:4.2.0.0及以上,并启用Guanyun Collector模块。
确认Collector部署位置
Collector需要读取Prometheus Exporter接口数据,因此需要确保Collector与Prometheus Exporter所在服务器网络连通。
配置防火墙策略(可选)
提示
下表为示例地址与端口。请结合实际项目的地址规划和端口配置进行调整后再实施。
| 源地址 | 目标地址 | 目标端口 | 说明 |
|---|---|---|---|
| Collector所在服务器 | 观云平台 | 80 | Collector安装,向观云平台上传数据 |
| Collector所在服务器 | Prometheus Exporter | 9090 | 读取Prometheus Exporter数据 |
安装Collector
-
登录观云平台。
-
在左侧导航栏点击全部应用,在打开的轻应用列表中点击部署状态。
-
在部署状态页面上方点击Collectors管理页签。
-
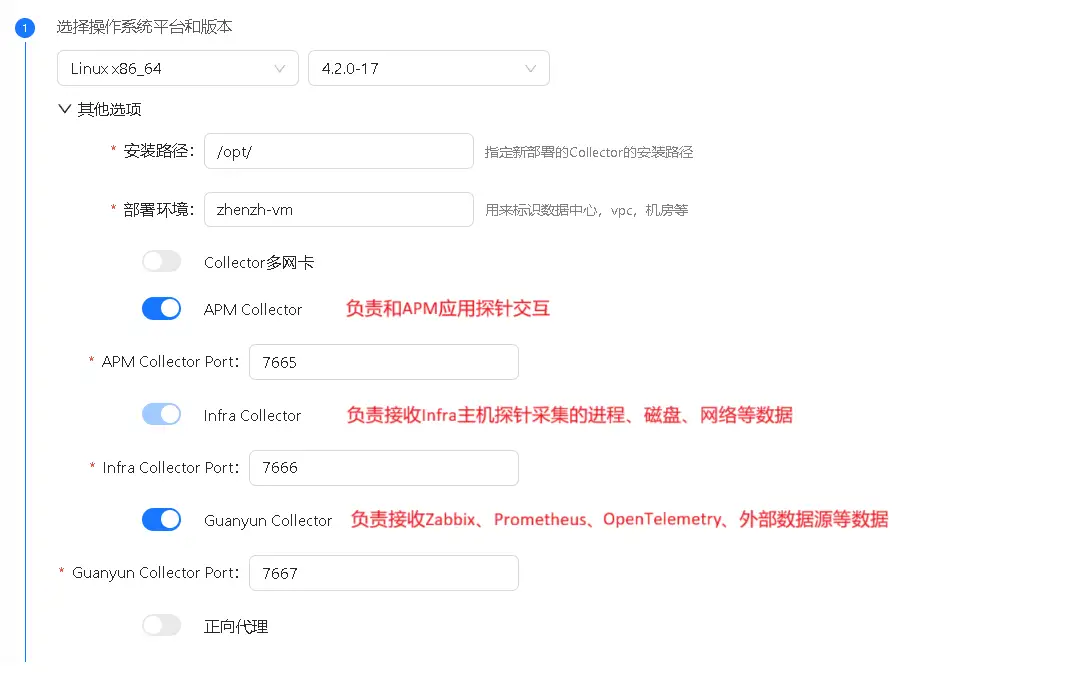
点击列表右上角的新增按钮,在打开页面中配置Collector参数:
- 必须开启Guanyun Collector:用于接收Prometheus监控数据。
-
复制Collector安装脚本,在部署Collector的服务器上执行脚本完成安装。
配置Collector接收Prometheus数据
- 进入Collector安装目录
cd /opt/tingyun-collector/
- 开启Prometheus模块(当前仅支持主机指标抽取)
cd conf.d/prometheus
cp host-receiver.yaml.example host-receiver.yaml
cp host-processor-exporter.yaml.example host-processor-exporter.yaml
- 修改接收Prometheus数据配置。注意修改
targets和metrics_path。
vim host-receiver.yaml
receivers:
  prometheus/host:
    report_extra_scrape_metrics: false
    config:
      scrape_configs:
        - job_name: 'guanyun-default-prometheus'
          scrape_interval: 60s

          # password和password_file互斥,password只能明文,password_file中也只能明文可以设置chmod 600给当前用户
          #basic_auth:
          #  username: ""
          #  password: ""
          #  password_file:

          # 必填
          # Prometheus抓取URI地址
          # 默认 /federate
          metrics_path: /federate
          params:
            'match[]':
              - '{__name__=~"node_cpu.*"}'
              - '{__name__=~"node_uname.*"}'
              - '{__name__="node_memory_MemFree_bytes"}'
              - '{__name__="node_memory_Shmem_bytes"}'
              - '{__name__="node_memory_Buffers_bytes"}'
              - '{__name__="node_memory_Cached_bytes"}'
              - '{__name__="node_memory_MemTotal_bytes"}'
              - '{__name__="node_memory_SwapTotal_bytes"}'
              - '{__name__="node_memory_SwapFree_bytes"}'
              - '{__name__=~"node_vmstat.*"}'
              - '{__name__=~"node_disk.*"}'
              - '{__name__=~"node_filesystem.*"}'
              - '{__name__=~"node_network.*"}'
              - '{__name__="node_netstat_Tcp_CurrEstab"}'
              - '{__name__="node_sockstat_TCP_tw"}'
              - '{__name__=~"node_load.*"}'
          static_configs:

            # 必填
            # Prometheus抓取IP和端口
            # 示例: ['192.168.1.1:9090']
            - targets: ['']
          metric_relabel_configs:
            - source_labels: [exported_instance]
              target_label: exported_instance
              regex: '(.+):.*'
              replacement: '$${1}'
Prometheus默认的抓取路径是/federate,如果配置了--web-external-url=prometheus,则metrics_path配置成metrics_path: /prometheus/federate。
- 重启Collector.
配置修改完成后,需要重启Collector:
sudo systemctl restart tingyun-collector
验证数据
tail -f /opt/tingyun-collector/logs/guanyun/collector.log
查看报表
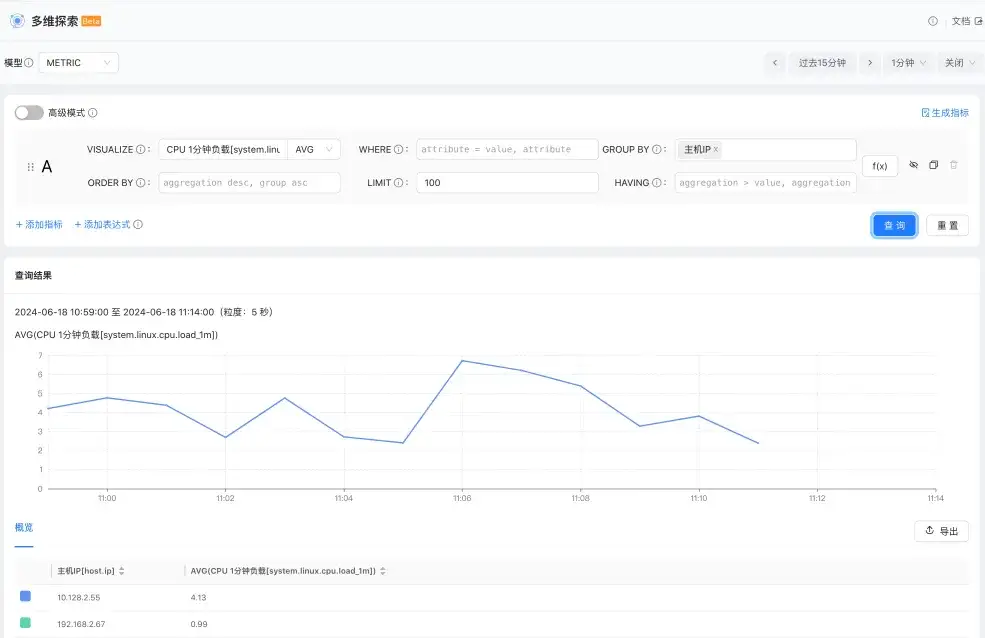
进入观云平台多维探索轻应用,选择模型为METRIC,查询任意主机指标并按主机IP分组,确认列表中存在已接入的Prometheus主机IP。