Starting a Conversation
This feature is still under development, but we’d love you to try it.
All content is generated by AI. Please verify the output carefully.
Guanyun AI combines state-of-the-art large language models (LLMs) with Guanyun Platform. With AI-powered analysis, it provides deeper incident insights and faster resolution guidance, helping you identify key issues behind system behavior and solve technical problems more efficiently.
Ⅰ、Using the AI Interface
1、Starting a Conversation
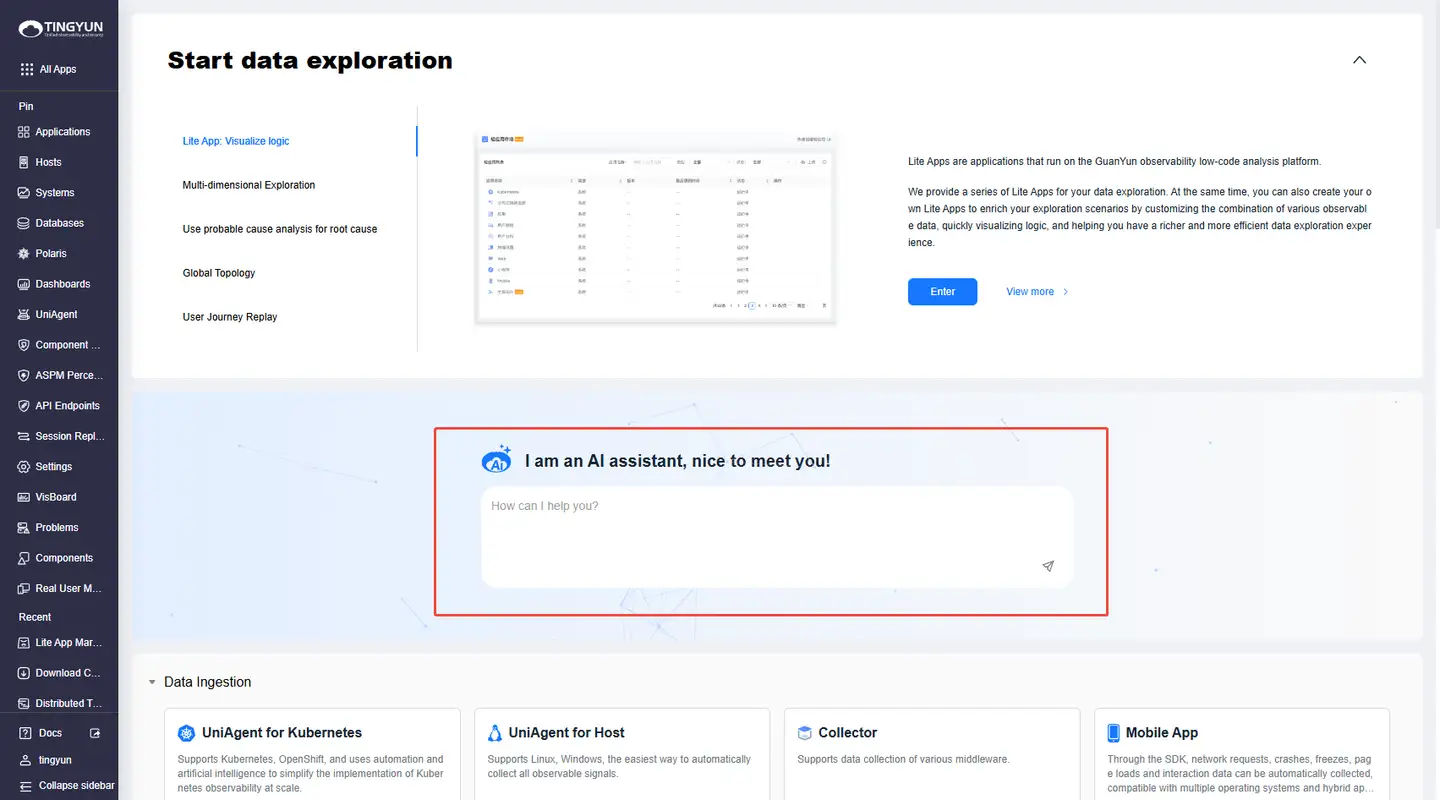
- Option 1: Log in to Guanyun Platform, open the landing page, enter your question in the AI input box, and press Enter to open the Guanyun AI chat panel.
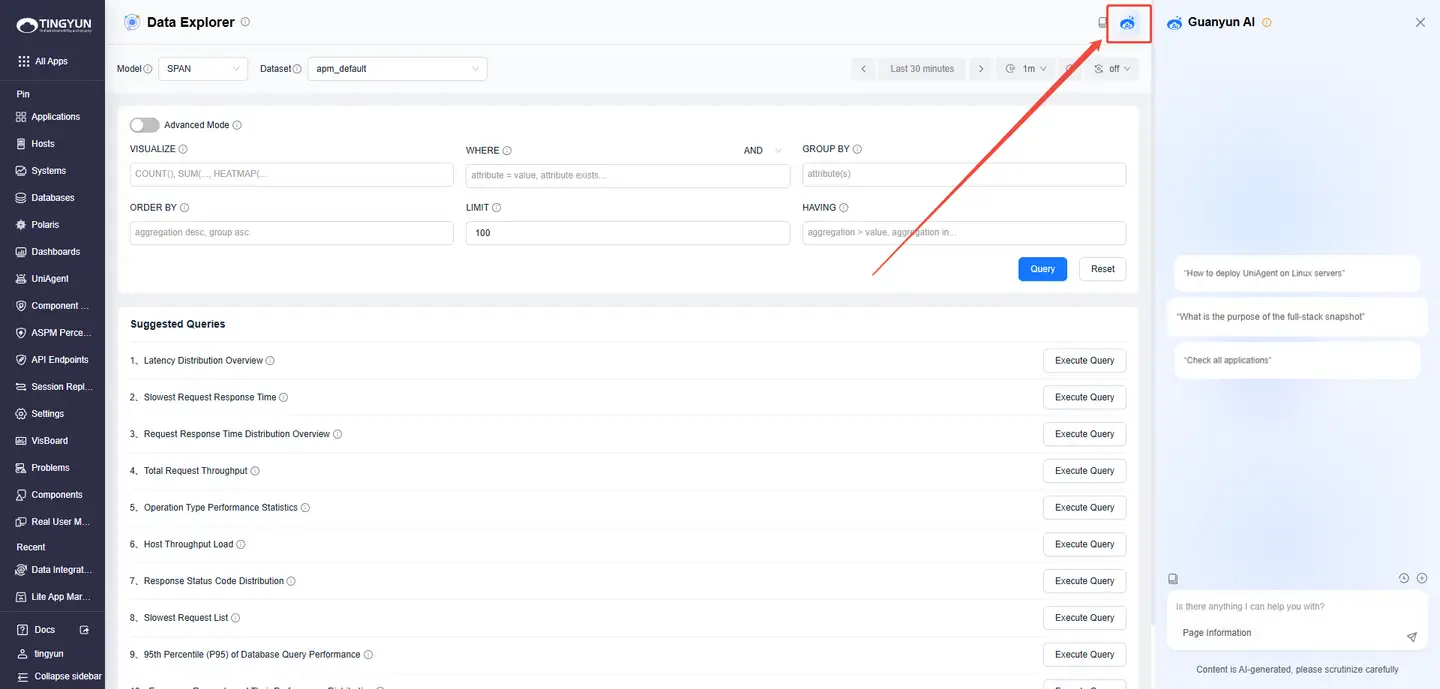
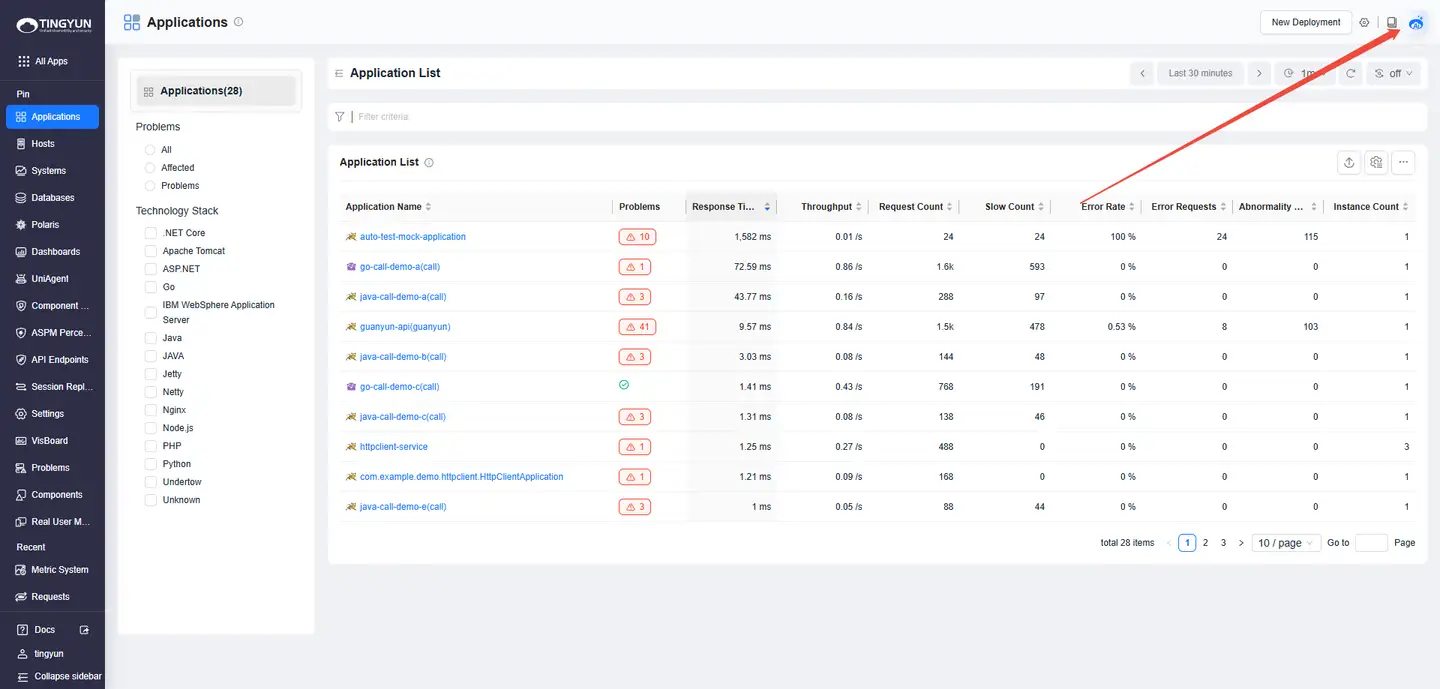
- Option 2: On any feature page, click the Guanyun AI icon in the upper-right corner to open the chat panel.
2、Viewing Historical Conversation
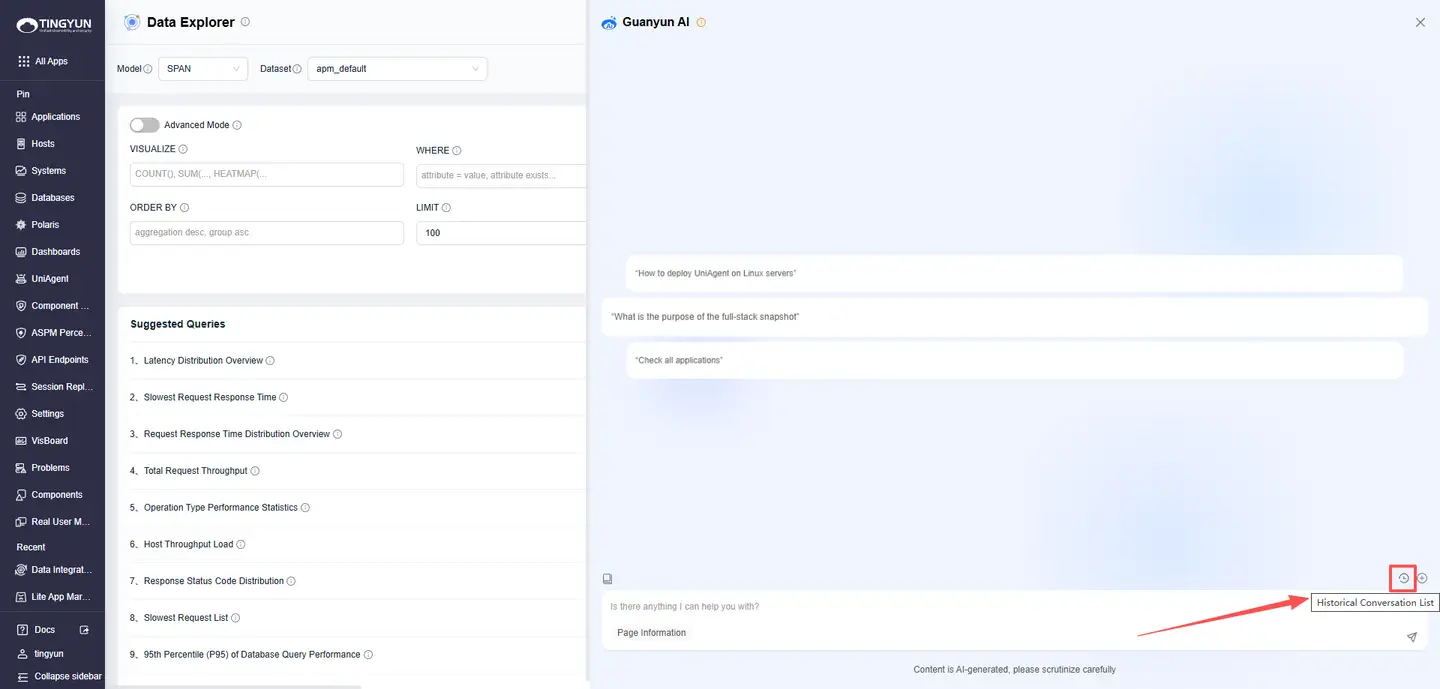
Click Historical Conversation List. On the Conversation History page, you can delete or search past conversations, or resume any previous thread.
3、Starting a New Conversation
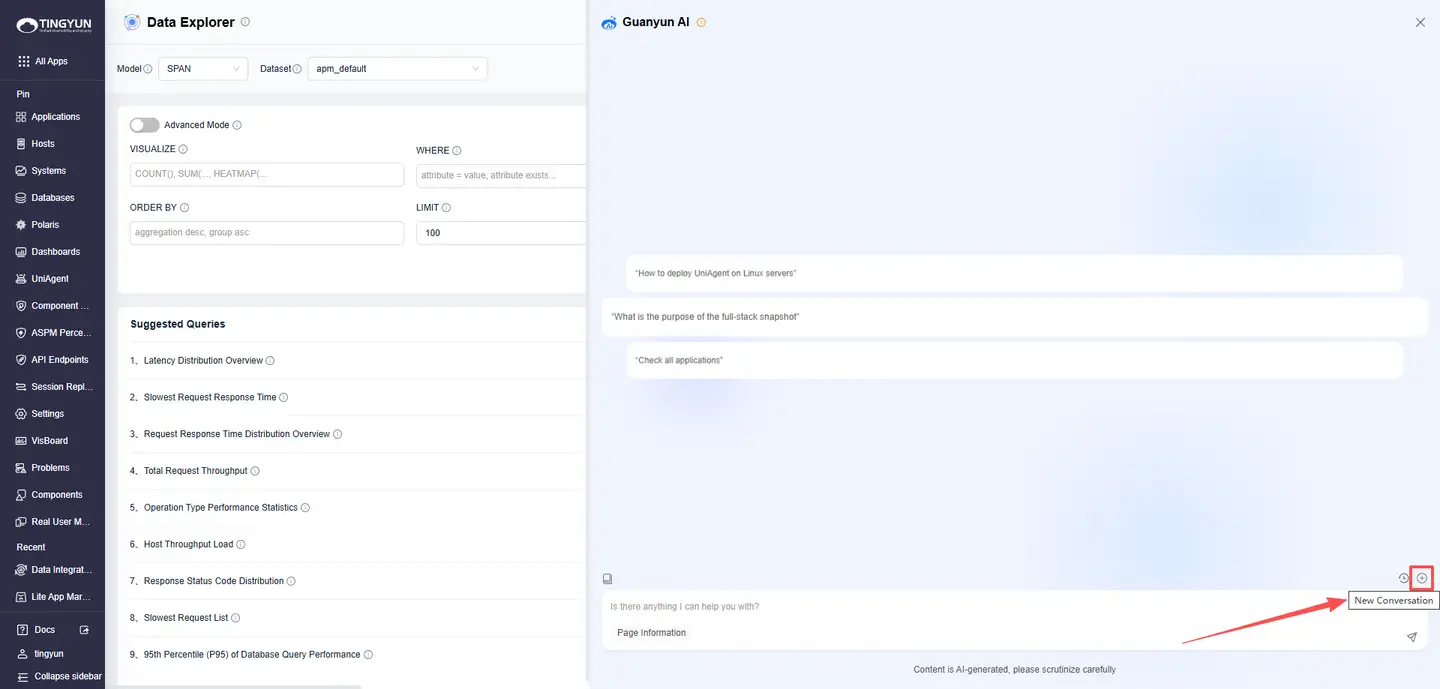
Click New Conversation to start a fresh Conversation and reduce answer drift caused by overly long context.
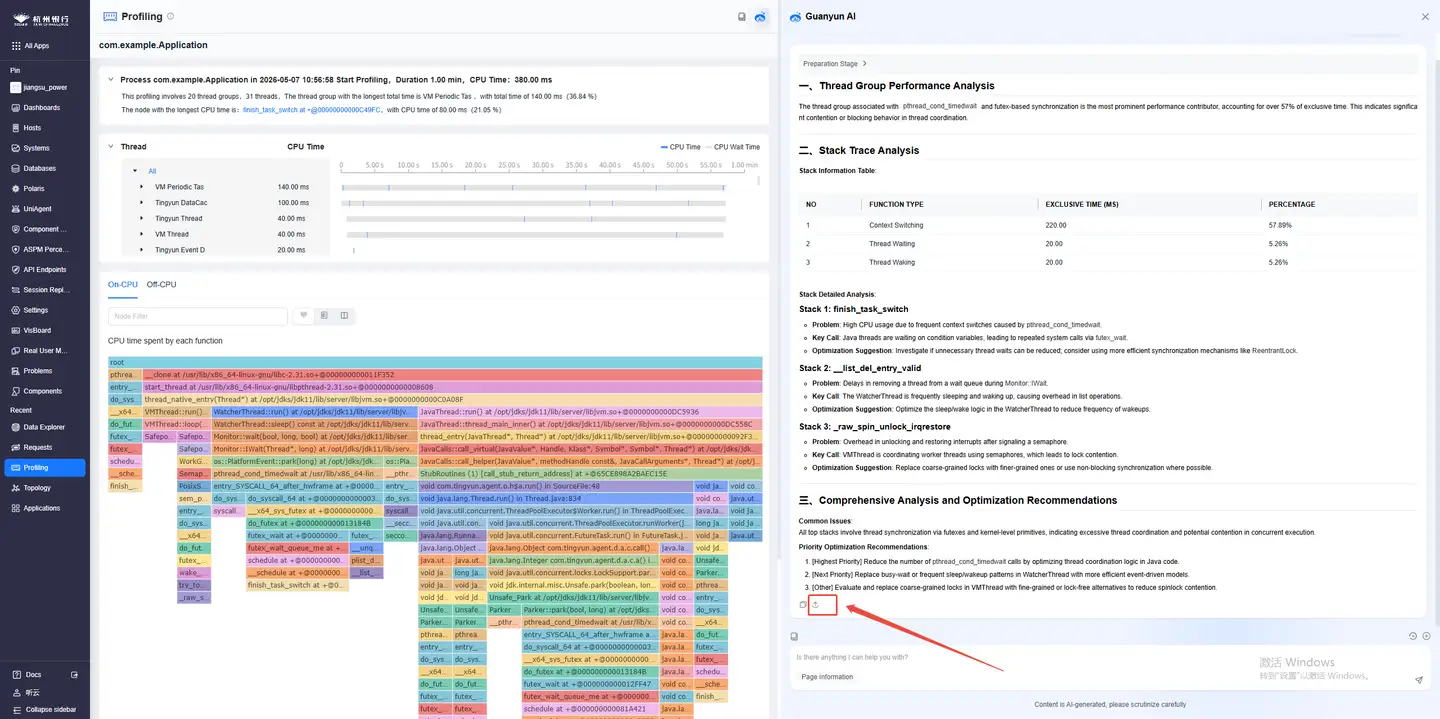
4、Export markdown file
After the Q&A session, simply click on the "Export" icon located in the bottom left corner of the result box to export the md file
Ⅱ、Introducing Q&A Features
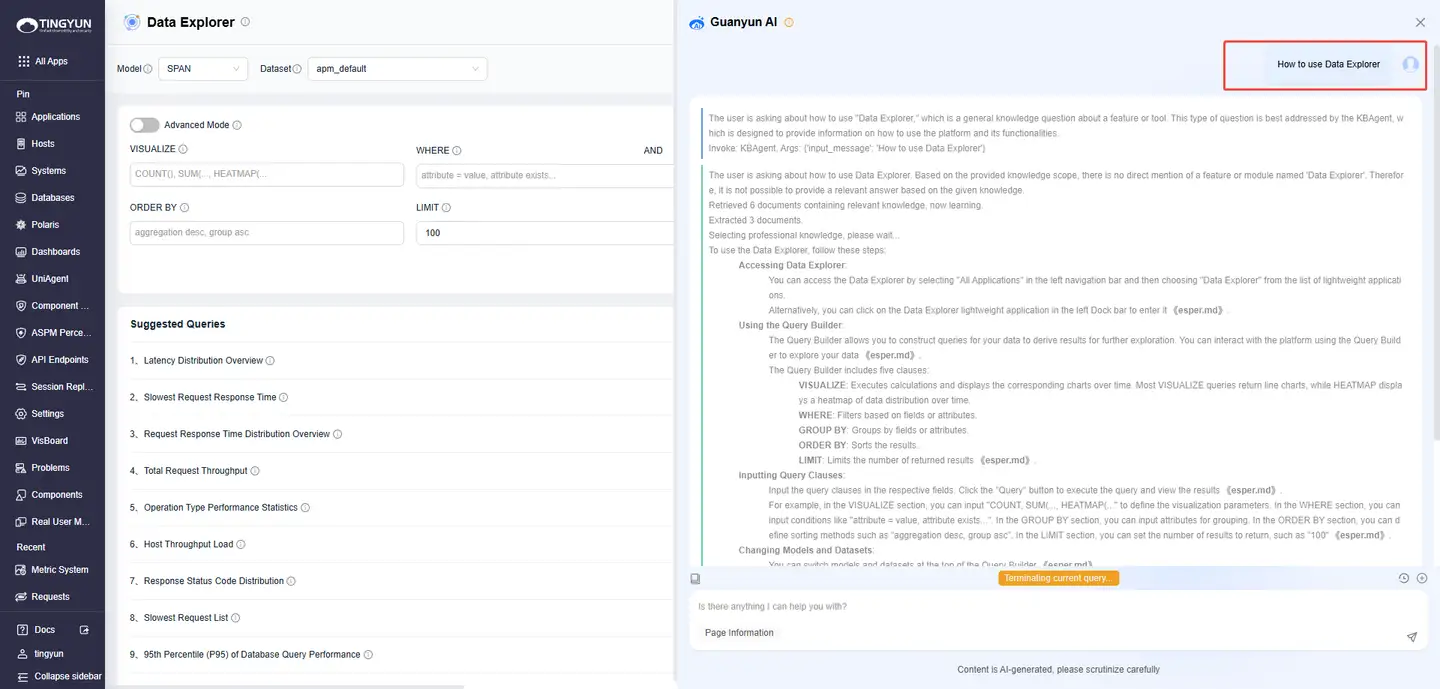
1、Knowledge Base Q&A
With knowledge base training, Guanyun AI can communicate with you in natural language. Describe your issue in the chat box, and Guanyun AI will automatically match relevant content and provide recommended steps and reference documents.
Try asking:
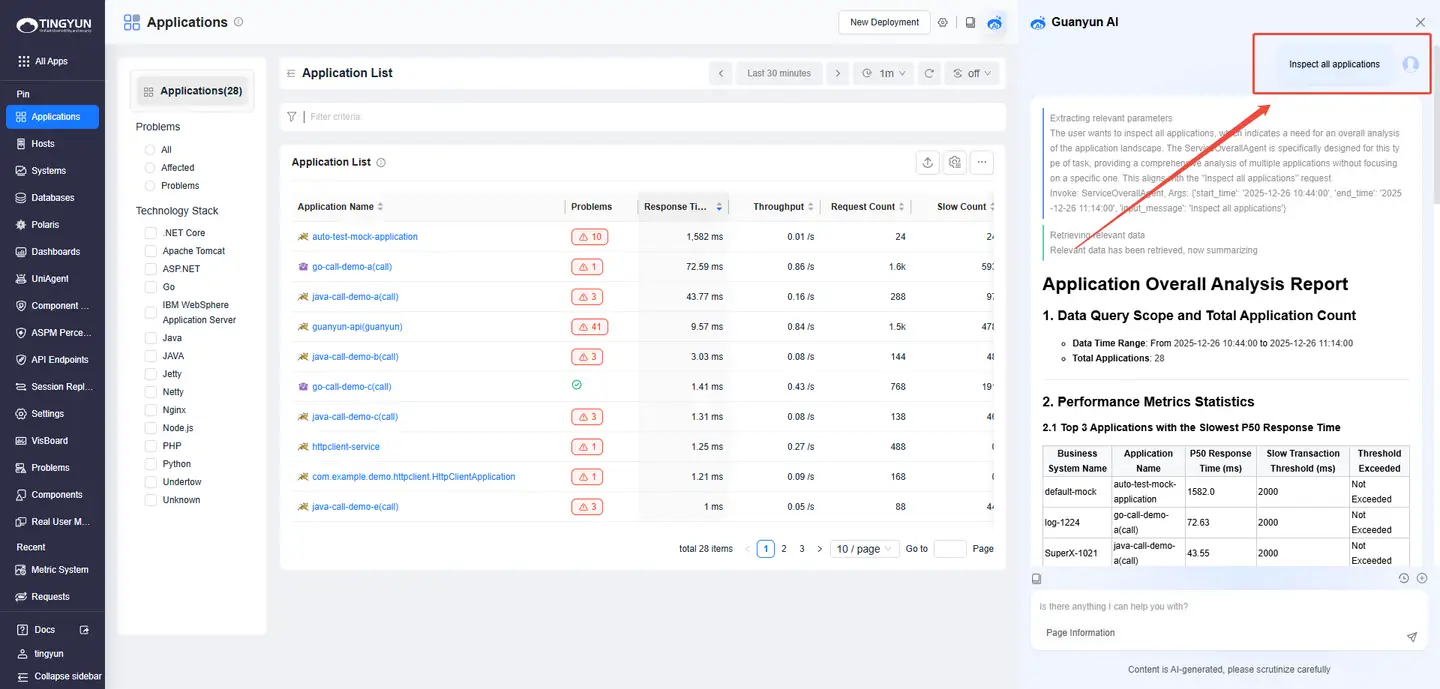
- Inspect all applications
- How to deploy UniAgent on a Linux server
- What is the purpose of a full-stack snapshot
Current supported scenarios:
- Operations knowledge Q&A (for example, Oracle and MySQL administration, troubleshooting, and tool usage).
- Natural-language metric queries across APM, RUM, and host metrics.
- AI-assisted analysis for response time, errors, and other signals across applications, instances, and requests.
- Script generation based on your requirements (Shell scripts).
- In-product documentation Q&A for platform features.
Example:
2、One-Click Metric Analysis
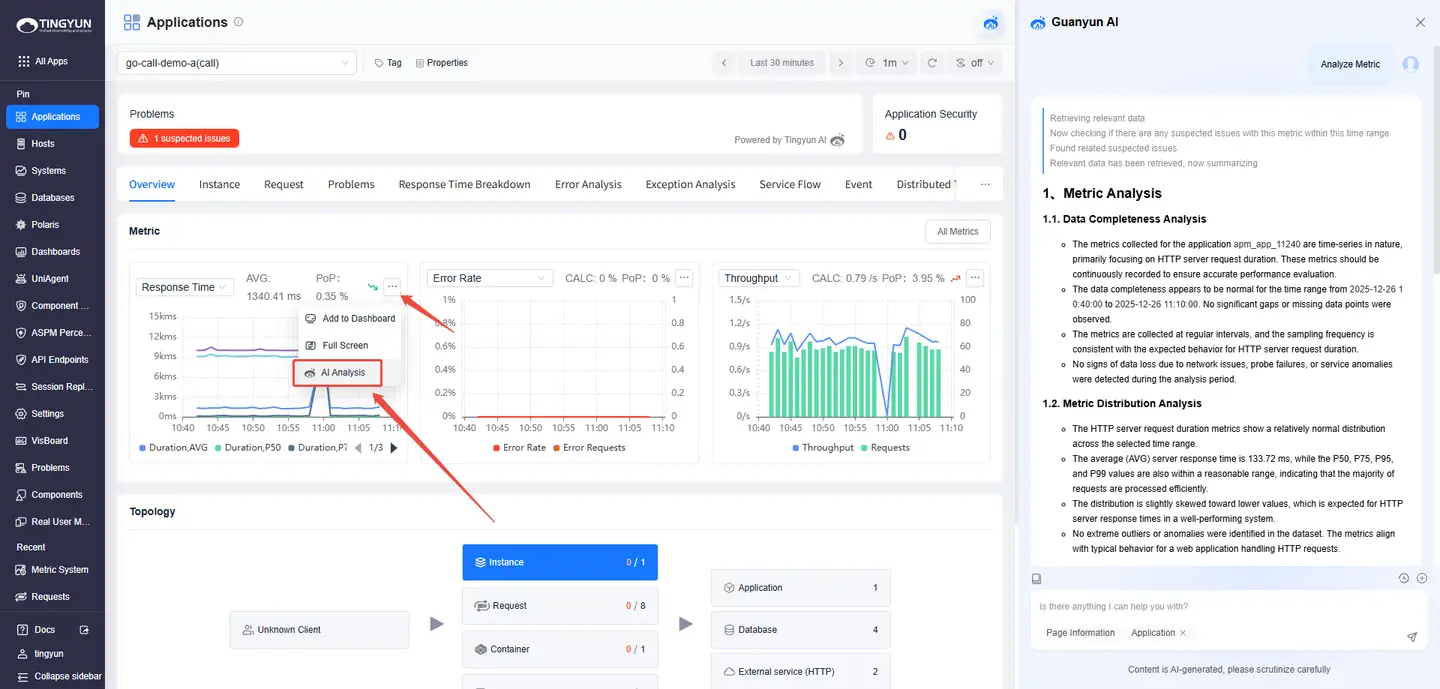
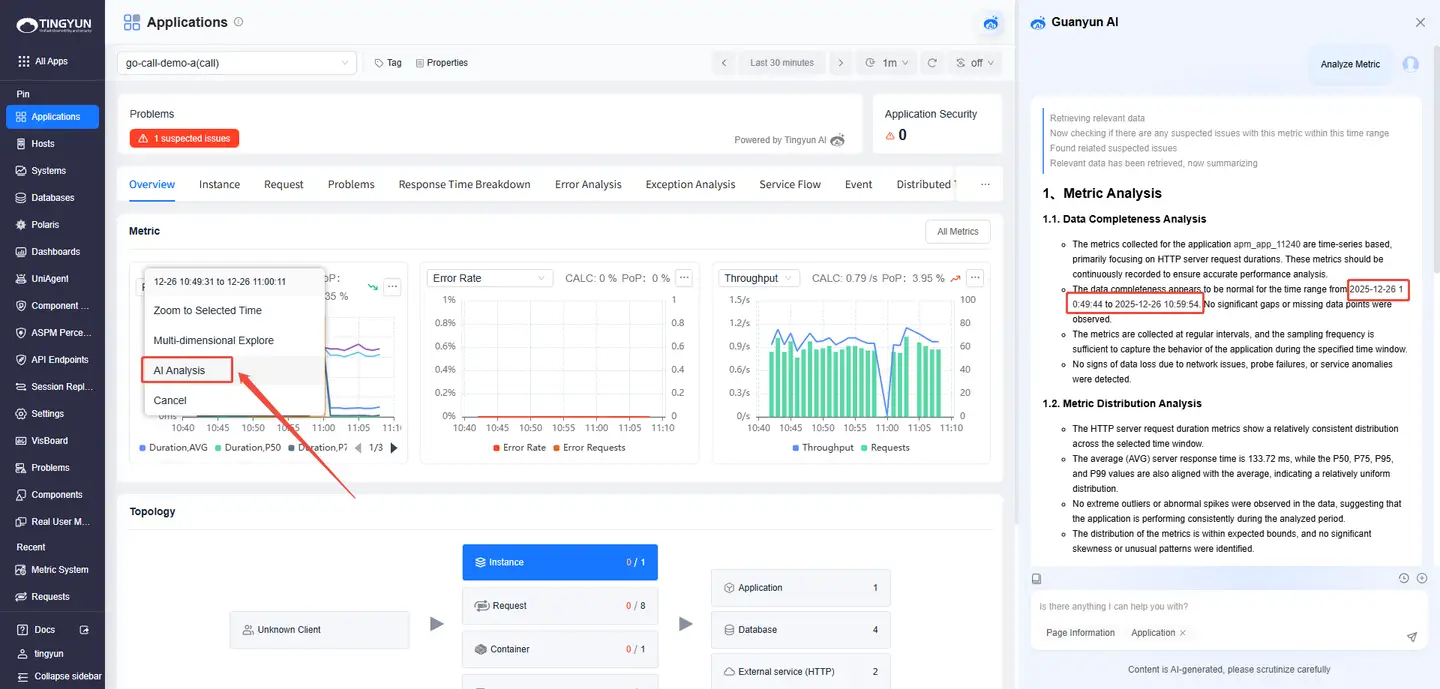
Guanyun AI identifies anomalies in key metrics for entities (Systems/Applications/Application Instances/Requests) through intelligent baseline detection. It then triggers deep diagnostics based on the metric type, enabling a closed-loop workflow from detecting issues to identifying root cause. There are two entry points:
- Entry 1: On an entity details page, in a metric trend chart, click ··· in the upper-right corner and select AI Analysis.
- Entry 2: Select a time range in a metric trend chart and click AI Analysis.
3、AI-Assisted Analysis
Guanyun AI provides end-to-end performance analysis across multiple entity dimensions, including applications, instances, requests, hosts, and databases. It combines real-time monitoring with AI-assisted analysis to help you locate performance bottlenecks and anomalies faster. You can ask questions in the following scenarios:
(1) Inspecting Entities: Open the entity list (Systems/Applications/Instances/Requests/Databases/DatabaseOperation/Hosts) and click the Guanyun AI icon in the upper-right corner.
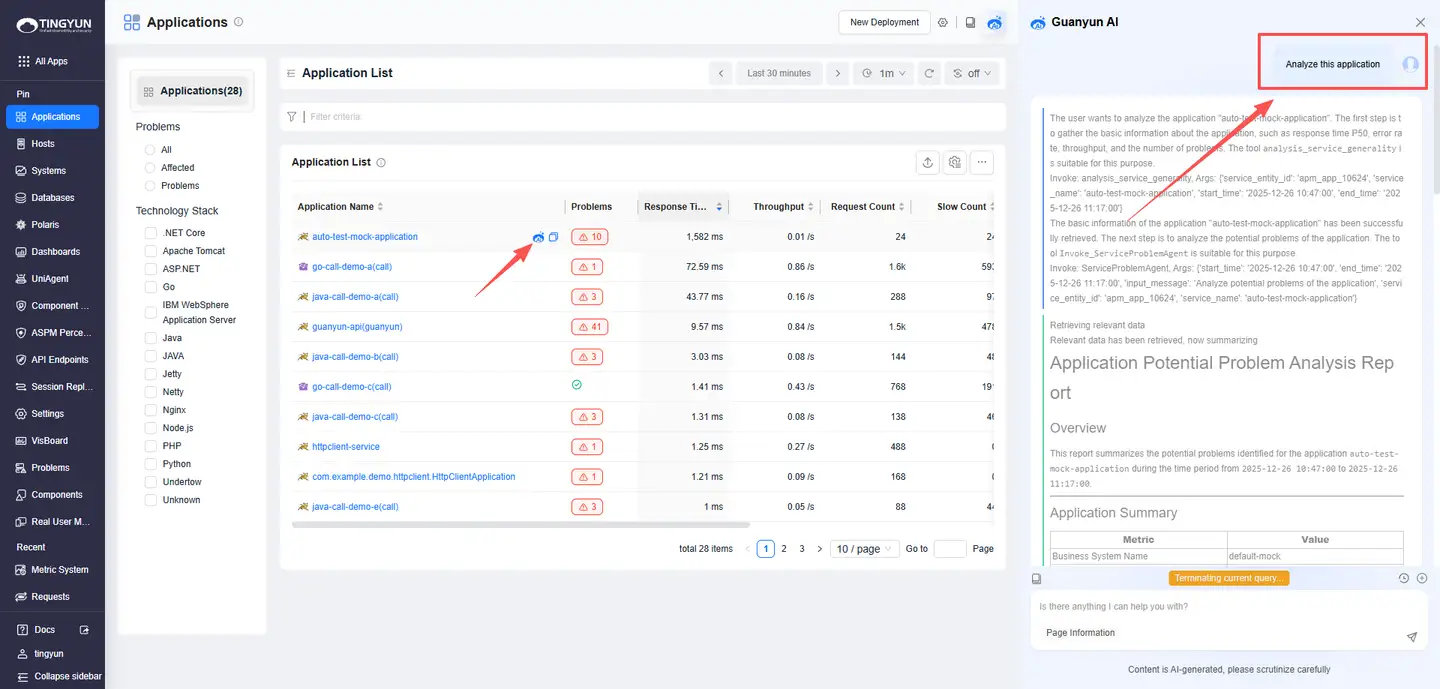
(2) One-Click Analysis: In the entity list (Systems/Applications/Instances/Requests/Distributed Tracing/Databases/DatabaseOperation/Hosts), click the Guanyun AI icon next to an entity name (the icon is hidden by default and appears on hover).
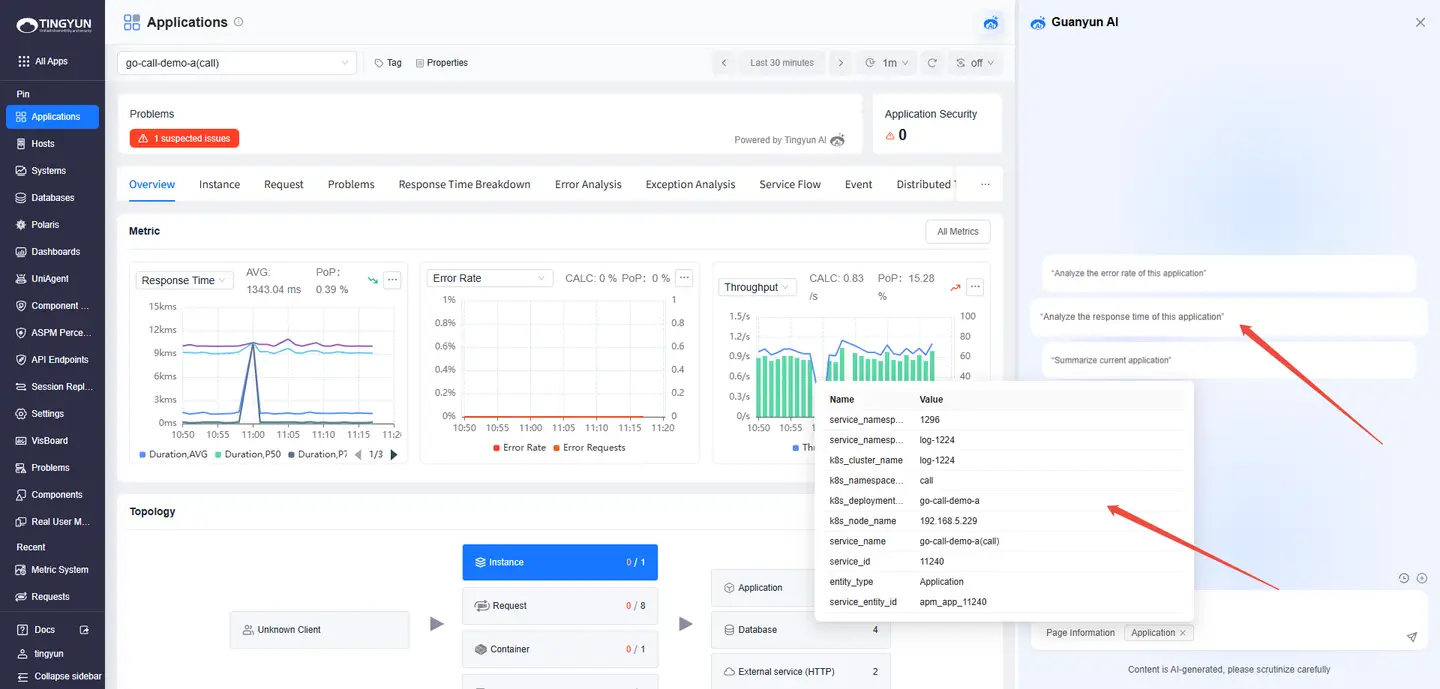
(3) Deep Analysis: On an entity details page(Systems/Applications/Instances/Requests/Databases/DatabaseOperation/Hosts), click the Guanyun AI icon in the upper-right corner. Guanyun AI can recognize the entity on the page and run metric analysis or event queries.
The following are scenario examples of continuous Q&A and multiple analysis Q&A:
Scenario 1: Continuous Q&A
| Intent | Question | Answer |
|---|---|---|
| Understand the overall health of monitored applications | Inspect all applications | Returns the top applications with anomalies in key indicators (for example, response time, error rate, throughput, and Problems). |
| Investigate an abnormal indicator for Application A | Why is Application A slow | Analyzes response time from the perspectives of instances and requests. |
| Drill down into a specific instance (Instance B) | Why is Instance B slow | Analyzes abnormal requests under this instance and provides likely root cause. |
| Drill down into a specific request (Request C) | Why is Request C slow | Analyzes the trace for this request and provides likely root cause. |
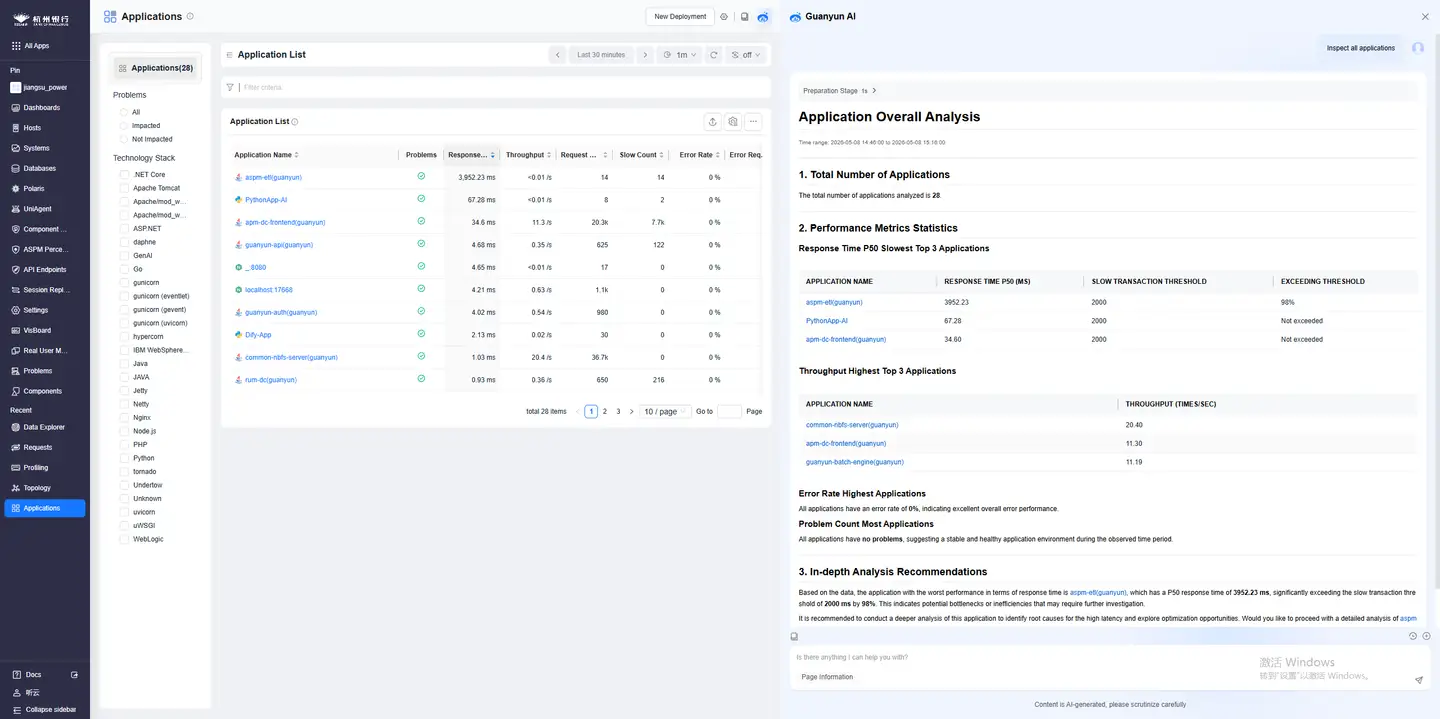
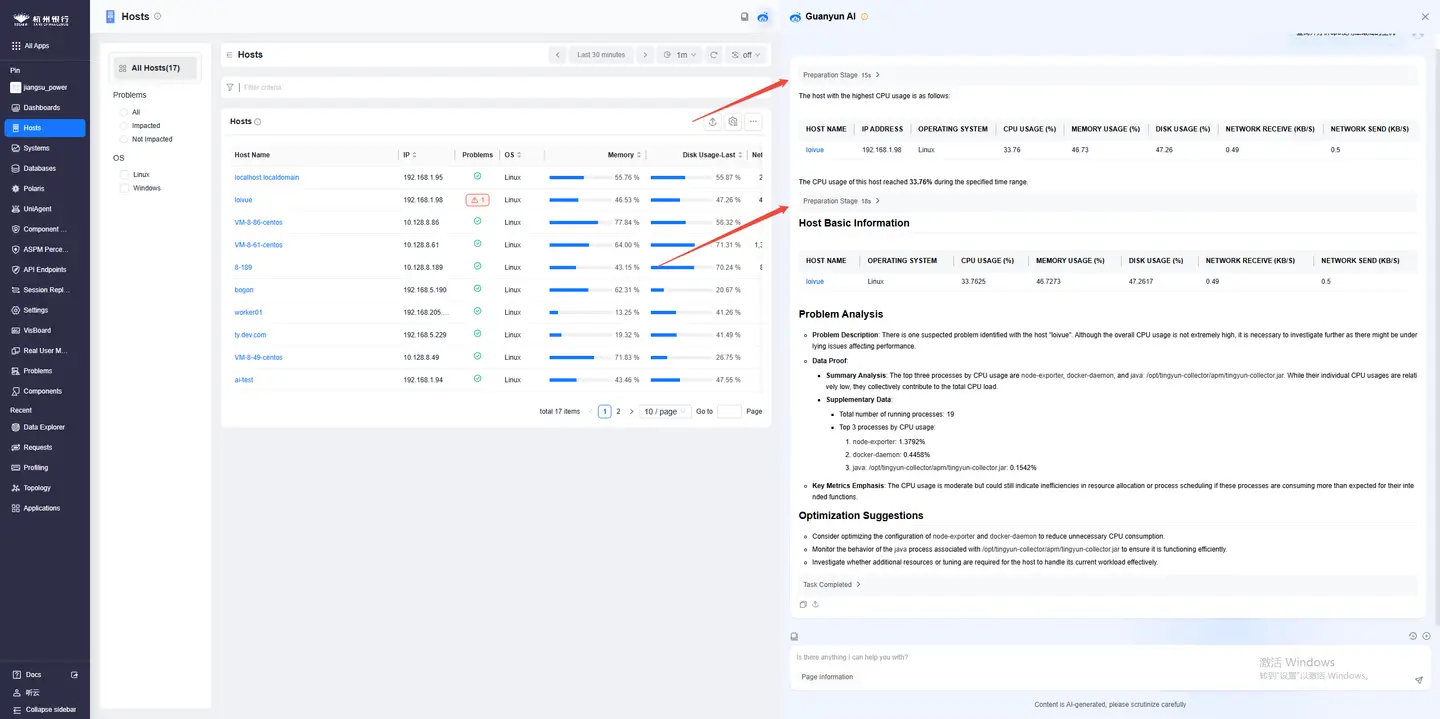
Scenario 2: Multiple analysis Q&A
| Question | Answer |
|---|---|
Query and analyze the host with the highest CPU usage rate | First, output the host with the highest CPU usage rate, and then analyze it. |
(4) ServiceFlow/Error/Exception Single Analysis
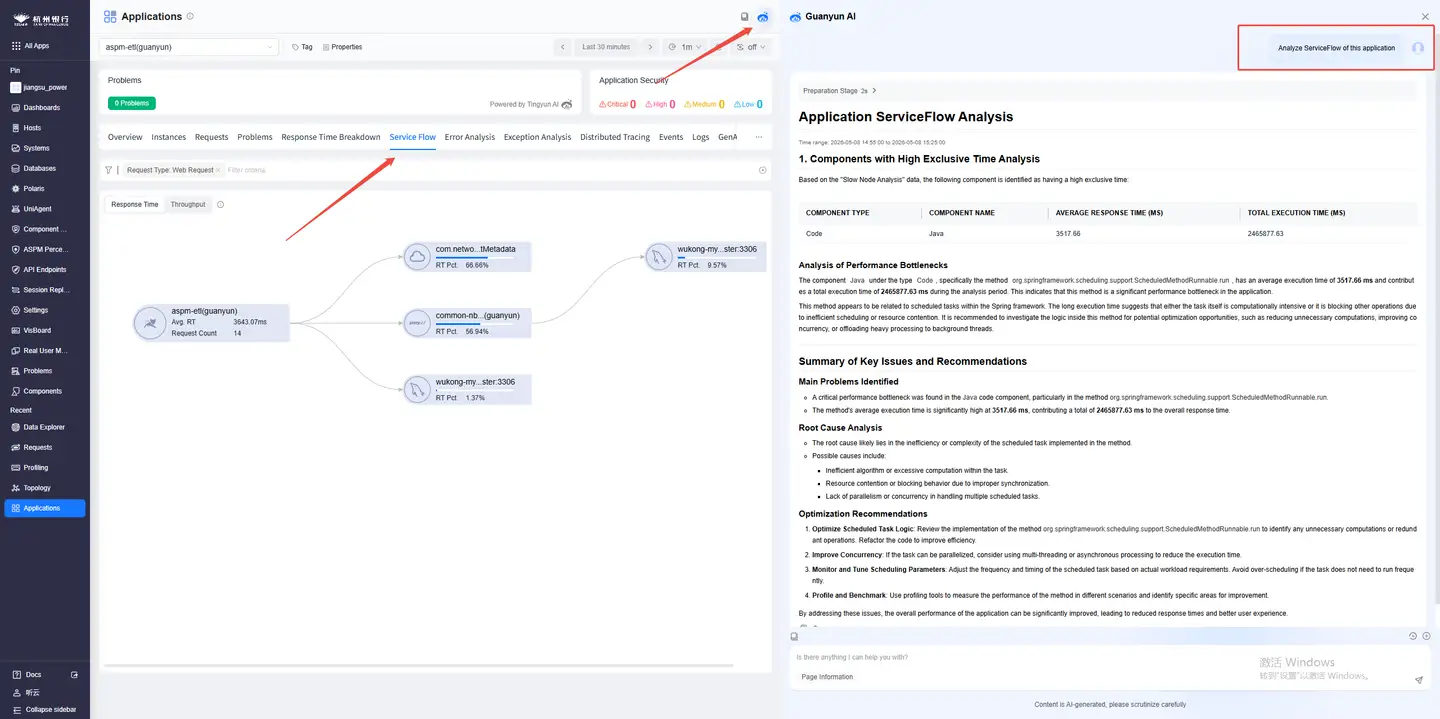
- ServiceFlow analysis (Applications/Requests): Access the ServiceFlow page and click the AI icon in the top right corner
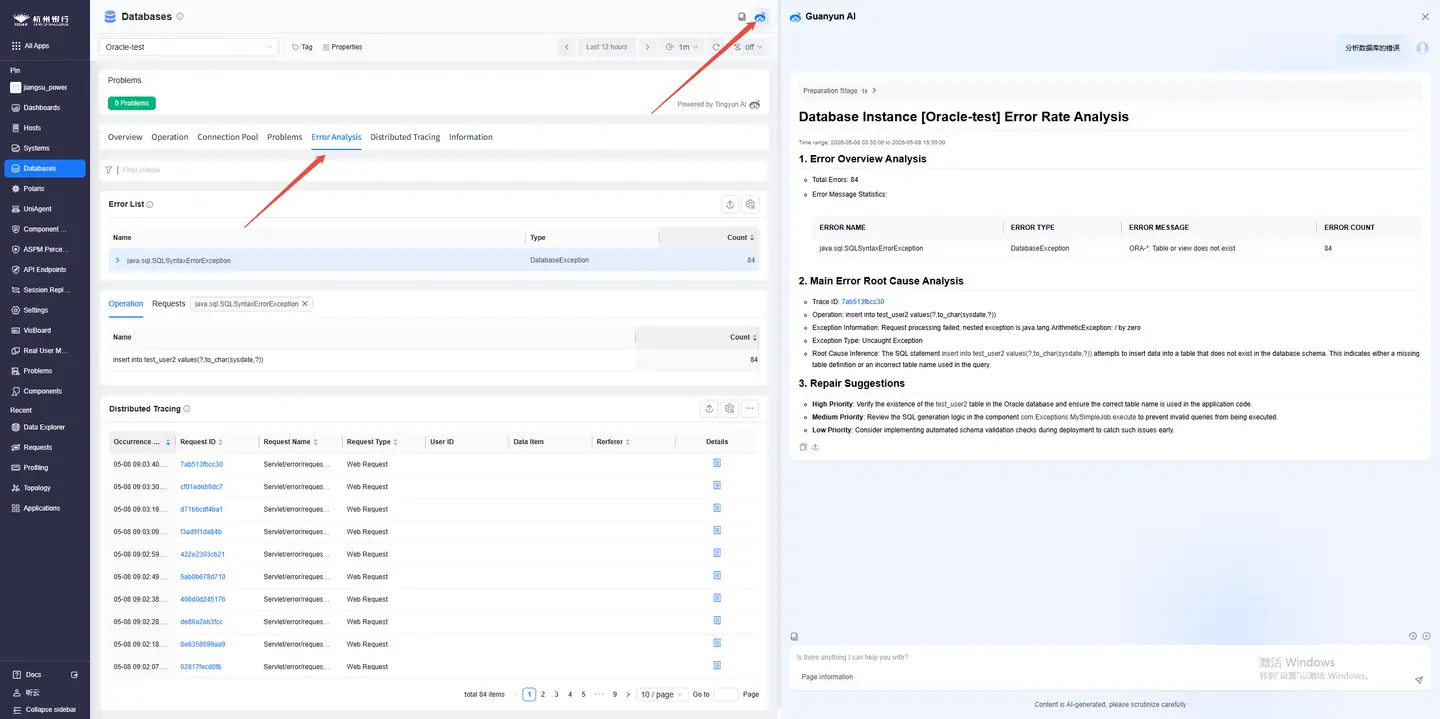
- Error analysis (Applications/Requests/Databases): Access the error analysis page and click the AI icon in the top right corner
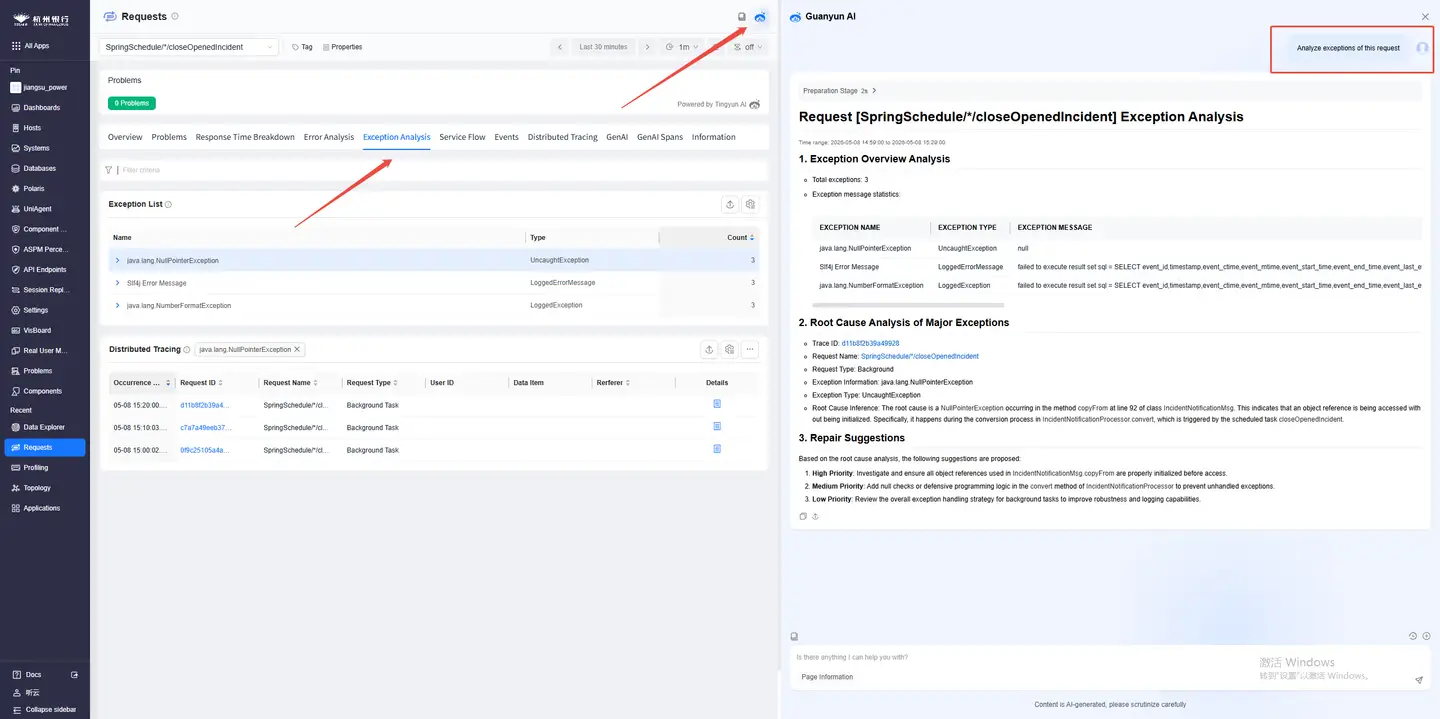
- Exception analysis (Applications/Requests): Access the anomaly analysis page and click the AI icon in the top right corner
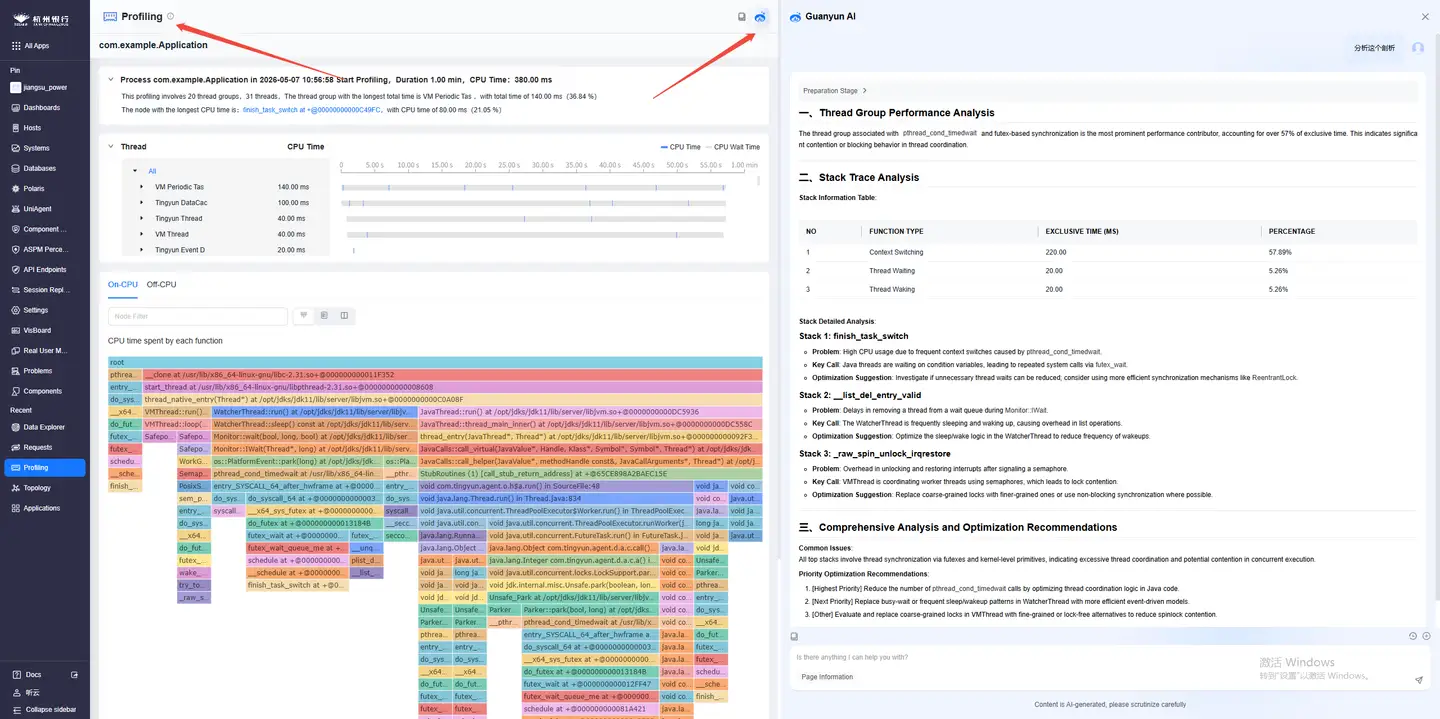
(5) eBPF analysis: Enter the diagnosis details page and click the AI icon in the top right corner
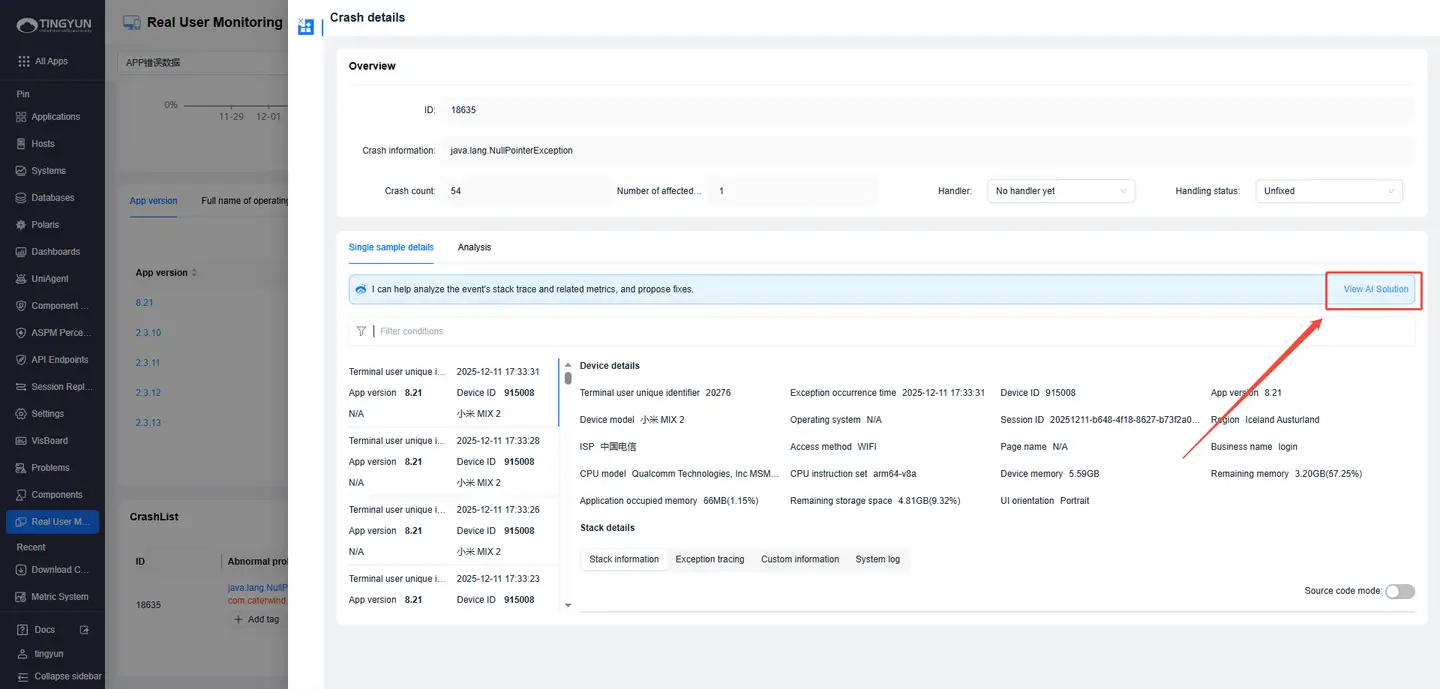
(6) RUM Crash Analysis:
In Real User Monitoring, open Crash Details and click View AI Solution.
Ⅲ、FAQ
-
Nacos Configuration
In on-premises releases, the LLM-related configuration is not included by default. If you ask a question without configuring these services, you will see: LLM, Embedding, and Rerank services are not configured. This feature is unavailable. Contact technical support to configure the required model services.