Metrics Description
Web Metrics is a new initiative pioneered by Google, aimed at providing unified guidance for web quality signals that are critical for delivering excellent web user experiences.
Over the years, Google has provided many performance measurement and reporting tools. Some developers are proficient in using these tools, while others find the large number of tools and metrics overwhelming.
Website owners don't need to be performance experts to understand the quality of experience they provide to users. The Web Metrics initiative aims to simplify the scenario and help websites focus on the most important metrics, namely Core Web Vitals.
Core Web Vitals
Core Web Vitals are a subset of Web metrics that apply to all web pages, which all website owners should measure, and these metrics will also be displayed in all Google tools. Each Core Web Vital represents a different aspect of the user experience, can be measured in practice, and reflects the true experience of user-centered key outcomes.
The composition of Core Web Vitals will evolve over time. The current metric composition for 2020 focuses on three aspects of user experience: loading performance, interactivity, and visual stability, and includes the following metrics (and their respective thresholds):
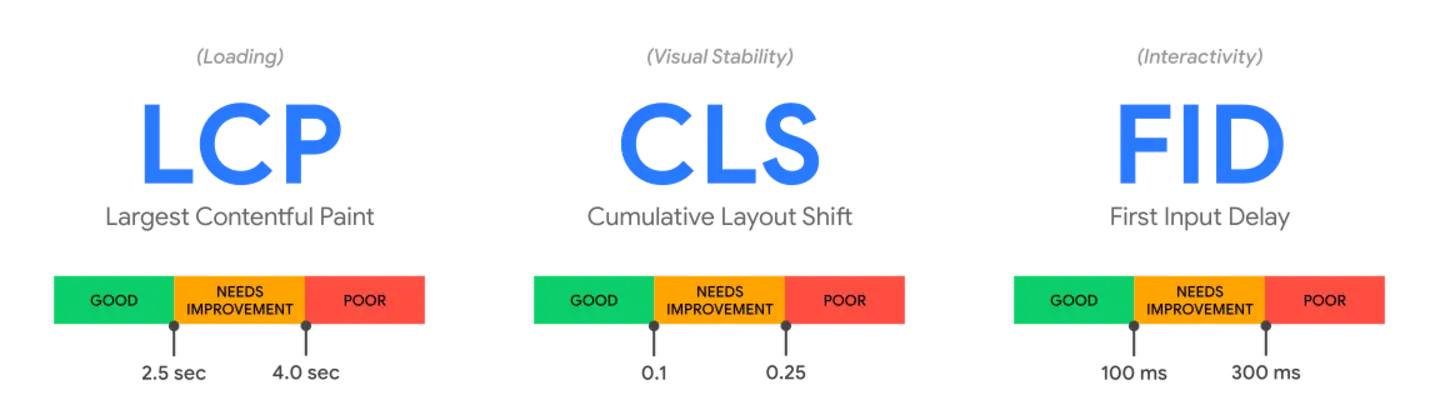
- Largest Contentful Paint (LCP): Measures loading performance. To provide a good user experience, LCP should occur within 2.5 seconds of when the page first begins to load.
- First Input Delay (FID): Measures interactivity. To provide a good user experience, pages should have a FID of 100 milliseconds or less.
- Cumulative Layout Shift (CLS): Measures visual stability. To provide a good user experience, pages should maintain a CLS of 0.1 or less.
To ensure you can achieve the recommended target values during most of your users' visits, a good measurement threshold for each of the above metrics is the 75th percentile of page loads, and this threshold applies to both mobile and desktop devices.
If a page meets the 75th percentile of all three metrics' recommended target values, tools that assess Core Web Vitals compliance should evaluate the page as passing.
Page Performance Monitoring
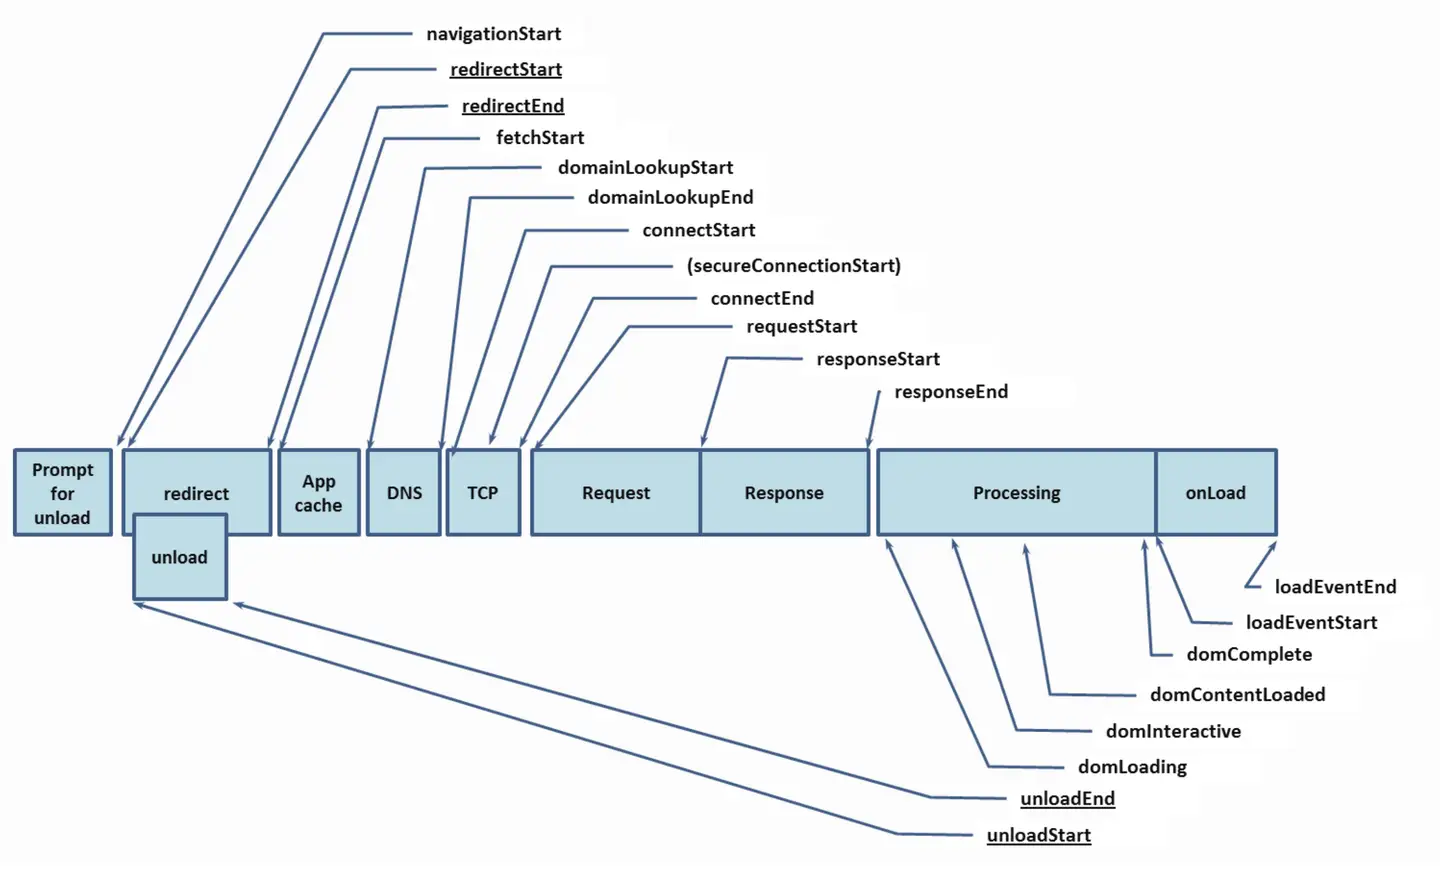
| Indicator | Description | Calculation Formula |
|---|---|---|
| TTFB | Time To First Byte, that is, the time taken for the first byte of the network request, from sending the page request to receiving the first byte of the response data | responseStart - fetchStart |
| FCP | First Contentful Paint, that is, the first time there is content rendering. In the performance statistics, the time from the time when the user starts to visit the Web page to the time point of FCP can be regarded as the time without content, that is, in the process of accessing the Web page, before the time point of FCP, the user sees a screen without any actual content, and the user can not obtain any useful information at this stage | fp - fetchStart where fp gives priority to using the browser PerformanceObserver to listen to the 'first content paint' event |
| LCP | Largest Contentful Paint, that is, the maximum content painting time, is the Core Web Vitals metric used to measure when the largest content element in the viewport is visible. It can be used to determine when the main content of the page will be rendered on the screen | fs - fetchStart where fs takes priority to use the last LCP time before the full load event is triggered, and LCP uses the browser PerformanceObserver to listen to the 'largest content paint' event |
| CLS | Cumulative Layout Shift, that is, cumulative layout offset, is a measure of the maximum layout change score for every unexpected layout change that occurs in the entire life cycle of a page | Use the browser PerformanceObserver to listen to the 'layout shift' event |
| FID | First Input Delay, that is, the first input delay, measures the delay time of the user's first interaction with the page. It is the time from the user's first interaction with the page to the time when the browser can really start processing the event handler to respond to the interaction | Use the browser PerformanceObserver to listen to the 'first input' event |
| TTI | Time to Interactive, that is, the fully interactive time, is a non-standard Web performance "progress" indicator, defined as the time point when the last "long task" completed, followed by 5 seconds of inactivity of the network and the main thread. | - |
| TBT | Total Blocking Time, that is, the total blocking time. It is a measure of the total time between FCP and TTI. During this period, the main thread is blocked for too long to make input responses | Total time of all long tasks from FCP to TTI exceeding 50ms |
| LoadEventEnd | End of loading event | loadEventEnd - fetchStart where loadEventEnd uses performance.timing.loadEventEnd |
| Fully loaded | After the loadEventEnd is completed, the time until the response to the Ajax requests and static resource requests initiated within a period of time (500ms by default) can be regarded as the time taken for the page to fully load. | - |
| DCL | DOMContentLoaded, which measures the time when the browser is ready to execute any client script. DCL refers to the time when the browser has assembled the DOM (document object model) and no stylesheet prevents JavaScript from executing during the web page loading process | domContentLoaded - fetchStart |
| Redirect | If redirection does not occur, or one of the redirects is not from the same source, the value is 0 | redirectEnd - redirectStart |
| DNS | Time consuming for domain name resolution (0 when hit the resolution cache) | domainLookupEnd - domainLookupStart |
| TCP | TCP connection takes time | connectEnd - connectStart |
| SSL | The SSL secure connection takes time | secureConnectionStart = 0 ? 0: connectEnd - secureConnectionStart |
| Request | After the SSL connection is established, the first response from the client to the server takes time | responseStart - requestStart |
| Response | Time consuming from the first response of the server to the full response of the data | responseEnd - responseStart |
Page Analysis Metrics
| Metric | Description | Calculation Formula |
|---|---|---|
| Slow Page Count | Number of page visits exceeding the slow page threshold. | Page visits exceeding slow FCP threshold + exceeding slow LCP threshold + exceeding slow DCL threshold + exceeding slow Complete Load threshold |
| Slow Page Percentage | Proportion of page visits exceeding the slow page threshold to total visits. | (Page visits exceeding slow thresholds (slow FCP, slow LCP, slow DCL, slow Complete Load) / total visits) * 100% |
| Slow Page Affected User Count | UV experiencing slow pages | - |
Operation Analysis Metrics
| Metric | Description | Calculation Formula |
|---|---|---|
| Operation Count | Number of times the operation is requested. | When an operation is requested once, it is recorded as 1 time. |
| Operation Time | Time for the operation to complete. | For operations with Ajax requests, the end time of the last Ajax in the operation - the start time of the first Ajax. For page operations, the completion time of user-defined page metrics such as FCP/LCP/DCL/Complete Load is the operation time. |
| Operation Availability | Proportion of successful operations to total operations. | (Number of successful operations / Total number of operations) * 100% |
| Operation Request Time | The projection time of the requests corresponding to the operation. | - |
| Average Server Time | Time from the server receiving the request to completing the processing. | - |
User Analysis Metrics
| Metric | Description |
|---|---|
| PV | Page View, number of page visits. |
| UV | User View, number of user visits. |
| Session | Number of user session visits, counted as one session from entering the page to closing the page. |
JS Error Metrics
| Metric | Description |
|---|---|
| JS Error Count | Number of PVs where JS errors occurred |
| JS Error Rate | Number of PVs where JS errors occurred / Total PV |
| Affected User Count | Number of UVs experiencing JS errors |
Request Analysis Metrics
| Metric | Description |
|---|---|
| Response Time | Time from when the request is sent until the server returns and the result is received |
| Request Count | Number of requests accessing the application |
| Slow Request Percentage | Number of requests exceeding the slow request threshold / Total reported requests |
| Slow Request Affected User Count | UV experiencing slow requests |
| Error Rate | Number of requests with status code 400 and above / Number of requests |
| Error Affected User Count | Number of UVs experiencing request errors |