Log
Overview
The Log function supports rapid query of log data by time, keywords, log level, source, and other conditions, helping you efficiently locate anomalies and analyze root causes. The platform displays results based on log data collected through "Log Configuration".
Use Cases
Through the log search function, you can view host process logs or Kubernetes logs to locate and analyze log issues.
Configuration Approach
- Determine which entities' logs need to be collected.
- Select and confirm the log collection scope.
- Configure multi-line merge parsing rules for logs.
- Search for relevant log data in Log Analytics.
Configuration Guide
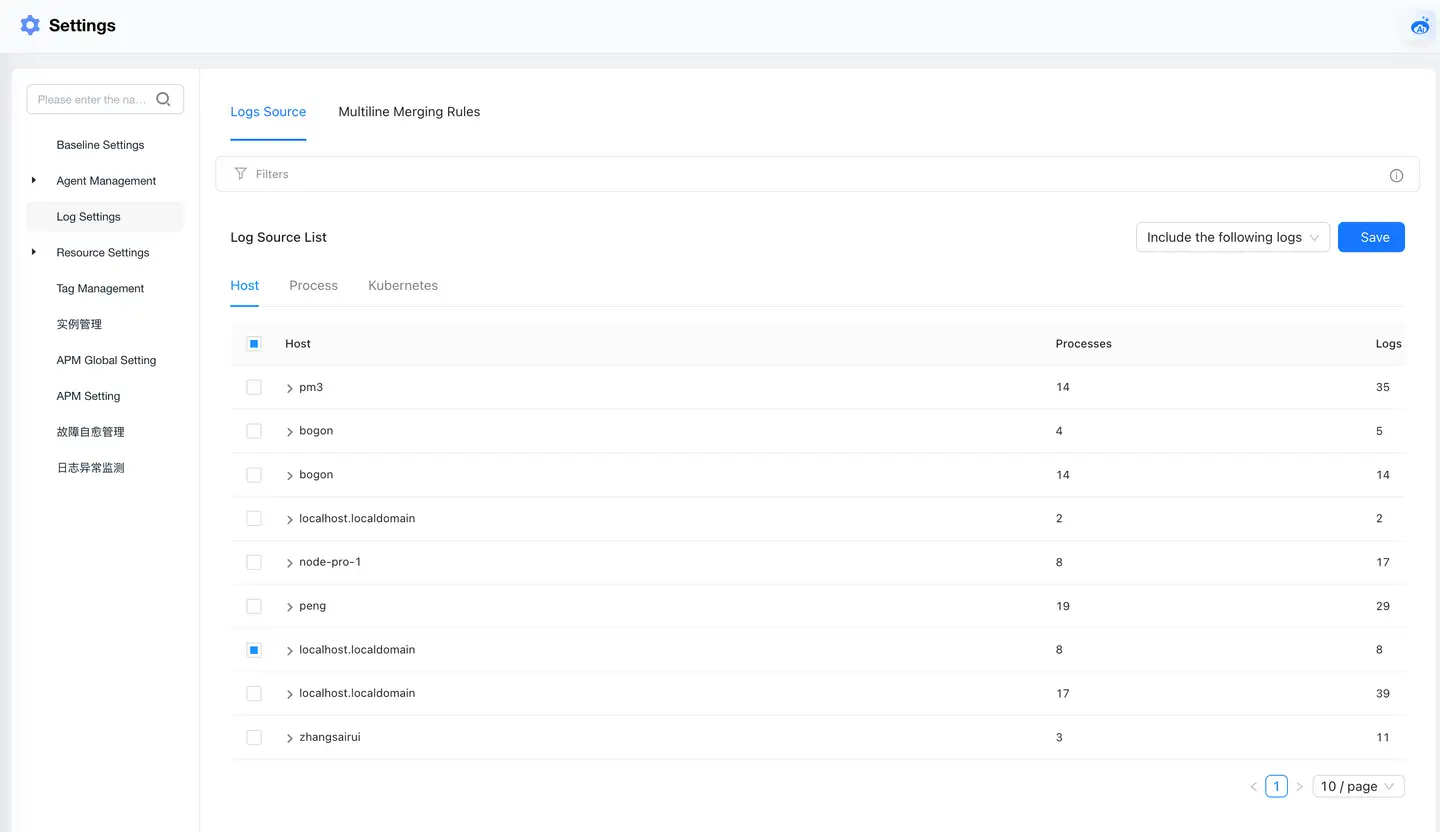
In the Lite App "Settings", follow the path "Settings > Log Settings" to enter the log settings page. The page is divided into two tabs: "Log Source" and "Multiline Merging Rules".
Log Source: The scope of logs that can be collected. Supports searching for logs from three perspectives: "Host", "Process", or "Kubernetes".
Multiline Merging Rules: Rules that specify how to merge multiple lines of logs into a single log entry for parsing in specific log files. When logs are collected and reported, the system first matches these rules before storing them.
| Tab Page | Item | Description |
|---|---|---|
| Log Source | Search Box | Filter and query by host IP address, process name, deployment environment, log path, and workload. |
| Host | Confirm log scope by "Host > Process > Log Name". | |
| Process | Confirm log scope by "Process > Log Name > Host" | |
| Kubernetes | Confirm log scope by "Cluster Name:workload". | |
| Multi-line Merge Rules | Add | Name: Log parsing rule name Description: Main description information of the parsing rule Rule: Regular expression for parsing logs File: Specified log file path address Sample Parse: Log example Test Result: Log content output after parsing rules |
Prerequisites
You need to install the Agent on specific hosts first to enable log collection capabilities.
Log Search
| Page Area | Item | Description |
|---|---|---|
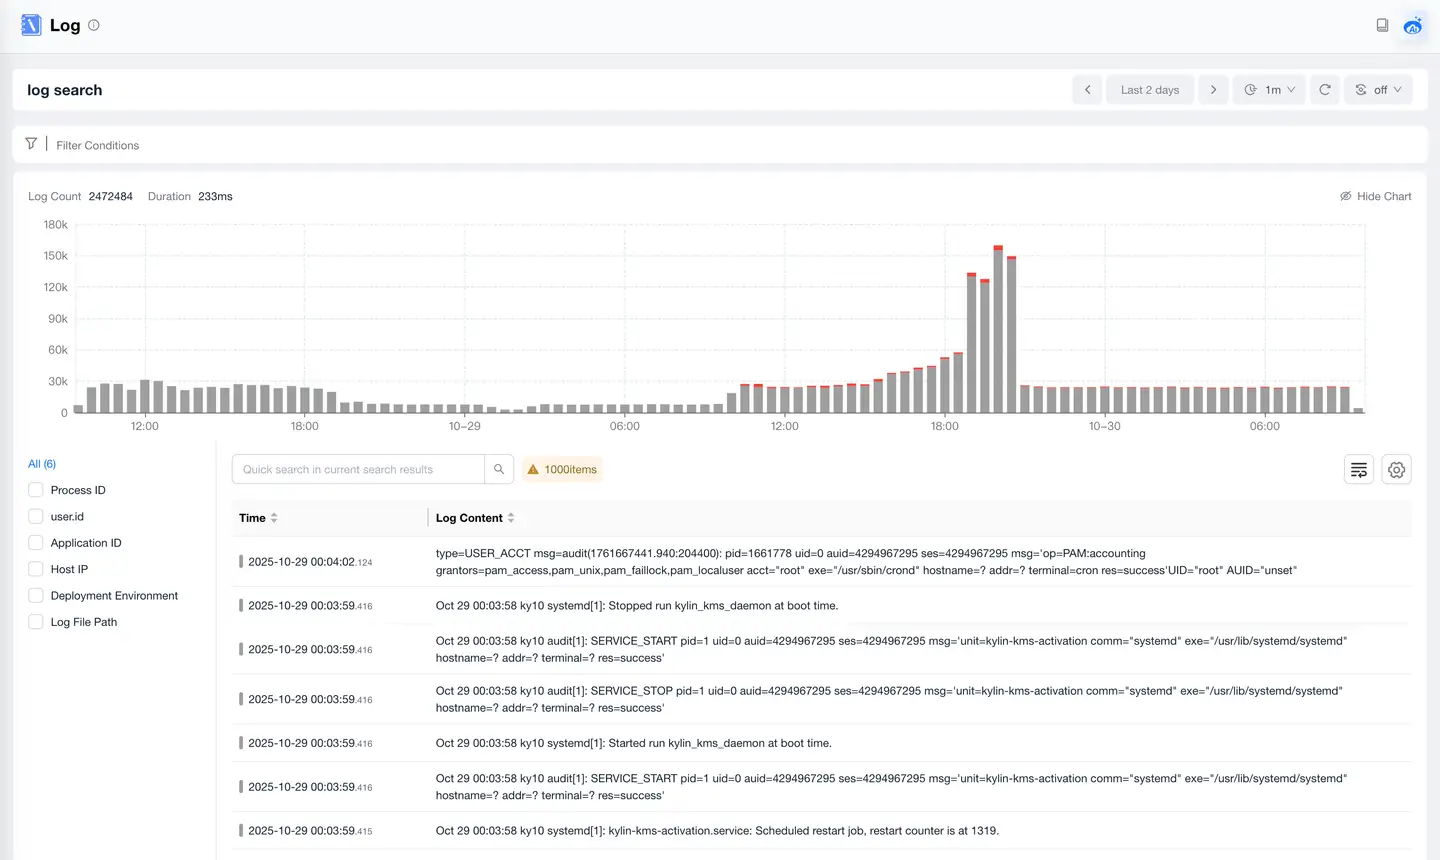
| Lower Left of Page | Index Fields | Common log dimensions on the platform. Query log data information by quickly selecting these index fields. |
| Upper Part of Page | Filter Conditions | Query conditions displayed come from dimension information of collected log data. You can filter log information you want to search through these dimensions. |
| Lower Right of Page | Log List Search Box | Provides secondary search capability through log keywords based on log results filtered by filter conditions. |
| Operation Area | There are two operation icons: Line Break and Settings. + Line Break: Click to automatically wrap log content and display all information. + Settings: You can set logs to display in 1, 3, or 5 lines. The system displays in 3 lines by default. | |
| List Row Click Event | Click a row to pop up a drawer panel on the right, displaying detailed log data. |