Integrating Huawei Cloud Data
Scope of Application
Huawei Cloud product namespaces that support metric data collection:
- Elastic Cloud Server:
- AGT.ECS
- SYS.ECS
- Relational Database Service
- SYS.RDS
- Distributed Message Service
- SYS.DMS
- Elastic Load Balance
- SYS.ELB
Minimum Collector version: 4.2.0.0, with the Guanyun Collector module enabled.
Necessary conditions for collecting elastic cloud server metrics
-
When purchasing an elastic cloud server, you need to enable Detailed monitoring.
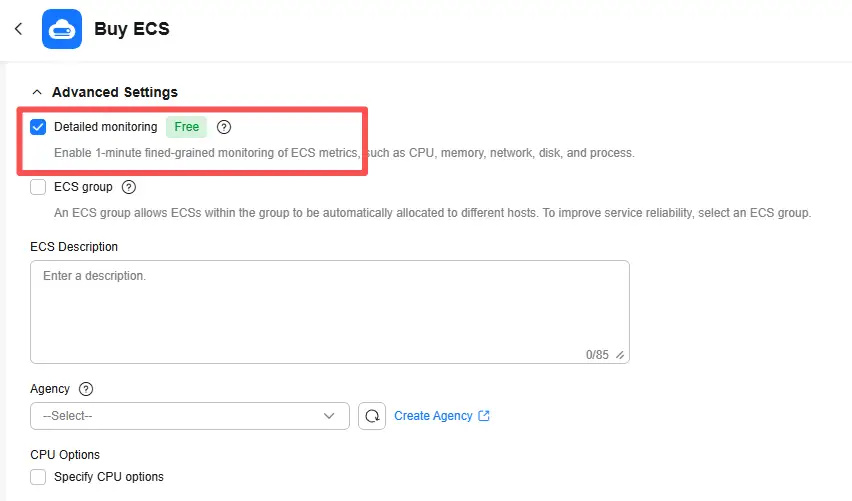
-
If the purchased Elastic Cloud Server does not have Detailed monitoring enabled, follow the steps in the following document to install the Agent.
Confirming the Server Where Collector Is Installed
Collector reads Huawei Cloud monitoring data through the Huawei Cloud SDK. Ensure that the network between Collector and the Huawei Cloud server is accessible.
Configuring Network and Port Rules
The following IP addresses and ports are examples. Update them based on your environment before applying the network rules.
| Source Address | Target Address | Target Port | Description |
|---|---|---|---|
| Collector Server | Guanyun Platform | 80 | Installing Collector and uploading data to Guanyun Platform |
| Collector Server | Huawei Cloud Server | 443 | Reading Huawei Cloud monitoring data using Huawei Cloud SDK |
Huawei Cloud server domain names are typically similar to the following (example data):
ecs.cn-north-4.myhuaweicloud.com
rds.cn-north-4.myhuaweicloud.com
dms.cn-north-4.myhuaweicloud.com
elb.cn-north-4.myhuaweicloud.com
Installing Collector
-
Log in to Guanyun Platform, and in the left navigation menu select All Applications > Deployment Status > Collectors Operation.
-
Click Create in the upper-right corner and configure the Collector parameters.
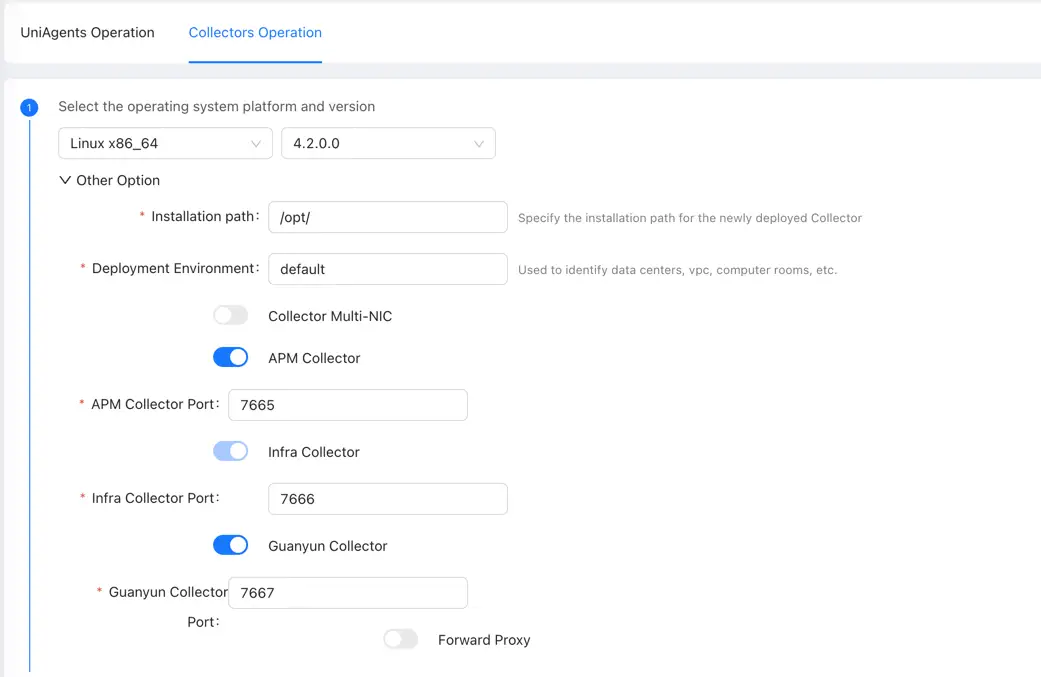
You need to enable the Guanyun Collector function to ingest monitoring data from Zabbix, Prometheus, OpenTelemetry, and external data sources.
Install Collector.
Obtaining Huawei Cloud Related Configuration
Logging in to Huawei Cloud
- Account Permission Requirements
- Authorization through user groups
- User group authorizations are as follows:
- Cloud Eye (Required): CES ReadOnlyAccess
- Elastic Cloud Server (Optional): ECS ReadOnlyAccess
- Relational Database Service (Optional): RDS ReadOnlyAccess
- Distributed Message Service (Optional): DMS ReadOnlyAccess
- Elastic Load Balance (Optional): ELB ReadOnlyAccess
- Obtaining Necessary Configuration
- AK, SK: Key pair used to query Huawei Cloud interfaces through API.
- Region ID: Region ID used to query cloud product information in different regions.
- Project ID: Find the corresponding project ID according to the region.
Obtaining AK and SK
As shown in the figure below, click "My Credentials > Access Keys" in the upper right corner of the console to enter the page.
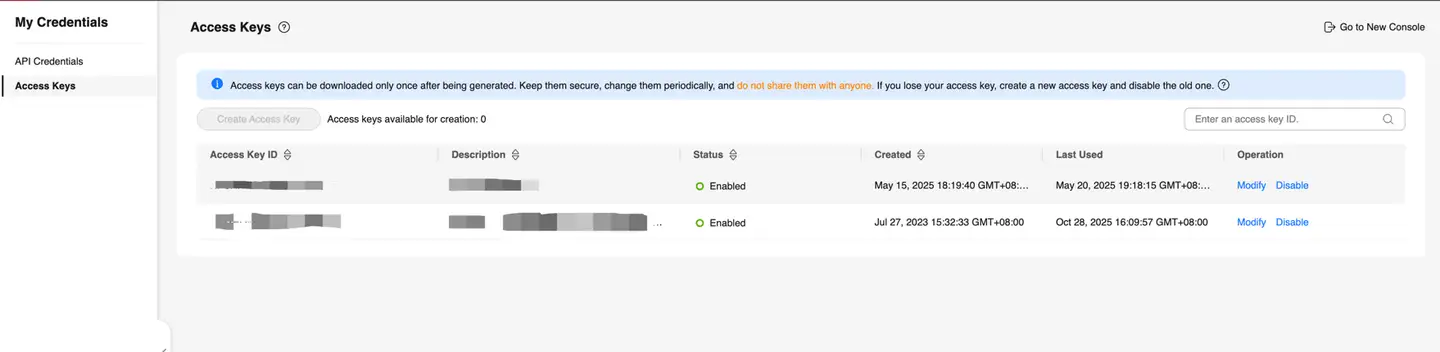
Add a key pair. After creation, an Excel file will be generated containing the access_key and secret_key. Note that the Excel file is only generated once and cannot be downloaded again later.
Obtaining Region ID
According to the region where the cloud product application type is located, obtain the corresponding region ID for that region. The figure below uses Elastic Cloud Server as an example.
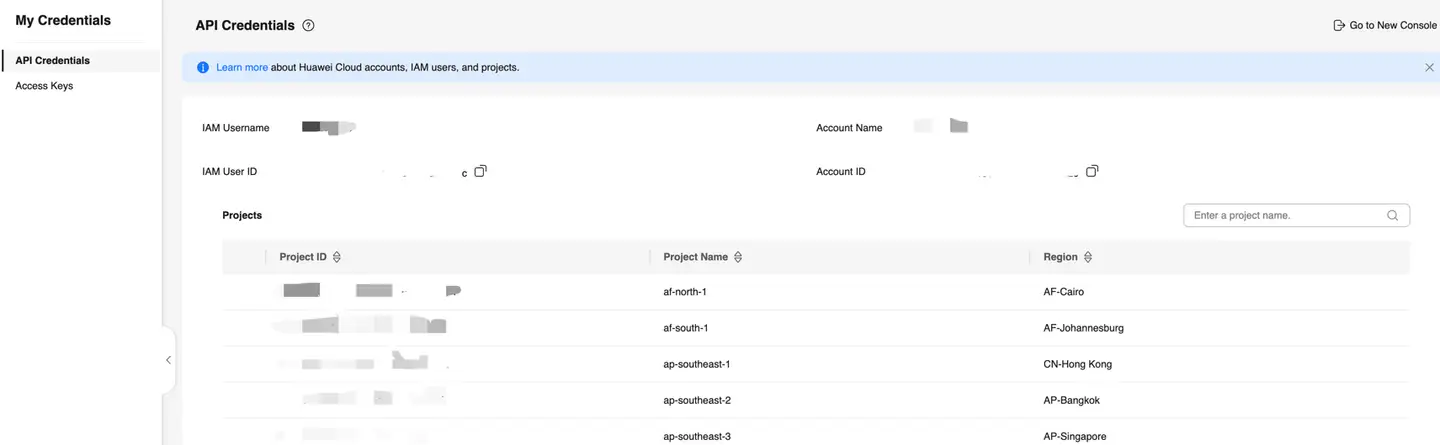
Obtaining Project ID
As shown in the figure below, click "My Credentials > API Credentials" in the upper right corner of the console to enter the page.
According to the region, find the corresponding project ID.
Configuring Collector to Receive Huawei Cloud Data
-
Enter Collector installation directory
cd /opt/tingyun-collector/ -
Enable Huawei Cloud module
cd conf.d/huaweicloud
sudo cp huaweicloud-processors.yaml.example huaweicloud-processors.yaml
sudo cp huaweicloud.yaml.example huaweicloud.yaml -
Modify data receiving configuration
sudo vim huaweicloud.yamlAdd the above configuration information to the configuration file. Where:
-
Required configuration:
- access_key;Supports plaintext or encrypted configuration
- secret_key;Supports plaintext or encrypted configuration
- region_id
- project_id
- namespaces: Add corresponding namespaces as needed
-
The encryption methods for access_key and secret_key are as follows::
  sudo /opt/tingyun-collector/bin/watchdog  -mode passgen -plaintext accesskey-example
  sudo /opt/tingyun-collector/bin/watchdog  -mode passgen -plaintext secretkey-example
receivers:
  guanyun_huaweicloudcesreceiver:
    collection_interval: 60s
    initial_delay: 5s
    region_id: region-example
    access_key: accesskey-example
    secret_key: secretkey-example
    project_id: "project-example"
    period: 1
    filter: average
    no_verify_ssl: True
    detail_interval: 5m
namespaces: [AGT.ECS,SYS.ECS,SYS.RDS,SYS.DMS,SYS.ELB] -
Restarting Collector
After modifying the configuration, you need to restart Collector.
sudo systemctl restart tingyun-collector
Validating Data
tail -f /opt/tingyun-collector/logs/guanyun/collector.log
Viewing Data in Guanyun Platform
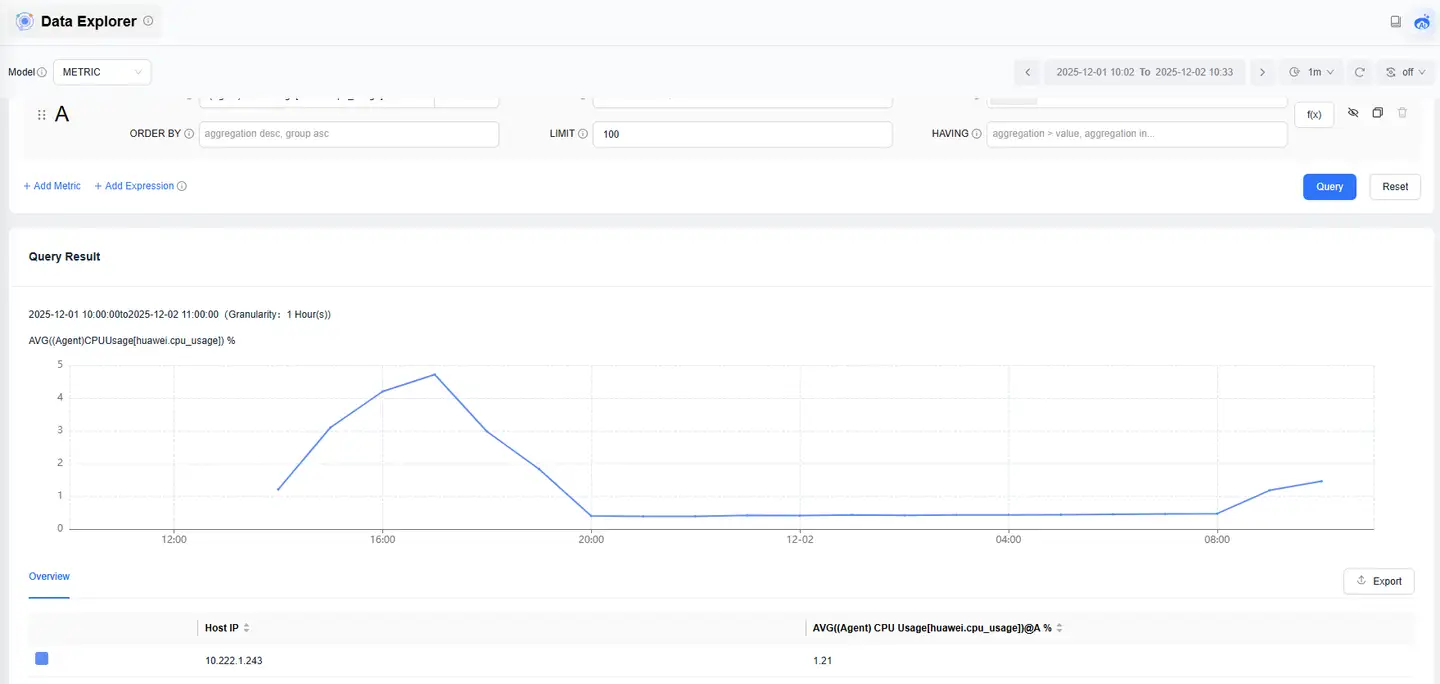
For example, when integrating Huawei Cloud Elastic Cloud Server, Go to the Data Explorer lite App, select METRIC as the data model, query any Huawei Cloud host metric, group by host IP, and confirm that the host IP of the integrated Huawei Cloud data appears in the list.
Supported metrics
| Metric Category | Subcategory | Metric Name | Metric Key | Metric Description |
|---|---|---|---|---|
| ECS | CPU | (Agent) CPU Usage | huawei.cpu_usage | This metric is used to count the current CPU usage rate of the measured object. Collection method (Linux): Calculated by changes in /proc/stat during the collection period. Users can view the %Cpu(s) value via the top command. Collection method (Windows): Obtained via Windows API GetSystemTimes. |
| ECS | CPU | (Agent) CPU Idle Time Ratio | huawei.cpu_usage_idle | This metric is used to count the current CPU idle time ratio of the measured object. Collection method (Linux): Calculated by changes in /proc/stat during the collection period. Collection method (Windows): Obtained via Windows API GetSystemTimes. |
| ECS | CPU | (Agent) User Space CPU Usage | huawei.cpu_usage_user | This metric is used to count the current user space CPU usage rate of the measured object. Collection method (Linux): Calculated by changes in /proc/stat during the collection period. Users can view the %Cpu(s) us value via the top command. Collection method (Windows): Obtained via Windows API GetSystemTimes. |
| ECS | CPU | (Agent) Kernel Space CPU Usage | huawei.cpu_usage_system | This metric is used to count the current kernel space CPU usage rate of the measured object. Collection method (Linux): Calculated by changes in /proc/stat during the collection period. Users can view the %Cpu(s) sy value via the top command. Collection method (Windows): Obtained via Windows API GetSystemTimes. |
| ECS | CPU | (Agent) Other CPU Usage | huawei.cpu_usage_other | This metric is used to count other CPU usage of the measured object. Collection method (Linux): Other CPU Usage = 1 - Idle CPU Usage (%) - Kernel Space CPU Usage - User Space CPU Usage. Collection method (Windows): Other CPU Usage = 1 - Idle CPU Usage (%) - Kernel Space CPU Usage - User Space CPU Usage. |
| ECS | CPU | (Agent) Nice Process CPU Usage | huawei.cpu_usage_nice | This metric is used to count the current Nice process CPU usage rate of the measured object. Collection method (Linux): Calculated by changes in /proc/stat during the collection period. Users can view the %Cpu(s) ni value via the top command. Collection method (Windows): Not supported. |
| ECS | CPU | (Agent) iowait State Ratio | huawei.cpu_usage_iowait | This metric is used to count the current ratio of CPU time spent in iowait state for the measured object. Collection method (Linux): Calculated by changes in /proc/stat during the collection period. Users can view the %Cpu(s) wa value via the top command. Collection method (Windows): Not supported. |
| ECS | CPU | (Agent) CPU Interrupt Time Ratio | huawei.cpu_usage_irq | This metric is used to count the current ratio of CPU time spent processing interrupts for the measured object. Collection method (Linux): Calculated by changes in /proc/stat during the collection period. Users can view the %Cpu(s) hi value via the top command. Collection method (Windows): Not supported. |
| ECS | CPU | (Agent) CPU Soft Interrupt Time Ratio | huawei.cpu_usage_softirq | This metric is used to count the current ratio of CPU time spent processing soft interrupts for the measured object. Collection method (Linux): Calculated by changes in /proc/stat during the collection period. Users can view the %Cpu(s) si value via the top command. Collection method (Windows): Not supported. |
| ECS | CPU Load | (Agent) 1-minute Load Average | huawei.load_average1 | This metric is used to count the CPU load average over the past 1 minute for the measured object. Collection method (Linux): Obtained from load1/logical CPU count in /proc/loadavg. Users can view the load1 value via the top command. |
| ECS | CPU Load | (Agent) 5-minute Load Average | huawei.load_average5 | This metric is used to count the CPU load average over the past 5 minutes for the measured object. Collection method (Linux): Obtained from load5/logical CPU count in /proc/loadavg. Users can view the load5 value via the top command. |
| ECS | CPU Load | (Agent) 15-minute Load Average | huawei.load_average15 | This metric is used to count the CPU load average over the past 15 minutes for the measured object. Collection method (Linux): Obtained from load15/logical CPU count in /proc/loadavg. Users can view the load15 value via the top command. |
| ECS | Memory | (Agent) Available Memory | huawei.mem_available | This metric is used to count the available memory of the measured object. |
| ECS | Memory | (Agent) Memory Usage | huawei.mem_used_percent | This metric is used to count the memory usage rate of the measured object. |
| ECS | Memory | (Agent) Free Memory | huawei.mem_free | This metric is used to count the free memory amount of the measured object. |
| ECS | Memory | (Agent) Buffers Usage | huawei.mem_buffers | This metric is used to count the Buffers memory amount of the measured object. |
| ECS | Memory | (Agent) Cache Usage | huawei.mem_cached | This metric is used to count the Cache memory amount of the measured object. |
| ECS | Memory | (Agent) Total File Handles | huawei.total_open_files | This metric is used to count the total number of handles used by all processes of the measured object. |
| ECS | Disk | (Agent) Disk Free Storage | huawei.disk_free | This metric is used to count the remaining storage space of the disk of the measured object. |
| ECS | Disk | (Agent) Total Disk Storage | huawei.disk_total | This metric is used to count the total disk storage of the measured object. |
| ECS | Disk | (Agent) Disk Used Storage | huawei.disk_used | This metric is used to count the used storage space of the disk of the measured object. |
| ECS | Disk | (Agent) Disk Usage | huawei.disk_used_percent | This metric is used to count the disk usage rate of the measured object, in percentage. Calculation method: Disk Used Storage / Total Disk Storage. |
| ECS | Disk I/O | (Agent) Disk Read Rate | huawei.disk_agt_read_bytes_rate | This metric is used to count the amount of data read from the measured object per second. |
| ECS | Disk I/O | (Agent) Disk Read Operation Rate | huawei.disk_agt_read_requests_rate | This metric is used to count the number of read requests from the measured object per second. |
| ECS | Disk I/O | (Agent) Disk Write Rate | huawei.disk_agt_write_bytes_rate | This metric is used to count the amount of data written to the measured object per second. |
| ECS | Disk I/O | (Agent) Disk Write Operation Rate | huawei.disk_agt_write_requests_rate | This metric is used to count the number of write requests to the measured object per second. |
| ECS | Disk I/O | (Agent) Average Read Operation Time | huawei.disk_read_time | This metric is used to count the average read operation time of the disk of the measured object. |
| ECS | Disk I/O | (Agent) Average Write Operation Time | huawei.disk_write_time | This metric is used to count the average write operation time of the disk of the measured object. |
| ECS | Disk I/O | (Agent) Disk I/O Utilization | huawei.disk_io_utils | This metric is used to count the disk I/O utilization of the measured object. |
| ECS | Disk I/O | (Agent) Average Queue Length | huawei.disk_queue_length | This metric reflects the disk busyness over a specified period, which can be used to evaluate disk I/O performance. A higher value indicates a busier disk and worse I/O performance. |
| ECS | Disk I/O | (Agent) Average Write Operation Size | huawei.disk_write_bytes_per_operation | This metric is used to count the average number of bytes transferred per write I/O operation over a specified period. |
| ECS | Disk I/O | (Agent) Average Read Operation Size | huawei.disk_read_bytes_per_operation | This metric is used to count the average number of bytes transferred per read I/O operation over a specified period. |
| ECS | Disk I/O | (Agent) Average I/O Service Time | huawei.disk_io_svctm | This metric is used to count the average operation time per read or write I/O over a specified period. |
| ECS | Disk I/O | Block Device Usage | huawei.disk_device_used_percent | This metric is used to count the physical disk usage rate of the measured object, in percentage. Calculation method: Used Storage of All Mounted Disk Partitions / Total Disk Storage. |
| ECS | File System | (Agent) File System Read/Write Status | huawei.disk_fs_rwstate | This metric is used to count the read/write status of the mounted file system of the measured object. Statuses: Read/Write (0) / Read-Only (1). |
| ECS | File System | (Agent) inode Space Size | huawei.disk_inodes_total | This metric is used to count the current inode space amount of the disk of the measured object. |
| ECS | File System | (Agent) inode Used Space | huawei.disk_inodes_used | This metric is used to count the current used inode space amount of the disk of the measured object. |
| ECS | File System | (Agent) inode Used Ratio | huawei.disk_inodes_used_percent | This metric is used to count the current used inode ratio of the disk of the measured object. |
| ECS | Network Card | (Agent) Outbound Network Bandwidth | huawei.net_bit_recv | This metric is used to count the number of bits sent by the network card of the measured object per second. |
| ECS | Network Card | (Agent) Inbound Network Bandwidth | huawei.net_bit_sent | This metric is used to count the number of bits received by the network card of the measured object per second. |
| ECS | Network Card | (Agent) Network Packet Receive Rate | huawei.net_packet_recv | This metric is used to count the number of data packets received by the network card of the measured object per second. |
| ECS | Network Card | (Agent) Network Packet Send Rate | huawei.net_packet_sent | This metric is used to count the number of data packets sent by the network card of the measured object per second. |
| ECS | Network Card | (Agent) Receive Error Packet Rate | huawei.net_errin | This metric is used to count the ratio of erroneous data packets received per second by the network card of the measured object to the total received packets. |
| ECS | Network Card | (Agent) Send Error Packet Rate | huawei.net_errout | This metric is used to count the ratio of erroneous data packets sent per second by the network card of the measured object to the total sent packets. |
| ECS | Network Card | (Agent) Receive Drop Packet Rate | huawei.net_dropin | This metric is used to count the ratio of data packets received and dropped per second by the network card of the measured object to the total received packets. |
| ECS | Network Card | (Agent) Send Drop Packet Rate | huawei.net_dropout | This metric is used to count the ratio of data packets sent and dropped per second by the network card of the measured object to the total sent packets. |
| ECS | NTP | (Agent) NTP Offset | huawei.ntp_offset | This metric is used to count the current NTP offset of the measured object. |
| ECS | TCP | (Agent) TCP TOTAL | huawei.net_tcp_total | This metric is used to count the total number of TCP connections in all states for the measured object. |
| ECS | TCP | (Agent) TCP ESTABLISHED | huawei.net_tcp_established | This metric is used to count the number of TCP connections in ESTABLISHED state for the measured object. |
| ECS | TCP | (Agent) TCP SYS_SENT | huawei.net_tcp_sys_sent | This metric is used to count the number of TCP connections in connection request state for the measured object. |
| ECS | TCP | (Agent) TCP SYS_RECV | huawei.net_tcp_sys_recv | This metric is used to count the number of TCP connection requests received by the server side for the measured object. |
| ECS | TCP | (Agent) TCP FIN_WAIT1 | huawei.net_tcp_fin_wait1 | This metric is used to count the number of TCP connections where the client actively closed and did not receive an ACK from the server for the measured object. |
| ECS | TCP | (Agent) TCP FIN_WAIT2 | huawei.net_tcp_fin_wait2 | This metric is used to count the number of TCP connections in FIN_WAIT2 state for the measured object. |
| ECS | TCP | (Agent) TCP TIME_WAIT | huawei.net_tcp_time_wait | This metric is used to count the number of TCP connections in TIME_WAIT state for the measured object. |
| ECS | TCP | (Agent) TCP CLOSE | huawei.net_tcp_close | This metric is used to count the number of closed or unopened TCP connections for the measured object. |
| ECS | TCP | (Agent) TCP CLOSE_WAIT | huawei.net_tcp_close_wait | This metric is used to count the number of TCP connections in CLOSE_WAIT state for the measured object. |
| ECS | TCP | (Agent) TCP LAST_ACK | huawei.net_tcp_last_ack | This metric is used to count the number of TCP connections waiting for ACK packets after passive closure for the measured object. |
| ECS | TCP | (Agent) TCP LISTEN | huawei.net_tcp_listen | This metric is used to count the number of TCP connections in LISTEN state for the measured object. |
| ECS | TCP | (Agent) TCP CLOSING | huawei.net_tcp_closing | This metric is used to count the number of TCP connections where both server and client are actively closing simultaneously for the measured object. |
| ECS | TCP | (Agent) TCP Retransmission Rate | huawei.net_tcp_retrans | This metric is used to count the ratio of retransmitted packets to the total sent packets for the measured object. |
| ECS | GPU | GPU Health Status | huawei.gpu_status | This metric is used to count the GPU health status on the virtual machine, which is a comprehensive indicator. 0: Healthy 1: Subhealthy 2: Faulty |
| ECS | GPU | Encoder Utilization | huawei.gpu_usage_encoder | This metric is used to count the encoder capability utilization rate of the GPU. |
| ECS | GPU | Decoder Utilization | huawei.gpu_usage_decoder | This metric is used to count the decoder capability utilization rate of the GPU. |
| ECS | GPU | Correctable ECC Error Count | huawei.gpu_volatile_correctable | This metric is used to count the number of correctable ECC errors since the last GPU reset, reset to 0 after each reset. |
| ECS | GPU | Uncorrectable ECC Error Count | huawei.gpu_volatile_uncorrectable | This metric is used to count the number of uncorrectable ECC errors since the last GPU reset, reset to 0 after each reset. |
| ECS | GPU | Cumulative Correctable ECC Error Count | huawei.gpu_aggregate_correctable | This metric is used to count the cumulative number of correctable ECC errors for the GPU. |
| ECS | GPU | Cumulative Uncorrectable ECC Error Count | huawei.gpu_aggregate_uncorrectable | This metric is used to count the cumulative number of uncorrectable ECC errors for the GPU. |
| ECS | GPU | Retired Page Single Bit Error Count | huawei.gpu_retired_page_single_bit | This metric is used to count the current number of single-bit pages isolated by the GPU card. |
| ECS | GPU | Retired Page Double Bit Error Count | huawei.gpu_retired_page_double_bit | This metric is used to count the current number of double-bit pages isolated by the GPU card. |
| ECS | GPU | (Agent) Video Memory Usage | huawei.gpu_usage_mem | This metric is used to count the current video memory usage rate of the measured object. |
| ECS | GPU | (Agent) GPU Usage | huawei.gpu_usage_gpu | This metric is used to count the current GPU usage rate of the measured object. |
| ECS | GPU | GPU Free Video Memory | huawei.gpu_free_mem | This metric is used to count the current GPU free video memory amount of the measured object. |
| ECS | GPU | GPU Graphics Clock Frequency | huawei.gpu_graphics_clocks | This metric is used to count the current GPU graphics (shader) clock frequency of the measured object. |
| ECS | GPU | GPU Memory Clock Frequency | huawei.gpu_mem_clocks | This metric is used to count the current GPU memory clock frequency of the measured object. |
| ECS | GPU | GPU Power | huawei.gpu_power_draw | This metric is used to count the current GPU power of the measured object. |
| ECS | GPU | GPU PCI Inbound Bandwidth | huawei.gpu_rx_throughput_pci | This metric is used to count the current GPU PCI inbound bandwidth of the measured object. |
| ECS | GPU | GPU Streaming Multiprocessor Clock Frequency | huawei.gpu_sm_clocks | This metric is used to count the current GPU streaming multiprocessor clock frequency of the measured object. |
| ECS | GPU | GPU Temperature | huawei.gpu_temperature | This metric is used to count the current GPU temperature of the measured object. |
| ECS | GPU | GPU PCI Outbound Bandwidth | huawei.gpu_tx_throughput_pci | This metric is used to count the current GPU PCI outbound bandwidth of the measured object. |
| ECS | GPU | GPU Video Memory Usage | huawei.gpu_used_mem | This metric is used to count the current GPU video memory usage of the measured object. |
| ECS | GPU | GPU Video Clock Frequency | huawei.gpu_video_clocks | This metric is used to count the current GPU video (including encoding/decoding) clock frequency of the measured object. |
| ECS | NPU | NPU Health Status | huawei.npu_device_health | This metric is used to count the NPU card health status on the virtual machine, which is a comprehensive indicator. 0: Healthy 1: General Alarm 2: Important Alarm 3: Critical Alarm |
| ECS | NPU | NPU Video Memory Usage | huawei.npu_util_rate_mem | This metric is used to count the video memory usage rate of the NPU. |
| ECS | NPU | NPU Card AI Core Usage | huawei.npu_util_rate_ai_core | This metric is used to count the AI core usage rate of the NPU. |
| ECS | NPU | NPU Card AI CPU Usage | huawei.npu_util_rate_ai_cpu | This metric is used to count the AI CPU usage rate of the NPU. |
| ECS | NPU | NPU Control CPU Usage | huawei.npu_util_rate_ctrl_cpu | This metric is used to count the control CPU usage rate of the NPU. |
| ECS | NPU | NPU Video Memory Bandwidth Usage | huawei.npu_util_rate_mem_bandwidth | This metric is used to count the video memory bandwidth usage rate of the NPU. |
| ECS | NPU | NPU Video Memory Frequency | huawei.npu_freq_mem | This metric is used to count the clock frequency of the NPU video memory. |
| ECS | NPU | NPU Card AI Core Frequency | huawei.npu_freq_ai_core | This metric is used to count the clock frequency of the NPU AI core. |
| ECS | NPU | NPU Video Memory Usage | huawei.npu_usage_mem | This metric is used to count the video memory usage of the NPU. |
| ECS | NPU | NPU Single-bit Error Count | huawei.npu_sbe | This metric is used to count the current number of single-bit page errors for the NPU card. |
| ECS | NPU | NPU Double-bit Error Count | huawei.npu_dbe | This metric is used to count the current number of multi-bit page errors for the NPU card. |
| ECS | NPU | NPU Power | huawei.npu_power | This metric is used to count the power of the NPU card. Note: The 310 card only displays the rated power, while other cards display the actual power. |
| ECS | NPU | NPU Temperature | huawei.npu_temperature | This metric is used to count the current temperature of the NPU card. |
| ECS | DAVP | DAVP Health Status | huawei.davp_device_health | This metric is used to count the DAVP card health status on the virtual machine, which is a comprehensive indicator. 0: Healthy 1: Abnormal |
| ECS | DAVP | DAVP Video Memory Usage | huawei.davp_util_rate_mem | This metric is used to count the video memory usage rate of the DAVP card. |
| ECS | DAVP | DAVP Video Memory Usage | huawei.davp_usage_mem | This metric is used to count the video memory usage of the DAVP card. |
| ECS | DAVP | DAVP Card AI Core Usage | huawei.davp_util_rate_ai_core | This metric is used to count the AI core usage rate of the DAVP card. |
| ECS | DAVP | DAVP Card vDSP Core Usage | huawei.davp_util_rate_vdsp_core | This metric is used to count the vDSP core usage rate of the DAVP card. |
| ECS | DAVP | DAVP Card Encoding Core Usage | huawei.davp_util_rate_enc_core | This metric is used to count the encoding core usage rate of the DAVP card. |
| ECS | DAVP | DAVP Card Decoding Core Usage | huawei.davp_util_rate_dec_core | This metric is used to count the decoding core usage rate of the DAVP card. |
| ECS | DAVP | DAVP Card System Module Temperature | huawei.davp_sysc_temperature | This metric is used to count the system module temperature of the DAVP card. |
| RDS for Relational Databases | Common Metrics | CPU Usage | huawei.rds001_cpu_util | This metric is used to count the CPU usage rate of the measured object, in percentage. |
| RDS for Relational Databases | Common Metrics | Memory Usage | huawei.rds002_mem_util | This metric is used to count the memory usage rate of the measured object, in percentage. |
| RDS for Relational Databases | Common Metrics | IOPS | huawei.rds003_iops | This metric is used to count the number of I/O requests processed by the system per unit time for the current instance (average value). |
| RDS for Relational Databases | Common Metrics | Network Input Throughput | huawei.rds004_bytes_in | This metric is used to count the average input traffic per second from all network adapters of the measured object, in bytes/second. |
| RDS for Relational Databases | Common Metrics | Network Output Throughput | huawei.rds005_bytes_out | This metric is used to count the average output traffic per second from all network adapters of the measured object, in bytes/second. |
| RDS for Relational Databases | Common Metrics | Total Disk Size | huawei.rds047_disk_total_size | This metric is used to count the total disk size of the measured object. |
| RDS for Relational Databases | Common Metrics | Disk Usage | huawei.rds048_disk_used_size | This metric is used to count the disk usage size of the measured object. |
| RDS for Relational Databases | Common Metrics | Disk Read Throughput | huawei.rds049_disk_read_throughput | This metric is used to count the number of bytes read from the disk per second. |
| RDS for Relational Databases | Common Metrics | Disk Write Throughput | huawei.rds050_disk_write_throughput | This metric is used to count the number of bytes written to the disk per second. |
| RDS for Relational Databases | Common Metrics | Disk Utilization | huawei.rds039_disk_util | This metric is used to count the disk utilization rate of the measured object, in percentage. |
| RDS for Relational Databases | MYSQL/MariaDB | Total Database Connections | huawei.rds006_conn_count | This metric is used to count the total number of connections attempting to connect to the MySQL server, in units. |
| RDS for Relational Databases | MYSQL/MariaDB | Current Active Connections | huawei.rds007_conn_active_count | This metric is used to count connections in non-sleep state, in units. |
| RDS for Relational Databases | MYSQL/MariaDB | QPS | huawei.rds008_qps | This metric is used to count the number of SQL query statements, including stored procedures, in times/second. |
| RDS for Relational Databases | MYSQL/MariaDB | TPS | huawei.rds009_tps | This metric is used to count the number of transaction executions, including commits and rollbacks, in times/second. |
| RDS for Relational Databases | MYSQL/MariaDB | Buffer Pool Utilization | huawei.rds010_innodb_buf_usage | This metric is used to count the ratio of free pages to the total buffer pool pages in the InnoDB cache, in ratio. |
| RDS for Relational Databases | MYSQL/MariaDB | Buffer Pool Hit Rate | huawei.rds011_innodb_buf_hit | This metric is used to count the ratio of read hits to read requests, in ratio. |
| RDS for Relational Databases | MYSQL/MariaDB | Buffer Pool Dirty Block Rate | huawei.rds012_innodb_buf_dirty | This metric is used to count the ratio of dirty data in the InnoDB cache to the pages used in the InnoDB cache, in ratio. |
| RDS for Relational Databases | MYSQL/MariaDB | InnoDB Read Throughput | huawei.rds013_innodb_reads | This metric is used to count the average bytes read per second by InnoDB, in bytes/second. |
| RDS for Relational Databases | MYSQL/MariaDB | InnoDB Write Throughput | huawei.rds014_innodb_writes | This metric is used to count the average bytes written per second by InnoDB, in bytes/second. |
| RDS for Relational Databases | MYSQL/MariaDB | InnoDB File Read Frequency | huawei.rds015_innodb_read_count | This metric is used to count the average number of reads from files per second by InnoDB, in times/second. |
| RDS for Relational Databases | MYSQL/MariaDB | InnoDB File Write Frequency | huawei.rds016_innodb_write_count | This metric is used to count the average number of writes to files per second by InnoDB, in times/second. |
| RDS for Relational Databases | MYSQL/MariaDB | InnoDB Log Write Request Frequency | huawei.rds017_innodb_log_write_req_count | This metric is used to count the average number of log write requests per second, in times/second. |
| RDS for Relational Databases | MYSQL/MariaDB | InnoDB Log Physical Write Frequency | huawei.rds018_innodb_log_write_count | This metric is used to count the average number of physical writes to log files per second, in times/second. |
| RDS for Relational Databases | MYSQL/MariaDB | InnoDB Log fsync() Write Frequency | huawei.rds019_innodb_log_fsync_count | This metric is used to count the average number of fsync() writes completed to log files per second, in times/second. |
| RDS for Relational Databases | MYSQL/MariaDB | Temporary Table Creation Rate | huawei.rds020_temp_tbl_rate | This metric is used to count the number of temporary tables created on disk per second, in units/second. |
| RDS for Relational Databases | MYSQL/MariaDB | Key Buffer Utilization | huawei.rds021_myisam_buf_usage | This metric is used to count the MyISAM Key buffer utilization rate, in ratio. |
| RDS for Relational Databases | MYSQL/MariaDB | Key Buffer Write Hit Rate | huawei.rds022_myisam_buf_write_hit | This metric is used to count the MyISAM Key buffer write hit rate, in ratio. |
| RDS for Relational Databases | MYSQL/MariaDB | Key Buffer Read Hit Rate | huawei.rds023_myisam_buf_read_hit | This metric is used to count the MyISAM Key buffer read hit rate, in ratio. |
| RDS for Relational Databases | MYSQL/MariaDB | MyISAM Disk Write Frequency | huawei.rds024_myisam_disk_write_count | This metric is used to count the number of index writes to disk, in times/second. |
| RDS for Relational Databases | MYSQL/MariaDB | MyISAM Disk Read Frequency | huawei.rds025_myisam_disk_read_count | This metric is used to count the number of index reads from disk, in times/second. |
| RDS for Relational Databases | MYSQL/MariaDB | MyISAM Buffer Pool Write Frequency | huawei.rds026_myisam_buf_write_count | This metric is used to count the number of index write requests to the buffer pool, in times/second. |
| RDS for Relational Databases | MYSQL/MariaDB | MyISAM Buffer Pool Read Frequency | huawei.rds027_myisam_buf_read_count | This metric is used to count the number of index read requests from the buffer pool, in times/second. |
| RDS for Relational Databases | MYSQL/MariaDB | Delete Statement Execution Frequency | huawei.rds028_comdml_del_count | This metric is used to count the average number of Delete statement executions per second, in times/second. |
| RDS for Relational Databases | MYSQL/MariaDB | Insert Statement Execution Frequency | huawei.rds029_comdml_ins_count | This metric is used to count the average number of Insert statement executions per second, in times/second. |
| RDS for Relational Databases | MYSQL/MariaDB | Insert_Select Statement Execution Frequency | huawei.rds030_comdml_ins_sel_count | This metric is used to count the average number of Insert_Select statement executions per second, in times/second. |
| RDS for Relational Databases | MYSQL/MariaDB | Replace Statement Execution Frequency | huawei.rds031_comdml_rep_count | This metric is used to count the average number of Replace statement executions per second, in times/second. |
| RDS for Relational Databases | MYSQL/MariaDB | Replace_Selection Statement Execution Frequency | huawei.rds032_comdml_rep_sel_count | This metric is used to count the average number of Replace_Selection statement executions per second, in times/second. |
| RDS for Relational Databases | MYSQL/MariaDB | Select Statement Execution Frequency | huawei.rds033_comdml_sel_count | This metric is used to count the average number of Select statement executions per second. |
| RDS for Relational Databases | MYSQL/MariaDB | Update Statement Execution Frequency | huawei.rds034_comdml_upd_count | This metric is used to count the average number of Update statement executions per second, in times/second. |
| RDS for Relational Databases | MYSQL/MariaDB | Row Deletion Rate | huawei.rds035_innodb_del_row_count | This metric is used to count the average number of rows deleted from InnoDB tables per second, in rows/second. |
| RDS for Relational Databases | MYSQL/MariaDB | Row Insertion Rate | huawei.rds036_innodb_ins_row_count | This metric is used to count the average number of rows inserted into InnoDB tables per second, in rows/second. |
| RDS for Relational Databases | MYSQL/MariaDB | Row Read Rate | huawei.rds037_innodb_read_row_count | This metric is used to count the average number of rows read from InnoDB tables per second, in rows/second. |
| RDS for Relational Databases | MYSQL/MariaDB | Row Update Rate | huawei.rds038_innodb_upd_row_count | This metric is used to count the average number of rows updated in InnoDB tables per second, in rows/second. |
| RDS for Relational Databases | MYSQL/MariaDB | Connection Usage Rate | huawei.rds072_conn_usage | This metric is used to count the percentage of currently used MySQL connections to the total connections. |
| RDS for Relational Databases | MYSQL/MariaDB | Average Replication Delay | huawei.rds173_replication_delay_avg | This metric indicates the average delay between the standby or read-only instance and the primary instance, corresponding to seconds_behind_master. It is the average value over a 60-second period. |
| RDS for Relational Databases | MYSQL/MariaDB | Real-time Replication Delay | huawei.rds073_replication_delay | This metric indicates the real-time delay between the standby or read-only instance and the primary instance, corresponding to seconds_behind_master. This value is real-time. |
| RDS for Relational Databases | MYSQL/MariaDB | Slow Log Count Statistics | huawei.rds074_slow_queries | This metric is used to display the number of slow logs generated by MySQL per minute. |
| RDS for Relational Databases | MYSQL/MariaDB | Disk Read Time | huawei.rds075_avg_disk_ms_per_read | This metric is used to count the average time taken per disk read over a certain period. |
| RDS for Relational Databases | MYSQL/MariaDB | Disk Write Time | huawei.rds076_avg_disk_ms_per_write | This metric is used to count the average time taken per disk write over a certain period. |
| RDS for Relational Databases | MYSQL/MariaDB | VMA Count | huawei.rds077_vma | Monitors the virtual memory area size of the RDS process, in units. |
| RDS for Relational Databases | MYSQL/MariaDB | Thread Count in Process | huawei.rds078_threads | Monitors the number of threads in the RDS process, in units. |
| RDS for Relational Databases | MYSQL/MariaDB | Process Physical Memory Usage Peak | huawei.rds079_vm_hwm | Monitors the peak physical memory usage of the RDS process, in KB. |
| RDS for Relational Databases | MYSQL/MariaDB | Process Virtual Memory Usage Peak | huawei.rds080_vm_peak | Monitors the peak virtual memory usage of the RDS process, in KB. |
| RDS for Relational Databases | MYSQL/MariaDB | Disk I/O Non-idle Time Percentage | huawei.rds081_vm_ioutils | This parameter indicates the busyness of the disk device, representing the percentage of time with I/O (non-idle). Since disks can handle multiple I/O requests in parallel, even if this metric reaches 100%, it does not necessarily mean the device is saturated. |
| RDS for Relational Databases | MYSQL/MariaDB | Transaction Average Wait Time | huawei.rds082_semi_sync_tx_avg_wait_time | Monitors the average wait time in semi-synchronous replication mode, in microseconds. |
| RDS for Relational Databases | MYSQL/MariaDB | swap Utilization | huawei.sys_swap_usage | This metric is used to count the swap utilization rate of the measured object, in percentage. |
| RDS for Relational Databases | MYSQL/MariaDB | Transactions Waiting for Row Locks | huawei.rds_innodb_lock_waits | This metric is used to count the current number of Innodb transactions waiting for row locks, in units. |
| RDS for Relational Databases | MYSQL/MariaDB | Database Bytes Received Per Second | huawei.rds_bytes_recv_rate | This metric is used to count the bytes received by the database per second, in bytes/second. |
| RDS for Relational Databases | MYSQL/MariaDB | Database Bytes Sent Per Second | huawei.rds_bytes_sent_rate | This metric is used to count the bytes sent by the database per second, in bytes/second. |
| RDS for Relational Databases | MYSQL/MariaDB | innodb Average Data Read Per Second | huawei.rds_innodb_pages_read_rate | This metric is used to count the average data read by innodb per second, in pages/second. |
| RDS for Relational Databases | MYSQL/MariaDB | innodb Average Data Written Per Second | huawei.rds_innodb_pages_written_rate | This metric is used to count the average data written by innodb per second, in pages/second. |
| RDS for Relational Databases | MYSQL/MariaDB | Average redo log Written Per Second | huawei.rds_innodb_os_log_written_rate | This metric is used to count the average size of redo log written per second, in bytes/second. |
| RDS for Relational Databases | MYSQL/MariaDB | innodb_buffer_pool Read Requests Per Second | huawei.rds_innodb_buffer_pool_read_requests_rate | This metric is used to count the number of read requests per second for innodb_buffer_pool, in times/second. |
| RDS for Relational Databases | MYSQL/MariaDB | innodb_buffer_pool Write Requests Per Second | huawei.rds_innodb_buffer_pool_write_requests_rate | This metric is used to count the number of write requests per second for innodb_buffer_pool, in times/second. |
| RDS for Relational Databases | MYSQL/MariaDB | innodb_buffer_pool Pages Flushed Per Second | huawei.rds_innodb_buffer_pool_pages_flushed_rate | This metric is used to count the number of pages flushed per second for innodb_buffer_pool, in times/second. |
| RDS for Relational Databases | MYSQL/MariaDB | Waits Due to Insufficient log buffer Flushing to Disk | huawei.rds_innodb_log_waits_rate | This metric is used to count the number of waits due to insufficient log buffer flushing to disk per second, in times/second. |
| RDS for Relational Databases | MYSQL/MariaDB | Temporary Tables Created Per Second | huawei.rds_created_tmp_tables_rate | This metric is used to count the number of temporary tables created per second, in units/second. |
| RDS for Relational Databases | MYSQL/MariaDB | Waiting Thread Count | huawei.rds_wait_thread_count | This metric is used to count the number of waiting threads, in units. |
| RDS for Relational Databases | MYSQL/MariaDB | Row Lock Average Wait Time | huawei.rds_innodb_row_lock_time_avg | This metric is used to count the average wait time for innodb row locks. |
| RDS for Relational Databases | MYSQL/MariaDB | Current Row Lock Waits | huawei.rds_innodb_row_lock_current_waits | This metric is used to count the current number of innodb row lock waits, in units. |
| RDS for Relational Databases | MYSQL/MariaDB | MDL Lock Count | huawei.rds_mdl_lock_count | This metric is used to count the number of MDL locks, in units. |
| RDS for Relational Databases | MYSQL/MariaDB | Buffer Pool Free Page Wait Count | huawei.rds_buffer_pool_wait_free | This metric is used to count the number of waits for free pages in the InnoDB buffer pool. |
| RDS for Relational Databases | MYSQL/MariaDB | Active Connection Usage Rate | huawei.rds_conn_active_usage | This metric counts the percentage of active connections to the maximum connections. |
| RDS for Relational Databases | MYSQL/MariaDB | Log Wait Count | huawei.rds_innodb_log_waits_count | This metric is used to count the number of log waits, in units. |
| RDS for Relational Databases | MYSQL/MariaDB | Long Transaction Metric | huawei.rds_long_transaction | This metric counts the duration data of long transactions, in seconds. |
| RDS for Relational Databases | MYSQL/MariaDB | Frontend Connections | huawei.rds_proxy_frontend_connections | The number of connections between the application and the Proxy. |
| RDS for Relational Databases | MYSQL/MariaDB | Backend Connections | huawei.rds_proxy_backend_connections | The number of connections between the Proxy and the RDS database. |
| RDS for Relational Databases | MYSQL/MariaDB | Average Response Time | huawei.rds_proxy_average_response_time | Average response time. |
| RDS for Relational Databases | MYSQL/MariaDB | QPS | huawei.rds_proxy_query_per_seconds | Number of SQL query statements. |
| RDS for Relational Databases | MYSQL/MariaDB | Read Ratio | huawei.rds_proxy_read_query_proportions | The proportion of read requests to total requests. |
| RDS for Relational Databases | MYSQL/MariaDB | Write Ratio | huawei.rds_proxy_write_query_proportions | The proportion of write requests to total requests. |
| RDS for Relational Databases | MYSQL/MariaDB | Average Frontend Connections Created Per Second | huawei.rds_proxy_frontend_connection_creation | Counts the average number of frontend connections created per second by client applications for the database proxy service. |
| RDS for Relational Databases | MYSQL/MariaDB | Average Queries in Transactions Per Second | huawei.rds_proxy_transaction_query | Counts the average number of select executions per second within transactions. |
| RDS for Relational Databases | MYSQL/MariaDB | Average Multi-statement Executions Per Second | huawei.rds_proxy_multi_statement_query | Counts the average number of Multi-Statements executions per second. |
| RDS for Relational Databases | PostgreSQL | Active Connections | huawei.active_connections | This metric counts the current number of active connections in the database. |
| RDS for Relational Databases | PostgreSQL | Kernel Mode CPU Time Ratio | huawei.cpu_sys_usage | This metric counts the kernel mode CPU time ratio. |
| RDS for Relational Databases | PostgreSQL | User Mode CPU Time Ratio | huawei.cpu_user_usage | This metric counts the user mode CPU time ratio. |
| RDS for Relational Databases | PostgreSQL | Disk I/O Wait Time Ratio | huawei.cpu_wait_usage | This metric counts the disk I/O wait time ratio. |
| RDS for Relational Databases | PostgreSQL | inode Count | huawei.data_disk_inode_used | The number of inodes used on the data disk. |
| RDS for Relational Databases | PostgreSQL | Maximum Database Age | huawei.db_max_age | This metric counts the maximum database age of the current database (gets the max(age(datfrozenxid)) value from the pg_database table). |
| RDS for Relational Databases | PostgreSQL | Database User Fastest Expiration Time | huawei.dbuser_passwd_deadline | Queries the database user password expiration time, returns the minimum value of expiration time minus the current time. |
| RDS for Relational Databases | PostgreSQL | Disk I/O Usage | huawei.disk_io_usage | This metric counts the disk I/O usage rate. Disk I/O usage refers to the percentage of time the disk is processing I/O requests to the total time. |
| RDS for Relational Databases | PostgreSQL | Primary-Standby WAL Log Flush Delay | huawei.flush_lsn_replication_latency_size | This metric gets the delay size of WAL logs flushed to disk by the standby. |
| RDS for Relational Databases | PostgreSQL | Idle Transaction Connections | huawei.idle_transaction_connections | This metric counts the current number of idle connections in the database. |
| RDS for Relational Databases | PostgreSQL | Inactive Logical Replication Slot Count | huawei.inactive_logical_replication_slot | This metric is used to count the number of inactive logical replication slots in the current database. |
| RDS for Relational Databases | PostgreSQL | I/O Read Response Delay | huawei.io_read_delay | This metric counts the average disk read response delay (in milliseconds). |
| RDS for Relational Databases | PostgreSQL | I/O Write Response Delay | huawei.io_write_delay | This metric counts the average disk write response delay (in milliseconds). |
| RDS for Relational Databases | PostgreSQL | Sessions Waiting for Locks | huawei.lock_waiting_sessions | This metric counts the current number of sessions in a blocked state. |
| RDS for Relational Databases | PostgreSQL | Longest Transaction Lifetime | huawei.oldest_transaction_duration | This metric counts the longest transaction lifetime in the current database. |
| RDS for Relational Databases | PostgreSQL | Longest Pending Transaction Lifetime | huawei.oldest_transaction_duration_2pc | This metric counts the longest pending transaction lifetime in the current database. |
| RDS for Relational Databases | PostgreSQL | Packet Loss Rate Between Primary and Disaster Recovery Instance | huawei.packet_loss_rate | This metric counts the packet loss rate between the database primary and disaster recovery instances. |
| RDS for Relational Databases | PostgreSQL | Disaster Recovery Node Replication Status | huawei.pg_dr_repl_stat | Disaster recovery status. The number meanings are as follows: Abnormal: 0; startup: 1; catchup: 2; streaming: 3; backup: 4; stopping: 5 |
| RDS for Relational Databases | PostgreSQL | LSN Delay Between Primary and Disaster Recovery Instance | huawei.pg_dr_wal_delay | This metric counts the delay between the current LSN of the database primary and the replay LSN of the disaster recovery instance. |
| RDS for Relational Databases | PostgreSQL | Audit Log Size | huawei.pgaudit_log_size | This metric gets the current audit log size. |
| RDS for Relational Databases | SQL Server | Lazy Writes to Cache Per Second | huawei.mssql_lazy_write_per_sec | This metric is used to count the number of buffers written by the Lazy writer per second. |
| RDS for Relational Databases | SQL Server | Processes Pending Memory Grant | huawei.mssql_mem_grant_pending | This metric is used to count the total number of processes waiting to receive a memory grant for use, indicating memory pressure. |
| RDS for Relational Databases | SQL Server | Page Life Expectancy in Buffer Pool | huawei.mssql_page_life_expectancy | This metric is used to count the number of seconds a page stays in the buffer pool after not being referenced. |
| RDS for Relational Databases | SQL Server | Page Reads Per Second | huawei.mssql_page_reads_per_sec | This metric is used to count the number of pages read per second. |
| RDS for Relational Databases | SQL Server | Tempdb Disk Size | huawei.mssql_tempdb_disk_size | The current disk size occupied by the tempdb. |
| RDS for Relational Databases | SQL Server | Worker Threads Usage Rate | huawei.mssql_worker_threads_usage_rate | The ratio of the current actual total worker threads to the max worker threads value. |
| RDS for Relational Databases | SQL Server | Average Disk Queue Length | huawei.rds053_avg_disk_queue_length | This metric is used to count the number of processes waiting to write to the measured object. |
| RDS for Relational Databases | SQL Server | Database Connections in Use | huawei.rds054_db_connections_in_use | The number of connections from users to the database. |
| RDS for Relational Databases | SQL Server | Average Transactions Per Second | huawei.rds055_transactions_per_sec | This metric is used to count the number of transactions started per second in the database. |
| RDS for Relational Databases | SQL Server | Average Batches Per Second | huawei.rds056_batch_per_sec | This metric is used to count the number of Transact-SQL command batches received per second. |
| RDS for Relational Databases | SQL Server | Logins Per Second | huawei.rds057_logins_per_sec | This metric is used to count the total number of logins started per second. |
| RDS for Relational Databases | SQL Server | Logouts Per Second | huawei.rds058_logouts_per_sec | This metric is used to count the total number of logout operations started per second. |
| RDS for Relational Databases | SQL Server | Cache Hit Ratio | huawei.rds059_cache_hit_ratio | This metric is used to count the percentage of pages found in the buffer cache without needing to read from disk. |
| RDS for Relational Databases | SQL Server | Average SQL Compilations Per Second | huawei.rds060_sql_compilations_per_sec | This metric is used to count the number of SQL compilations per second. |
| RDS for Relational Databases | SQL Server | Average SQL Recompilations Per Second | huawei.rds061_sql_recompilations_per_sec | This metric is used to count the number of statement recompilations per second. |
| RDS for Relational Databases | SQL Server | Full Scans Per Second | huawei.rds062_full_scans_per_sec | This metric is used to count the number of unrestricted full scans per second. |
| RDS for Relational Databases | SQL Server | User Errors Per Second | huawei.rds063_errors_per_sec | This metric is used to count the number of user errors per second. |
| RDS for Relational Databases | SQL Server | Latch Waits Per Second | huawei.rds064_latch_waits_per_sec | This metric is used to count the number of latch requests that could not be granted immediately per second. |
| RDS for Relational Databases | SQL Server | Lock Waits Per Second | huawei.rds065_lock_waits_per_sec | This metric is used to count the number of lock requests that required the caller to wait per second. |
| RDS for Relational Databases | SQL Server | Lock Requests Per Second | huawei.rds066_lock_requests_per_sec | This metric is used to count the number of new locks and lock conversions requested by the lock manager per second. |
| RDS for Relational Databases | SQL Server | Lock Timeouts Per Second | huawei.rds067_timeouts_per_sec | This metric is used to count the number of lock requests that timed out per second. |
| RDS for Relational Databases | SQL Server | Average Lock Wait Delay | huawei.rds068_avg_lock_wait_time | This metric is used to count the average wait time (in milliseconds) per lock request that caused a wait. |
| RDS for Relational Databases | SQL Server | Deadlocks Per Second | huawei.rds069_deadlocks_per_sec | This metric is used to count the number of lock requests that caused a deadlock per second. |
| RDS for Relational Databases | SQL Server | Checkpoint Pages Written Per Second | huawei.rds070_checkpoint_pages_per_sec | This metric is used to count the number of pages flushed to disk per second by checkpoints or other operations that flush all dirty pages. |
| RDS for Relational Databases | SQL Server | Data Synchronization Delay | huawei.rds077_replication_delay | This metric is used to count the replication delay between primary and standby instances. Since SQL Server instance replication delays are at the database level and each database does synchronization independently, the instance-level replication delay is the value of the database with the largest replication delay (standalone instances are all 0s). |
| Distributed Message Service | Message Queue Common | Node Alive Status | huawei.broker_alive | Indicates whether the Kafka node is alive. 1: Alive 0: Offline |
| Distributed Message Service | Message Queue Common | Connection Count | huawei.broker_connections | Counts the current number of all TCP connections for the Kafka node. |
| Distributed Message Service | Message Queue Common | CPU Core Average Load | huawei.broker_cpu_core_load | This metric is the average load per CPU core collected from the Kafka node virtual machine level. |
| Distributed Message Service | Message Queue Common | CPU Usage | huawei.broker_cpu_usage | The CPU usage rate of the virtual machine. |
| Distributed Message Service | Message Queue Common | Disk Average Read Operation Time | huawei.broker_disk_read_await | This metric is used to count the average operation time per read IO for the disk during the measurement period. |
| Distributed Message Service | Message Queue Common | Disk Read Traffic | huawei.broker_disk_read_rate | Disk read operation traffic. Unit: Byte/s, KB/s, MB/s, GB/s |
| Distributed Message Service | Message Queue Common | Disk Capacity Usage | huawei.broker_disk_usage | This metric is the disk capacity usage rate collected from the Kafka node virtual machine level. |
| Distributed Message Service | Message Queue Common | Disk Average Write Operation Time | huawei.broker_disk_write_await | This metric is used to count the average operation time per write IO for the disk during the measurement period. |
| Distributed Message Service | Message Queue Common | Disk Write Traffic | huawei.broker_disk_write_rate | Disk write operation traffic. Unit: Byte/s, KB/s, MB/s, GB/s |
| Distributed Message Service | Message Queue Common | Memory Usage | huawei.broker_memory_usage | This metric is the memory usage rate collected from the Kafka node virtual machine level. |
| Distributed Message Service | Message Queue Common | Network Inbound Traffic | huawei.broker_total_bytes_in_rate | Counts the inbound network access traffic per second for the Broker node. |
| Distributed Message Service | Message Queue Common | Network Outbound Traffic | huawei.broker_total_bytes_out_rate | Counts the outbound network access traffic per second for the Broker node. |
| Distributed Message Service | Message Queue Common | Topic Count | huawei.current_topics | The number of topics in the instance. |
| Distributed Message Service | Message Queue Common | Production Traffic | huawei.instance_bytes_in_rate | Counts the number of bytes produced per second in the instance. Unit: Byte/s, KB/s, MB/s, GB/s |
| Distributed Message Service | Message Queue Common | Consumption Traffic | huawei.instance_bytes_out_rate | Counts the number of bytes consumed per second in the instance. Unit: Byte/s, KB/s, MB/s, GB/s |
| Distributed Message Service | Message Queue Common | Consumer Count | huawei.queue_consumers | This metric is used to count the number of consumers subscribed to the queue. |
| Distributed Message Service | Message Queue Common | Consumption Rate | huawei.queue_messages_deliver_get_rate | This metric is used to count the number of messages flowing out of the queue per second. |
| Distributed Message Service | Message Queue Common | Production Rate | huawei.queue_messages_publish_rate | This metric is used to count the number of messages flowing into the queue per second. |
| Distributed Message Service | Message Queue Common | Queue Consumable Messages | huawei.queue_messages_ready | This metric is used to count the number of consumable messages in the queue. |
| Distributed Message Service | Message Queue Common | Production Traffic | huawei.topic_bytes_in_rate | This metric is used to count the number of bytes produced per second. Unit: Byte/s, KB/s, MB/s, GB/s |
| Distributed Message Service | Message Queue Common | Consumption Traffic | huawei.topic_bytes_out_rate | This metric is used to count the number of bytes consumed per second. Unit: Byte/s, KB/s, MB/s, GB/s |
| Distributed Message Service | RocketMQ Instance Node | Message Consumption Count | huawei.broker_consume_msg | The number of messages consumed by the node in one minute. |
| Distributed Message Service | RocketMQ Instance Node | Message Consumption Rate | huawei.broker_consume_rate | The number of messages consumed by the node per second. |
| Distributed Message Service | RocketMQ Instance Node | Message Production Count | huawei.broker_produce_msg | The number of messages received by the node in one minute. |
| Distributed Message Service | RocketMQ Instance Node | Node Production Request P99 Processing Time | huawei.broker_produce_p99 | The processing time at the 99th percentile when all production request processing times of the node are sorted in ascending order. |
| Distributed Message Service | RocketMQ Instance Node | Node Production Request P99.9 Processing Time | huawei.broker_produce_p999 | The processing time at the 99.9th percentile when all production request processing times of the node are sorted in ascending order. |
| Distributed Message Service | RocketMQ Instance Node | Message Production Rate | huawei.broker_produce_rate | The number of messages received by the node per second. |
| Distributed Message Service | RocketMQ Instance Node | Scheduled Messages Produced in One Minute | huawei.broker_produce_scheduled_msg | The number of scheduled messages produced by the node in one minute. |
| Distributed Message Service | RocketMQ Instance Node | Production Success Rate | huawei.broker_produce_success_rate | The success rate of all production requests for the node. |
| Distributed Message Service | RocketMQ Instance Node | Message Retention Time | huawei.broker_retention_period | The difference between the current time and the time of the earliest message saved by the node. |
| Distributed Message Service | RocketMQ Instance Queue | Message Consumption Count | huawei.topic_consume_msg | The number of messages consumed by the Topic in one minute. |
| Distributed Message Service | RocketMQ Instance Queue | Message Consumption Rate | huawei.topic_consume_rate | The number of messages consumed by the Topic per second. |
| Distributed Message Service | RocketMQ Instance Queue | Message Production Count | huawei.topic_produce_msg | The number of messages received by the Topic in one minute. |
| Distributed Message Service | RocketMQ Instance Queue | Message Production Rate | huawei.topic_produce_rate | The number of messages received by the Topic per second. |
| Distributed Message Service | RocketMQ Instance Consumer Group | Consumer Group Subscription Consistency | huawei.consumer_subscription_consistency | Whether the subscription relationships of consumers within the consumer group are consistent within one minute. 0: Consistent; 1: Inconsistent |
| Distributed Message Service | RocketMQ Instance Consumer Group | Message Backlog (Consumable Messages for Consumer Group) | huawei.group_accumulation | The message backlog of the consumer group. |
| Distributed Message Service | RocketMQ Instance Consumer Group | Message Consumption Count | huawei.group_consume_msg | The number of messages consumed by the consumer group in one minute. |
| Distributed Message Service | RocketMQ Instance Consumer Group | Consumable Messages | huawei.group_topic_accumulation | The message backlog of the consumer group for the specified Topic. |
| Distributed Message Service | RocketMQ Instance Consumer Group | Message Consumption Count | huawei.group_topic_consume_msg | The number of messages consumed by the consumer group for the specified Topic in one minute. |
| Distributed Message Service | RocketMQ Instance Consumer Group | Consumption Rate | huawei.group_topic_consume_rate | The number of messages consumed by the consumer group for the specified Topic per second. |
| Distributed Message Service | RocketMQ Instance Dead Letter Queue | Dead Letter Topic Message Count | huawei.dlq_accumulation | The total message count of the dead letter topic. |
| Distributed Message Service | RocketMQ Instance Dead Letter Queue | Dead Letter Message Increase | huawei.dlq_increase | The number of messages added to the dead letter topic within one minute. |
| Distributed Message Service | RocketMQ Instance | Queue Count | huawei.current_queues | The number of queues in the instance. |
| Distributed Message Service | RocketMQ Instance | Message Backlog | huawei.instance_accumulation | The sum of backlogged messages of all consumer groups in the instance. |
| Distributed Message Service | RocketMQ Instance | Message Consumption Count | huawei.instance_consume_msg | The number of messages consumed by the instance in one minute. |
| Distributed Message Service | RocketMQ Instance | Instance Consumption Rate | huawei.instance_consume_rate | Instance consumption rate. |
| Distributed Message Service | RocketMQ Instance | Converted Consumption TPS | huawei.instance_consume_rate_for_ratelimit | The converted consumption TPS based on message size and type, used for calculating flow control. |
| Distributed Message Service | RocketMQ Instance | Consumption TPS Percentage | huawei.instance_consume_ratelimit_percentage | The percentage of converted consumption TPS to the consumption flow control upper limit. |
| Distributed Message Service | RocketMQ Instance | Consumption Flow Control Count | huawei.instance_consume_ratelimit_times | The number of times consumption was flow-controlled within one minute. |
| Distributed Message Service | RocketMQ Instance | Message Production Count | huawei.instance_produce_msg | The number of messages received by the instance in one minute. |
| Distributed Message Service | RocketMQ Instance | Instance Production Rate | huawei.instance_produce_rate | Instance production rate. |
| Distributed Message Service | RocketMQ Instance | Converted Production TPS | huawei.instance_produce_rate_for_ratelimit | The converted production TPS based on message size and type, used for calculating flow control. |
| Distributed Message Service | RocketMQ Instance | Production TPS Percentage | huawei.instance_produce_ratelimit_percentage | The percentage of converted production TPS to the production flow control upper limit. |
| Distributed Message Service | RocketMQ Instance | Production Flow Control Count | huawei.instance_produce_ratelimit_times | The number of times production was flow-controlled within one minute. |
| Distributed Message Service | RocketMQ Instance | Scheduled Messages Produced | huawei.instance_produce_scheduled_msg | The number of scheduled messages received by the instance in one minute. |
| Distributed Message Service | RocketMQ Instance | Instance Message Retention Time | huawei.instance_retention_period | Instance message retention time. |
| Distributed Message Service | RabbitMQ Instance Node | Connection Usage Rate | huawei.connections_usage | The ratio of current actual connections to the maximum connections for the node. |
| Distributed Message Service | RabbitMQ Instance Node | Available Storage Space | huawei.dms.disk_free | This metric is used to count the available storage space of the current node. Unit: Byte, KB, MB, GB, TB, PB |
| Distributed Message Service | RabbitMQ Instance Node | File Handle Count | huawei.fd_used | This metric is used to count the number of file handles occupied by RabbitMQ on the current node. |
| Distributed Message Service | RabbitMQ Instance Node | Memory Usage | huawei.mem_used | This metric is used to count the memory usage of RabbitMQ on the current node. Unit: Byte, KB, MB, GB, TB, PB |
| Distributed Message Service | RabbitMQ Instance Node | Erlang Process Count | huawei.proc_used | This metric is used to count the number of Erlang processes used by RabbitMQ on the current node. |
| Distributed Message Service | RabbitMQ Instance Node | Node Alive Status | huawei.rabbitmq_alive | Indicates whether the RabbitMQ node is alive. 1: Alive; 0: Offline |
| Distributed Message Service | RabbitMQ Instance Node | CPU Core Average Load | huawei.rabbitmq_cpu_core_load | Counts the average load per CPU core for the RabbitMQ node virtual machine. |
| Distributed Message Service | RabbitMQ Instance Node | CPU Usage | huawei.rabbitmq_cpu_usage | Counts the CPU usage rate of the RabbitMQ node virtual machine. |
| Distributed Message Service | RabbitMQ Instance Node | Disk High Watermark Status | huawei.rabbitmq_disk_insufficient | Indicates whether the RabbitMQ node has triggered the disk high watermark. If triggered, it will block all producers in the cluster. 1: Triggered 0: Not triggered |
| Distributed Message Service | RabbitMQ Instance Node | Disk Average Read Operation Time | huawei.rabbitmq_disk_read_await | This metric is used to count the average operation time per read IO for the disk during the measurement period. |
| Distributed Message Service | RabbitMQ Instance Node | Disk Read Traffic | huawei.rabbitmq_disk_read_rate | Counts the disk read bytes per second for the node. Unit: Byte/s, KB/s, MB/s, GB/s |
| Distributed Message Service | RabbitMQ Instance Node | Disk Capacity Usage | huawei.rabbitmq_disk_usage | Counts the disk capacity usage rate of the RabbitMQ node virtual machine. |
| Distributed Message Service | RabbitMQ Instance Node | Disk Average Write Operation Time | huawei.rabbitmq_disk_write_await | This metric is used to count the average operation time per write IO for the disk during the measurement period. |
| Distributed Message Service | RabbitMQ Instance Node | Disk Write Traffic | huawei.rabbitmq_disk_write_rate | Counts the disk write bytes per second for the node. Unit: Byte/s, KB/s, MB/s, GB/s |
| Distributed Message Service | RabbitMQ Instance Node | Memory High Watermark Status | huawei.rabbitmq_memory_high_watermark | Indicates whether the RabbitMQ node has triggered the memory high watermark. If triggered, it will block all producers in the cluster. 1: Triggered 0: Not triggered |
| Distributed Message Service | RabbitMQ Instance Node | Memory Usage | huawei.rabbitmq_memory_usage | Counts the memory usage rate of the RabbitMQ node virtual machine. |
| Distributed Message Service | RabbitMQ Instance Node | Network Inbound Traffic | huawei.rabbitmq_node_bytes_in_rate | Counts the inbound network access traffic per second for the RabbitMQ node. Unit: Byte/s, KB/s, MB/s, GB/s |
| Distributed Message Service | RabbitMQ Instance Node | Network Outbound Traffic | huawei.rabbitmq_node_bytes_out_rate | Counts the outbound network access traffic per second for the RabbitMQ node. Unit: Byte/s, KB/s, MB/s, GB/s |
| Distributed Message Service | RabbitMQ Instance Node | Node Queue Count | huawei.rabbitmq_node_queues | This metric is used to count the number of queues in the RabbitMQ node. |
| Distributed Message Service | RabbitMQ Instance Node | Socket Connection Count | huawei.socket_used | This metric is used to count the number of Socket connections used by RabbitMQ on the current node. |
| Distributed Message Service | RabbitMQ Instance Queue | Erlang Process Memory Consumption | huawei.queue_memory | This metric is used to count the memory bytes consumed by the Erlang process associated with the queue, including stack, heap, and internal structures. Unit: Byte, KB, MB, GB, TB, PB |
| Distributed Message Service | RabbitMQ Instance Queue | Total Message Size | huawei.queue_message_bytes | This metric is used to count the total size (bytes) of all messages in the queue. Unit: Byte, KB, MB, GB, TB, PB |
| Distributed Message Service | RabbitMQ Instance Queue | Consumption Rate (Manual Acknowledgment) | huawei.queue_messages_ack_rate | This metric is used to count the number of messages delivered to the client and acknowledged per second for the queue. |
| Distributed Message Service | RabbitMQ Instance Queue | Total Messages (Persistent) | huawei.queue_messages_persistent | This metric is used to count the total number of persistent messages in the queue (always 0 for transient queues). |
| Distributed Message Service | RabbitMQ Instance Queue | Total Messages (Memory) | huawei.queue_messages_ram | This metric is used to count the total number of messages residing in memory in the queue. |
| Distributed Message Service | RabbitMQ Instance Queue | Redelivery Rate | huawei.queue_messages_redeliver_rate | This metric is used to count the number of redelivered messages per second for the queue. |
| Distributed Message Service | RabbitMQ Instance Queue | Queue Unacknowledged Messages | huawei.queue_messages_unacknowledged | This metric is used to count the number of consumed but unacknowledged messages in the queue. |
| Distributed Message Service | RabbitMQ Instance Vhost | Production Traffic | huawei.vhost_bytes_in_rate | Counts the number of bytes produced per second in the Vhost. Unit: Byte/s, KB/s, MB/s, GB/s |
| Distributed Message Service | RabbitMQ Instance Vhost | Consumption Traffic | huawei.vhost_bytes_out_rate | Counts the number of bytes consumed per second in the Vhost. Unit: Byte/s, KB/s, MB/s, GB/s |
| Distributed Message Service | RabbitMQ Instance Vhost | Channel Count | huawei.vhost_channels | Counts the total number of channels in the Vhost. |
| Distributed Message Service | RabbitMQ Instance Vhost | Connection Count | huawei.vhost_connections | Counts the total number of connections in the Vhost. |
| Distributed Message Service | RabbitMQ Instance Vhost | Consumer Count | huawei.vhost_consumers | Counts the total number of consumers in the Vhost. |
| Distributed Message Service | RabbitMQ Instance Vhost | Consumption Rate | huawei.vhost_messages_deliver_get_rate | Counts the real-time message consumption rate in the Vhost. |
| Distributed Message Service | RabbitMQ Instance Vhost | Production Rate | huawei.vhost_messages_publish_rate | Counts the real-time message production rate in the Vhost. |
| Distributed Message Service | RabbitMQ Instance Vhost | Consumable Messages | huawei.vhost_messages_ready | Counts the total number of consumable messages in the Vhost. |
| Distributed Message Service | RabbitMQ Instance Vhost | Queue Count | huawei.vhost_queues | Counts the total number of queues in the Vhost. |
| Distributed Message Service | RabbitMQ Instance Vhost | vhost Request Rate | huawei.vhost_tps | Counts the number of requests processed per second for the current Vhost. |
| Distributed Message Service | RabbitMQ Instance Queue | Production Traffic | huawei.queue_bytes_in_rate | This metric is used to count the real-time message production rate for the queue. Unit: Byte/s, KB/s, MB/s, GB/s |
| Distributed Message Service | RabbitMQ Instance Queue | Consumption Traffic | huawei.queue_bytes_out_rate | This metric is used to count the real-time message consumption rate for the queue. Unit: Byte/s, KB/s, MB/s, GB/s |
| Distributed Message Service | RabbitMQ Instance Exchange | Production Traffic | huawei.exchange_bytes_in_rate | Counts the number of bytes produced per second in the Exchange. Unit: Byte/s, KB/s, MB/s, GB/s |
| Distributed Message Service | RabbitMQ Instance Exchange | Production Rate | huawei.exchange_messages_publish_rate | Counts the real-time message production rate in the Exchange. |
| Distributed Message Service | RabbitMQ Instance | Channel Count | huawei.channels | This metric is used to count the total number of channels in the RabbitMQ instance. |
| Distributed Message Service | RabbitMQ Instance | Channels in block State | huawei.channels_states_block | This metric is used to count the total number of channels in the entire instance with state blocking/blocked. |
| Distributed Message Service | RabbitMQ Instance | Channels in close State | huawei.channels_states_close | This metric is used to count the total number of channels in the entire instance with state closing/closed. |
| Distributed Message Service | RabbitMQ Instance | Channels in flow State | huawei.channels_states_flow | This metric is used to count the total number of channels in the entire instance with state flow. |
| Distributed Message Service | RabbitMQ Instance | Channels in running State | huawei.channels_states_running | This metric is used to count the total number of channels in the entire instance with state starting/tuning/opening/running. |
| Distributed Message Service | RabbitMQ Instance | Connection Count | huawei.connections | This metric is used to count the total number of connections in the RabbitMQ instance. |
| Distributed Message Service | RabbitMQ Instance | Connections in block State | huawei.connections_states_block | This metric is used to count the total number of connections in the entire instance with state blocking/blocked. |
| Distributed Message Service | RabbitMQ Instance | Connections in close State | huawei.connections_states_close | This metric is used to count the total number of connections in the entire instance with state closing/closed. |
| Distributed Message Service | RabbitMQ Instance | Connections in flow State | huawei.connections_states_flow | This metric is used to count the total number of connections in the entire instance with state flow. |
| Distributed Message Service | RabbitMQ Instance | Connections Reached Channel Limit | huawei.connections_states_full | This metric is used to count the number of connections in the instance that have reached the channel usage limit. |
| Distributed Message Service | RabbitMQ Instance | Connections in running State | huawei.connections_states_running | This metric is used to count the total number of connections in the entire instance with state starting/tuning/opening/running. |
| Distributed Message Service | RabbitMQ Instance | Consumer Count | huawei.consumers | This metric is used to count the total number of consumers in the RabbitMQ instance. |
| Distributed Message Service | RabbitMQ Instance | Consumption Rate (Manual Acknowledgment) | huawei.deliver | Counts the real-time message consumption rate (manual acknowledgment) in the RabbitMQ instance. |
| Distributed Message Service | RabbitMQ Instance | Consumption Rate | huawei.deliver_get | Counts the real-time message consumption rate in the RabbitMQ instance. |
| Distributed Message Service | RabbitMQ Instance | Consumption Rate (Automatic Acknowledgment) | huawei.deliver_no_ack | Counts the real-time message consumption rate (automatic acknowledgment) in the RabbitMQ instance. |
| Distributed Message Service | RabbitMQ Instance | Instance Disk Capacity Usage | huawei.instance_disk_usage | Instance disk capacity usage rate. |
| Distributed Message Service | RabbitMQ Instance | Instance Requests Per Second | huawei.instance_tps | Counts the number of requests processed per second by the RabbitMQ instance. |
| Distributed Message Service | RabbitMQ Instance | Consumable Messages | huawei.messages_ready | This metric is used to count the total number of consumable messages in the RabbitMQ instance. |
| Distributed Message Service | RabbitMQ Instance | Unacknowledged Messages | huawei.messages_unacknowledged | This metric is used to count the total number of consumed but unacknowledged messages in the RabbitMQ instance. |
| Distributed Message Service | RabbitMQ Instance | Production Rate | huawei.publish | Counts the real-time message production rate in the RabbitMQ instance. |
| Distributed Message Service | RabbitMQ Instance | Queue Count | huawei.queues | This metric is used to count the total number of queues in the RabbitMQ instance. |
| Distributed Message Service | RabbitMQ Instance | Queues in flow State | huawei.queues_states_flow | This metric is used to count the total number of queues in the entire instance with state flow. |
| Distributed Message Service | RabbitMQ Instance | Queues in running State | huawei.queues_states_running | This metric is used to count the total number of queues in the entire instance with state running. |
| Distributed Message Service | Kafka Instance Node | Production Traffic | huawei.broker_bytes_in_rate | This metric is used to count the number of bytes produced per second. Unit: Byte/s, KB/s, MB/s, GB/s |
| Distributed Message Service | Kafka Instance Node | Consumption Traffic | huawei.broker_bytes_out_rate | This metric is used to count the number of bytes consumed per second. Unit: Byte/s, KB/s, MB/s, GB/s |
| Distributed Message Service | Kafka Instance Node | Node Data Capacity | huawei.broker_data_size | This metric is used to count the current message data size of the node. |
| Distributed Message Service | Kafka Instance Node | Consumption Request Average Processing Time | huawei.broker_fetch_mean | Counts the average processing time for consumption requests by the Broker node. |
| Distributed Message Service | Kafka Instance Node | JVM Heap Memory Usage | huawei.broker_heap_usage | This metric is the heap memory usage rate collected from the Kafka process JVM of the Kafka node. |
| Distributed Message Service | Kafka Instance Node | Message Production Rate | huawei.broker_messages_in_rate | This metric is used to count the number of messages produced per second. |
| Distributed Message Service | Kafka Instance Node | Production Request Average Processing Time | huawei.broker_produce_mean | Counts the average processing time for production requests by the Broker node. |
| Distributed Message Service | Kafka Instance Node | Network Bandwidth Utilization | huawei.network_bandwidth_usage | Network bandwidth utilization rate. |
| Distributed Message Service | Kafka Instance Queue | Partition Message Count | huawei.partition_messages | This metric is used to count the current number of messages in the partition. |
| Distributed Message Service | Kafka Instance Queue | Produced Messages | huawei.produced_messages | This metric is used to count the total number of messages produced so far. |
| Distributed Message Service | Kafka Instance Queue | Queue Data Capacity | huawei.topic_data_size | This metric is used to count the current message data size of the queue. Unit: Byte, KB, MB, GB, TB, PB |
| Distributed Message Service | Kafka Instance Queue | Queue Total Messages | huawei.topic_messages | This metric is used to count the current total number of messages in the queue. |
| Distributed Message Service | Kafka Instance Queue | Message Production Rate | huawei.topic_messages_in_rate | This metric is used to count the number of messages produced per second. |
| Distributed Message Service | Kafka Instance Consumer Group | Consumer Group Consumed Messages | huawei.consumer_messages_consumed | This metric is used to count the number of messages currently consumed by the consumer group. |
| Distributed Message Service | Kafka Instance Consumer Group | Consumer Group Consumption Rate | huawei.consumer_messages_consumed_per_min | Counts the consumption number per minute for the consumer group. |
| Distributed Message Service | Kafka Instance Consumer Group | Message Backlog (Consumable Messages for Consumer Group) | huawei.consumer_messages_remained | This metric is used to count the number of remaining consumable messages for the consumer group. |
| Distributed Message Service | Kafka Instance Consumer Group | Partition Consumed Messages | huawei.messages_consumed | This metric is used to count the number of messages currently consumed by the consumer group. |
| Distributed Message Service | Kafka Instance Consumer Group | Partition Consumption Rate | huawei.messages_consumed_per_min | Counts the consumption number per minute for the consumer group's specified queue partition. |
| Distributed Message Service | Kafka Instance Consumer Group | Partition Consumable Messages | huawei.messages_remained | This metric is used to count the number of consumable messages for the consumer group. |
| Distributed Message Service | Kafka Instance Consumer Group | Queue Consumed Messages | huawei.topic_messages_consumed | This metric is used to count the number of messages currently consumed by the consumer group for the specified queue. |
| Distributed Message Service | Kafka Instance Consumer Group | Queue Consumption Rate | huawei.topic_messages_consumed_per_min | Counts the consumption number per minute for the consumer group's specified queue. |
| Distributed Message Service | Kafka Instance Consumer Group | Queue Consumable Messages | huawei.topic_messages_remained | This metric is used to count the number of consumable messages for the consumer group's specified queue. |
| Distributed Message Service | Kafka Instance Smart Connect Task | Kafka Data Synchronized Per Minute | huawei.kafka_synchronize_rate | The amount of data synchronized per minute by the Kafka task. |
| Distributed Message Service | Kafka Instance Smart Connect Task | Kafka Data Pending Synchronization | huawei.kafka_wait_synchronize_data | The amount of data pending synchronization for the Kafka task. |
| Distributed Message Service | Kafka Instance Smart Connect Task | Message Delay | huawei.message_delay | The time difference between when a message arrives at the source and when it arrives at the target. |
| Distributed Message Service | Kafka Instance Smart Connect Task | Task Status | huawei.task_status | Current task status. 0: Task abnormal; 1: Task normal |
| Distributed Message Service | Kafka Instance | Partition Count | huawei.current_partitions | This metric is used to count the number of partitions used in the Kafka instance. |
| Distributed Message Service | Kafka Instance | Partition Usage | huawei.current_partitions_usage | This metric is used to count the partition usage rate. |
| Distributed Message Service | Kafka Instance | Message Backlog | huawei.group_msgs | This metric is used to count the total backlogged messages of all consumer groups in the Kafka instance. |
| Load Balancer | Dedicated Type | Dropped Connections | huawei.dropped_connections | Counts the number of connections dropped per second by the measured object. |
| Load Balancer | Dedicated Type | Dropped Packets | huawei.dropped_packets | Counts the number of data packets dropped per second by the measured object. |
| Load Balancer | Dedicated Type | Dropped Traffic | huawei.dropped_traffic | Counts the traffic dropped per second by the measured object. |
| Load Balancer | Dedicated Type | Load Balancer 2xx Status Response Code | huawei.elb_http_2xx | Counts the average number of 2xx status response codes returned by the load balancer per second. |
| Load Balancer | Dedicated Type | Load Balancer 3xx Status Response Code | huawei.elb_http_3xx | Counts the average number of 3xx status response codes returned by the load balancer per second. |
| Load Balancer | Dedicated Type | Load Balancer 400 Status Response Code | huawei.elb_http_400 | Counts the average number of 400 status response codes returned by the load balancer per second. |
| Load Balancer | Dedicated Type | Load Balancer 404 Status Response Code | huawei.elb_http_404 | Counts the average number of 404 status response codes returned by the load balancer per second. |
| Load Balancer | Dedicated Type | Load Balancer 408 Status Response Code | huawei.elb_http_408 | Counts the average number of 408 status response codes returned by the load balancer per second. |
| Load Balancer | Dedicated Type | Load Balancer 499 Status Response Code | huawei.elb_http_499 | Counts the average number of 499 status response codes returned by the load balancer per second. |
| Load Balancer | Dedicated Type | Load Balancer 4xx Status Response Code | huawei.elb_http_4xx | Counts the average number of 4xx status response codes returned by the load balancer per second. |
| Load Balancer | Dedicated Type | Load Balancer 502 Status Response Code | huawei.elb_http_502 | Counts the average number of 502 status response codes returned by the load balancer per second. |
| Load Balancer | Dedicated Type | Load Balancer 503 Status Response Code | huawei.elb_http_503 | Counts the average number of 503 status response codes returned by the load balancer per second. |
| Load Balancer | Dedicated Type | Load Balancer 504 Status Response Code | huawei.elb_http_504 | Counts the average number of 504 status response codes returned by the load balancer per second. |
| Load Balancer | Dedicated Type | Load Balancer 5xx Status Response Code | huawei.elb_http_5xx | Counts the average number of 5xx status response codes returned by the load balancer per second. |
| Load Balancer | Dedicated Type | Black/White List Blocked Packets | huawei.ipgroup_blocked_packets | Counts the data packets blocked by the black/white list flowing into the measured object. |
| Load Balancer | Dedicated Type | Black/White List Blocked Traffic | huawei.ipgroup_blocked_traffic | Counts the traffic blocked by the black/white list flowing into the measured object. |
| Load Balancer | Dedicated Type | Layer 4 Concurrent Connection Usage | huawei.l4_con_usage | Counts the Layer 4 ELB instance concurrent connection usage rate. |
| Load Balancer | Dedicated Type | Layer 4 Inbound Bandwidth Usage | huawei.l4_in_bps_usage | Counts the Layer 4 ELB instance inbound bandwidth usage rate. |
| Load Balancer | Dedicated Type | Layer 4 New Connection Count Usage | huawei.l4_ncps_usage | Counts the Layer 4 ELB instance new connection count usage rate. |
| Load Balancer | Dedicated Type | Layer 4 Outbound Bandwidth Usage | huawei.l4_out_bps_usage | Counts the Layer 4 ELB instance outbound bandwidth usage rate. |
| Load Balancer | Dedicated Type | Layer 7 2xx Request Ratio | huawei.l7_2xx_ratio | Counts the ratio of Layer 7 2xx status response codes. |
| Load Balancer | Dedicated Type | Layer 7 4xx Request Ratio | huawei.l7_4xx_ratio | Counts the ratio of Layer 7 4xx status response codes. |
| Load Balancer | Dedicated Type | Layer 7 5xx Request Ratio | huawei.l7_5xx_ratio | Counts the ratio of Layer 7 5xx status response codes. |
| Load Balancer | Dedicated Type | Layer 7 Concurrent Connection Usage | huawei.l7_con_usage | Counts the Layer 7 ELB instance concurrent connection usage rate. |
| Load Balancer | Dedicated Type | Layer 7 Inbound Bandwidth Usage | huawei.l7_in_bps_usage | Counts the Layer 7 ELB instance inbound bandwidth usage rate. |
| Load Balancer | Dedicated Type | Layer 7 New Connection Count Usage | huawei.l7_ncps_usage | Counts the Layer 7 ELB instance new connection count usage rate. |
| Load Balancer | Dedicated Type | Layer 7 Outbound Bandwidth Usage | huawei.l7_out_bps_usage | Counts the Layer 7 ELB instance outbound bandwidth usage rate. |
| Load Balancer | Dedicated Type | Layer 7 Query Rate Usage | huawei.l7_qps_usage | Counts the Layer 7 ELB instance query rate usage rate. |
| Load Balancer | Dedicated Type | Layer 7 Backend Return Code 101 | huawei.l7_upstream_101 | Counts the average number of 101 status response codes returned per second by the current backend server of the measured object. Supported protocols: HTTP/HTTPS/QUIC |
| Load Balancer | Dedicated Type | Layer 7 Backend Return Code 400 | huawei.l7_upstream_400 | Counts the average number of 400 status response codes returned per second by the current backend server of the measured object. Supported protocols: HTTP/HTTPS/QUIC |
| Load Balancer | Dedicated Type | Layer 7 Backend Return Code 403 | huawei.l7_upstream_403 | Counts the average number of 403 status response codes returned per second by the current backend server of the measured object. Supported protocols: HTTP/HTTPS/QUIC |
| Load Balancer | Dedicated Type | Layer 7 Backend Return Code 404 | huawei.l7_upstream_404 | Counts the average number of 404 status response codes returned per second by the current backend server of the measured object. Supported protocols: HTTP/HTTPS/QUIC |
| Load Balancer | Dedicated Type | Layer 7 Backend Return Code 500 | huawei.l7_upstream_500 | Counts the average number of 500 status response codes returned per second by the current backend server of the measured object. Supported protocols: HTTP/HTTPS/QUIC |
| Load Balancer | Dedicated Type | Layer 7 Backend Return Code 501 | huawei.l7_upstream_501 | Counts the average number of 501 status response codes returned per second by the current backend server of the measured object. Supported protocols: HTTP/HTTPS/QUIC |
| Load Balancer | Dedicated Type | Layer 7 Backend Return Code 502 | huawei.l7_upstream_502 | Counts the average number of 502 status response codes returned per second by the current backend server of the measured object. Supported protocols: HTTP/HTTPS/QUIC |
| Load Balancer | Dedicated Type | Layer 7 Backend Return Code 503 | huawei.l7_upstream_503 | Counts the average number of 503 status response codes returned per second by the current backend server of the measured object. Supported protocols: HTTP/HTTPS/QUIC |
| Load Balancer | Dedicated Type | Layer 7 Backend Return Code 504 | huawei.l7_upstream_504 | Counts the average number of 504 status response codes returned per second by the current backend server of the measured object. Supported protocols: HTTP/HTTPS/QUIC |
| Load Balancer | Dedicated Type | Layer 7 Backend Return Code Other | huawei.l7_upstream_other_status | Counts the average number of other status response codes returned per second by the current backend server of the measured object. Supported protocols: HTTP/HTTPS/QUIC |
| Load Balancer | Dedicated Type | Layer 7 Backend Return Code (2XX) | huawei.m18_l7_upstream_2xx | Counts the average number of 2XX series status response codes returned per second by the current backend server of the measured object. Supported protocols: HTTP/HTTPS/QUIC |
| Load Balancer | Dedicated Type | Layer 7 Backend Return Code (3XX) | huawei.m19_l7_upstream_3xx | Counts the average number of 3XX series status response codes returned per second by the current backend server of the measured object. |
| Load Balancer | Dedicated Type | ipv6 Inbound Bandwidth | huawei.m26_in_bandwidth_ipv6 | Counts the IPv6 network bandwidth consumed by inbound traffic to the measured object. |
| Load Balancer | Dedicated Type | ipv6 Outbound Bandwidth | huawei.m27_out_bandwidth_ipv6 | Counts the IPv6 network bandwidth consumed by outbound traffic from the measured object. |
| Load Balancer | Dedicated Type | Mirror Packet Inbound Rate | huawei.mirror_in_packets | The packet rate at which traffic mirroring forwards traffic from the mirror source to the mirror destination. |
| Load Balancer | Dedicated Type | Mirror Traffic Inbound Rate | huawei.mirror_in_traffic | The traffic rate at which traffic mirroring forwards traffic from the mirror source to the mirror destination. |
| Load Balancer | Dedicated Type | Mirror Packet Outbound Rate | huawei.mirror_out_packets | The packet rate at which traffic mirroring responds traffic from the mirror destination to the mirror source. |
| Load Balancer | Dedicated Type | Mirror Traffic Outbound Rate | huawei.mirror_out_traffic | The traffic rate at which traffic mirroring responds traffic from the mirror destination to the mirror source. |
| Load Balancer | Common Metrics | Concurrent Connections | huawei.m1_cps | In a Layer 4 load balancer, it refers to the number of all TCP and UDP connections established from the measured object to the backend servers. In a Layer 7 load balancer, it refers to the number of all TCP connections established from the client to the ELB. |
| Load Balancer | Common Metrics | Layer 7 Protocol Return Code (Others) | huawei.m10_l7_http_other_status | Counts the current number of Layer 7 non-2XX,3XX,4XX,5XX series status response codes for the measured object. |
| Load Balancer | Common Metrics | Layer 7 Protocol Return Code (404) | huawei.m11_l7_http_404 | Counts the current number of Layer 7 404 status response codes for the measured object. |
| Load Balancer | Common Metrics | Layer 7 Protocol Return Code (499) | huawei.m12_l7_http_499 | Counts the current number of Layer 7 499 status response codes for the measured object. |
| Load Balancer | Common Metrics | Layer 7 Protocol Return Code (502) | huawei.m13_l7_http_502 | Counts the current number of Layer 7 502 status response codes for the measured object. |
| Load Balancer | Common Metrics | Layer 7 RT Average | huawei.m14_l7_rt | Counts the current Layer 7 average response time for the measured object. |
| Load Balancer | Common Metrics | Layer 7 Backend Return Code (4XX) | huawei.m15_l7_upstream_4xx | Counts the current number of Layer 7 backend 4XX series status response codes for the measured object. |
| Load Balancer | Common Metrics | Layer 7 Backend Return Code (5XX) | huawei.m16_l7_upstream_5xx | Counts the current number of Layer 7 backend 5XX series status response codes for the measured object. |
| Load Balancer | Common Metrics | Layer 7 Backend RT Average | huawei.m17_l7_upstream_rt | Counts the current Layer 7 backend average response time for the measured object. From when the measured object forwards the request to the backend server until the measured object receives the response from the backend server. |
| Load Balancer | Common Metrics | Layer 7 Backend RT Maximum | huawei.m1a_l7_upstream_rt_max | Counts the current Layer 7 backend maximum response time for the measured object. |
| Load Balancer | Common Metrics | Layer 7 Backend RT Minimum | huawei.m1b_l7_upstream_rt_min | Counts the current Layer 7 backend minimum response time for the measured object. |
| Load Balancer | Common Metrics | Layer 7 Protocol RT Maximum | huawei.m1c_l7_rt_max | Counts the current Layer 7 maximum response time for the measured object. From when the measured object receives the client request until the measured object returns all responses to the client. |
| Load Balancer | Common Metrics | Layer 7 Protocol RT Minimum | huawei.m1d_l7_rt_min | Counts the current Layer 7 minimum response time for the measured object. From when the measured object receives the client request until the measured object returns all responses to the client. |
| Load Balancer | Common Metrics | Backend Server Reset Count | huawei.m1e_server_rps | Counts the count of reset (RST) packets sent from the backend server to the client. These reset packets are generated by the backend server and then forwarded by the load balancer. Supported protocol: TCP |
| Load Balancer | Common Metrics | Load Balancer Reset Count | huawei.m1f_lvs_rps | Counts the count of reset (RST) packets generated by the load balancer. |
| Load Balancer | Common Metrics | Active Connections | huawei.m2_act_conn | The number of all TCP connections in ESTABLISHED state from the measured object to the backend servers. |
| Load Balancer | Common Metrics | Client Reset Count | huawei.m21_client_rps | Counts the count of reset (RST) packets sent from the client to the backend servers. These reset packets are generated by the client and then forwarded by the load balancer. |
| Load Balancer | Common Metrics | Inbound Bandwidth | huawei.m22_in_bandwidth | Counts the current inbound bandwidth of the measured object. |
| Load Balancer | Common Metrics | Outbound Bandwidth | huawei.m23_out_bandwidth | Counts the current outbound bandwidth of the measured object. |
| Load Balancer | Common Metrics | Layer 7 Request Bandwidth | huawei.m24_l7_req_bps | Counts the request reception bandwidth of the host group during the statistical period. |
| Load Balancer | Common Metrics | Inactive Connections | huawei.m3_inact_conn | The number of all TCP and UDP connections in states other than ESTABLISHED from the measured object to all backend servers. |
| Load Balancer | Common Metrics | New Connections | huawei.m4_ncps | The number of new connections established per second from the client to the measured object. |
| Load Balancer | Common Metrics | Inbound Packets | huawei.m5_in_pps | The number of data packets received per second by the measured object. |
| Load Balancer | Common Metrics | Outbound Packets | huawei.m6_out_pps | The number of data packets sent per second by the measured object. |
| Load Balancer | Common Metrics | Network Inbound Rate | huawei.m7_in_bps | The traffic consumed by external access to the measured object. |
| Load Balancer | Common Metrics | Network Outbound Rate | huawei.m8_out_bps | The traffic consumed by the measured object accessing external sources. |
| Load Balancer | Common Metrics | Abnormal Host Count | huawei.m9_abnormal_servers | Health check counts the number of abnormal backend hosts for the monitored object. |
| Load Balancer | Common Metrics | Normal Host Count | huawei.ma_normal_servers | Health check counts the number of normal backend hosts for the monitored object. |
| Load Balancer | Common Metrics | Layer 7 Query Rate | huawei.mb_l7_qps | Counts the current Layer 7 query rate of the measured object. |
| Load Balancer | Common Metrics | Layer 7 Protocol Return Code (2XX) | huawei.mc_l7_http_2xx | Counts the current number of Layer 7 2XX series status response codes for the measured object. |
| Load Balancer | Common Metrics | Layer 7 Protocol Return Code (3XX) | huawei.md_l7_http_3xx | Counts the current number of Layer 7 3XX series status response codes for the measured object. |
| Load Balancer | Common Metrics | Layer 7 Protocol Return Code (4XX) | huawei.me_l7_http_4xx | Counts the current number of Layer 7 4XX series status response codes for the measured object. |
| Load Balancer | Common Metrics | Layer 7 Protocol Return Code (5XX) | huawei.mf_l7_http_5xx | Counts the current number of Layer 7 5XX series status response codes for the measured object. |