Distributed Tracing
Distributed Tracing is used to record detailed information about all business systems, applications, and related service components that a request passes through and accesses during a single request process, including business data, performance data, code stacks, detailed operations of service components, as well as error and exception information, etc. When the response time of a request exceeds a predefined traces threshold, the system will record the process of that request in detail.
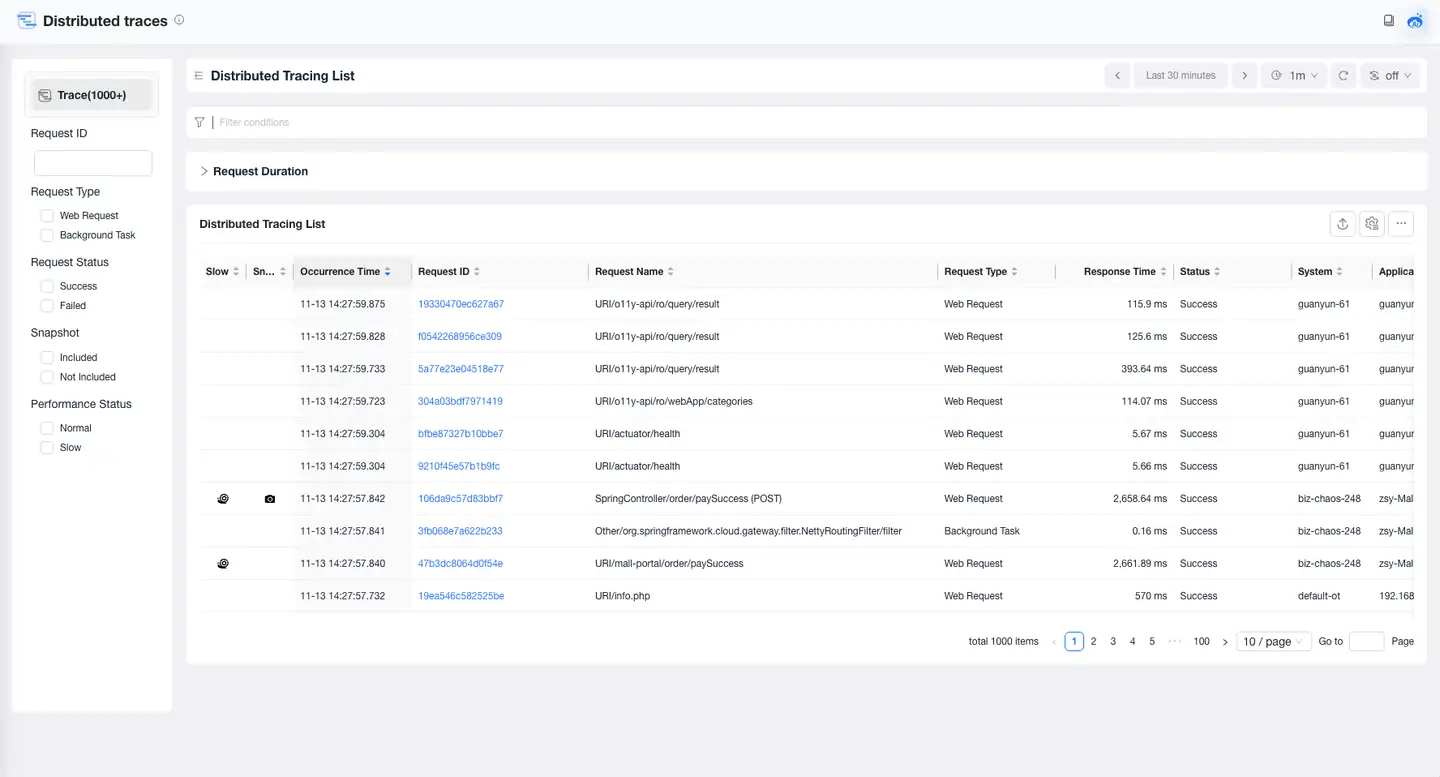
Trace List
The trace list displays monitored request traces, including Tingyun-monitored traces and integrated third-party traces. Users can filter based on query conditions, including business system, application name, request type, request status, user identifier, request ID, request name, response time, etc. For data items, request traces that match parameter names and values can be queried with multiple parameter conditions.
Trace Details
Users can click the Request ID to enter the details page of this request trace, which displays complete full-stack traces information for this request.
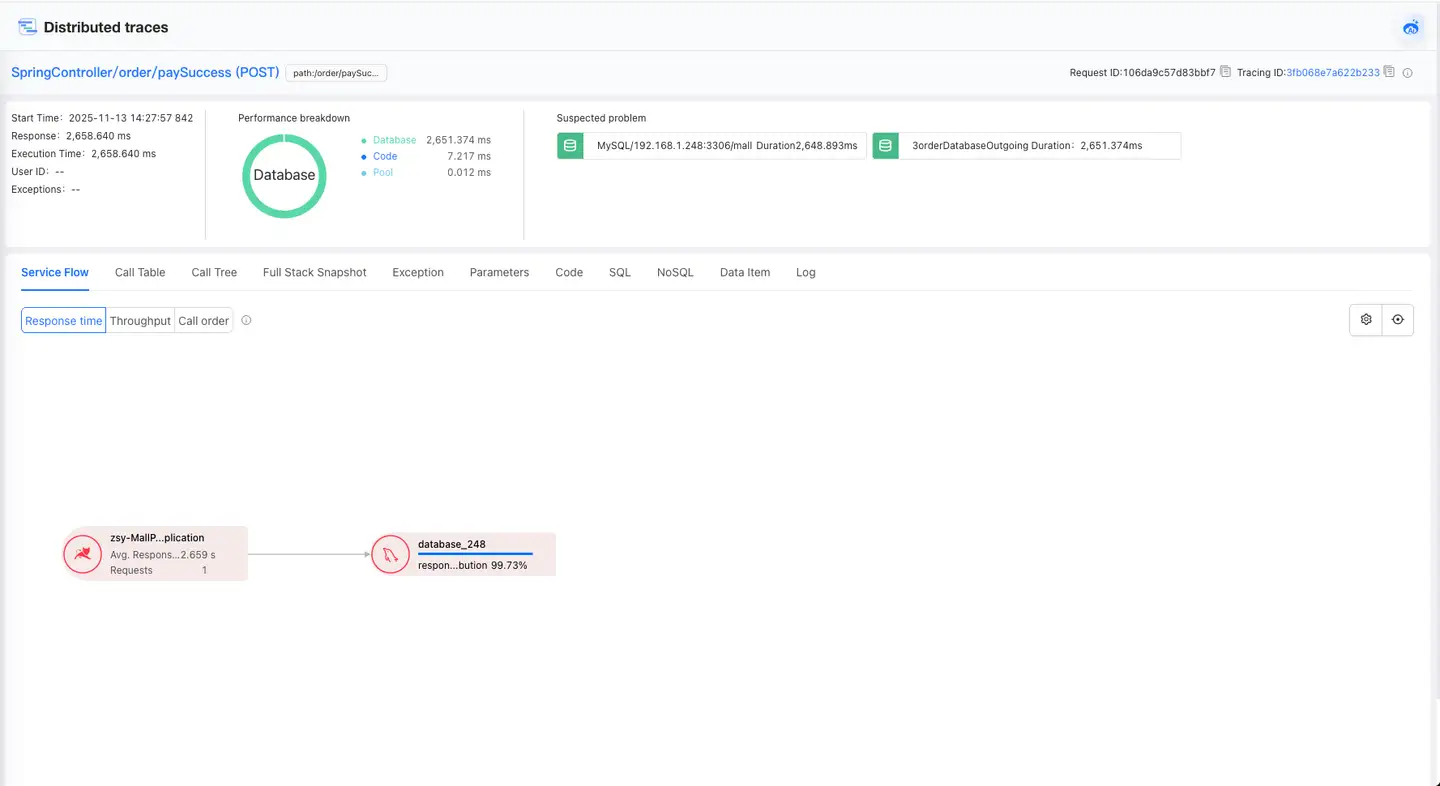
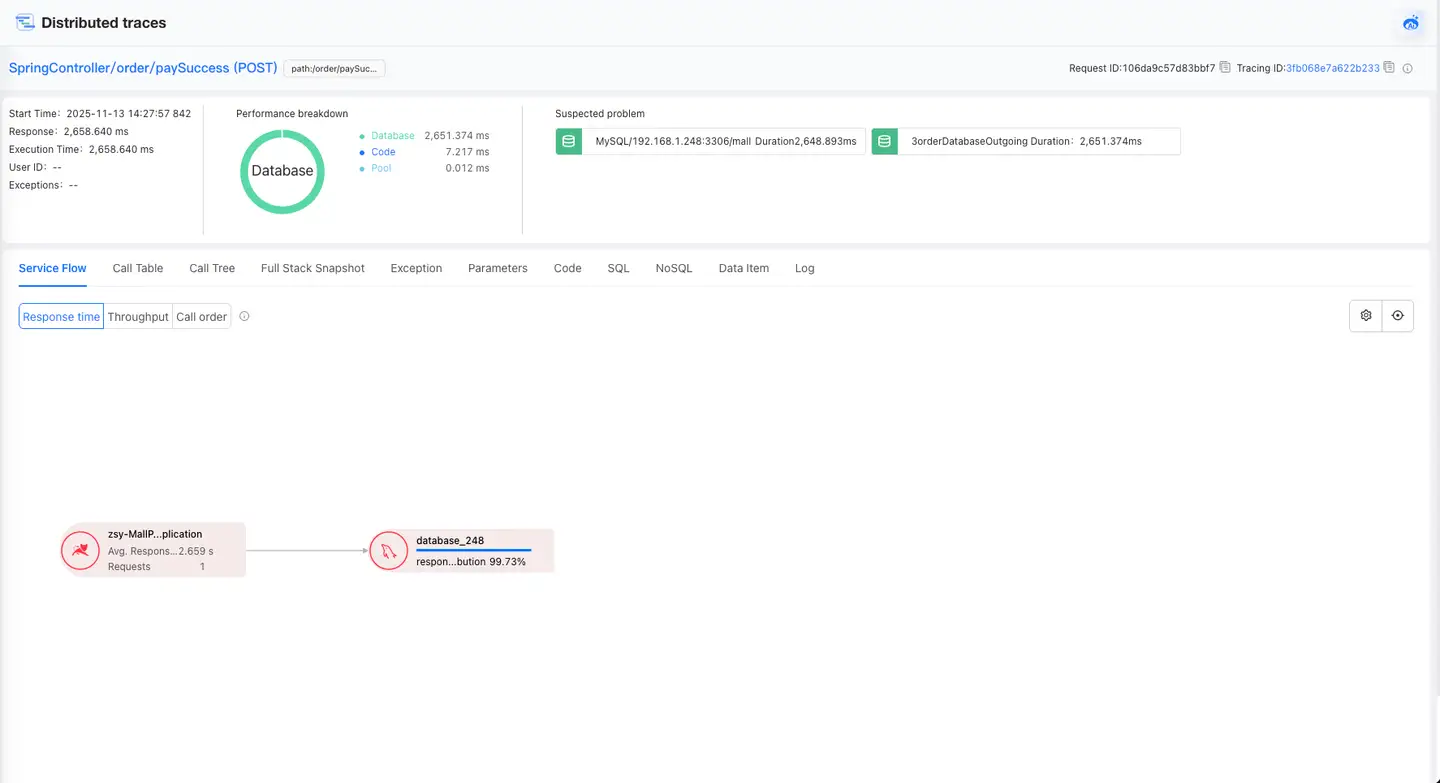
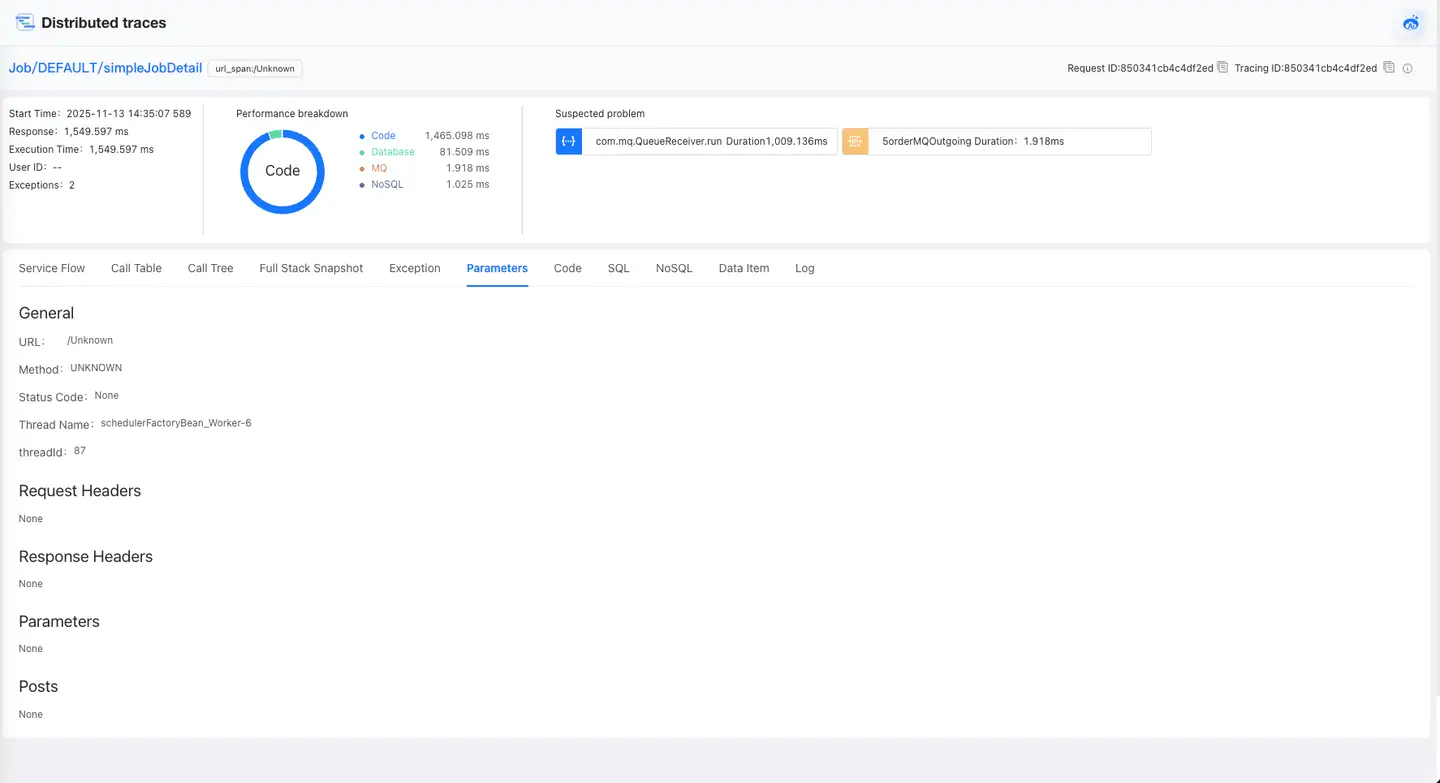
Trace Overview
Displays overview information for this trace, including:
-
Associated Application: The entry application name for this trace.
-
Request Name: The name of the request for this trace.
-
Request ID: The ID of this request.
-
Trace ID: The unique ID of this trace.
-
Exception Count: The number of exceptions that occurred during this trace, including exceptions and errors.
-
Start Time: The starting point of this request trace, accurate to microseconds.
-
Response Time: The total execution time of this request, accurate to microseconds.
-
Execution Time: The code execution time, which is the time from when the request enters the Web container to when the interface execution ends. If there are multiple threads, it is the time from when the thread starts running to when the last thread ends, not the sum of all asynchronous executions.
-
User Identifier: User identification information collected during the execution of this request.
-
Click the share icon in the upper right corner of the page to copy the URL link of the current trace details.
Performance Breakdown Chart
Displays the performance breakdown of this trace in the form of a pie chart, including the performance proportions of six parts: code execution, database access, NoSQL access, MQ access, external calls (i.e., external services), and connection pool acquisition time. External services refer to external applications called by the application through protocols such as HTTP, and display relevant performance data from the perspective of external services used by the current application.
Problems
Problems automatically analyze the slowest code segments, the most frequently called components, and the most severe error information during the execution of this request.
Topology
The topology diagram illustrates the logical call relationships of this request trace. The topology displays all applications (including those in the entry business systems and other related business systems), service components, and external services involved in the current trace, as well as their calling relationships and process. The applications, service components, and external services traversed and accessed during the request trace are displayed in the form of icons, while the calling relationships and processes are shown through lines and text on these lines.
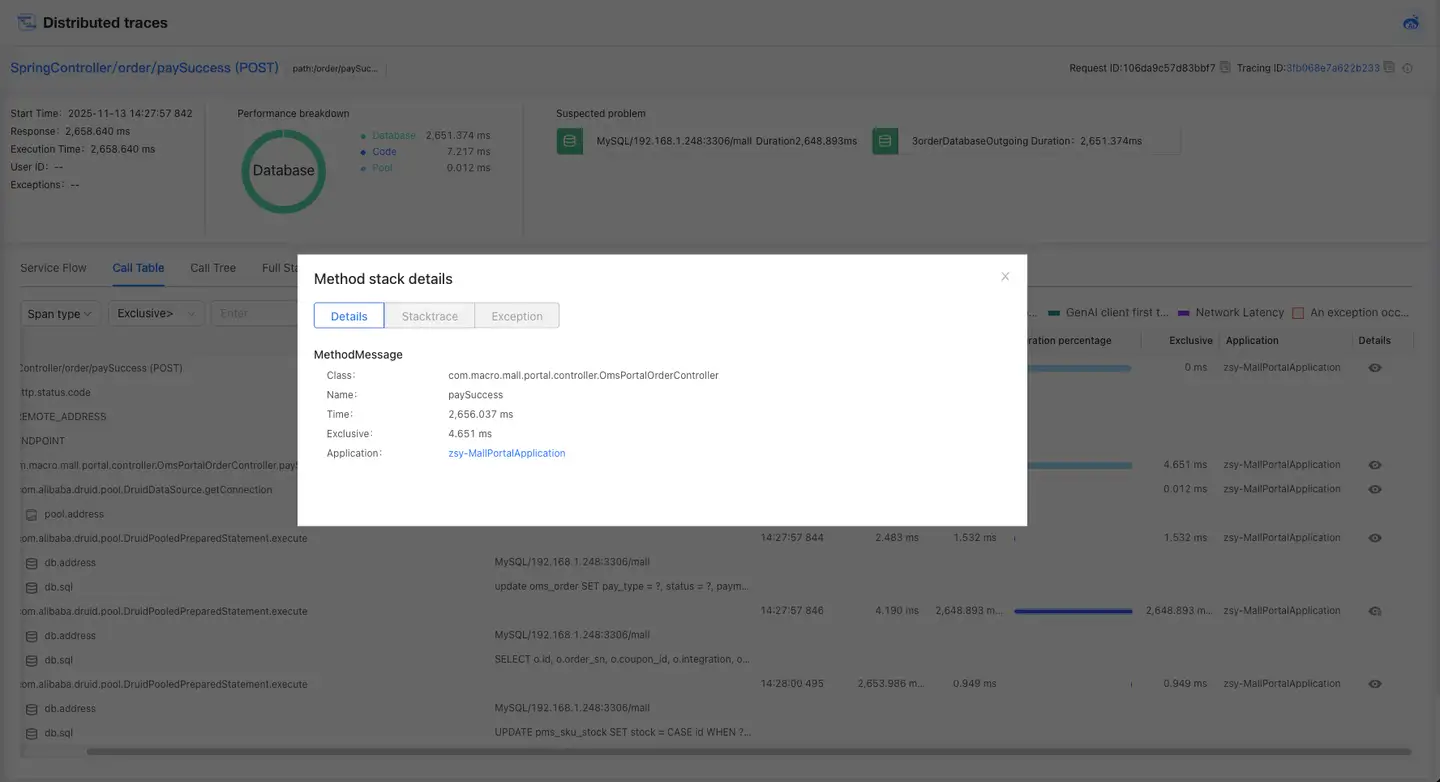
Call Table
The Call Table displays the code calling process of this request in the form of a list.
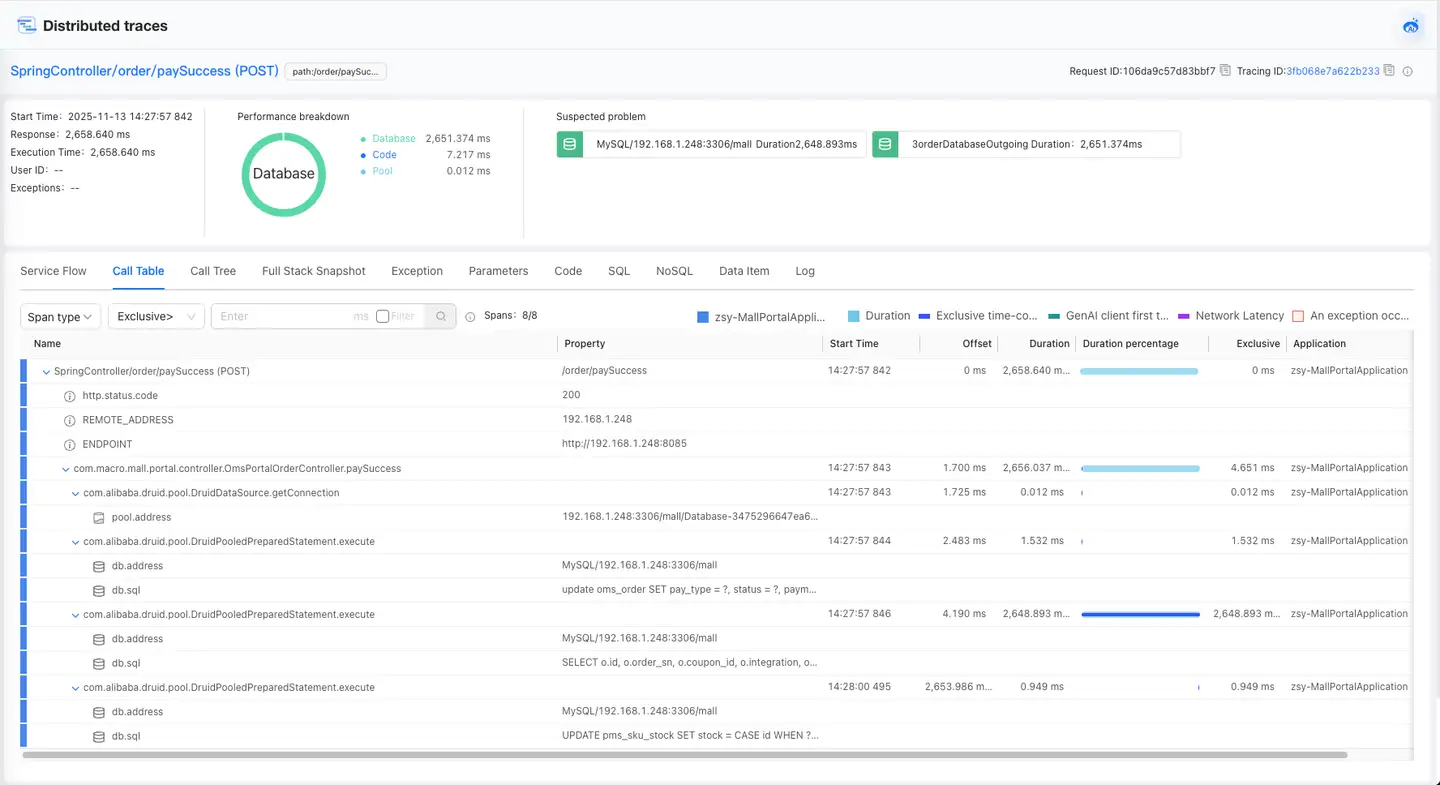
-
Method: Displays the calling relationship of methods. In calls at the same level, if a method is called multiple times, the method will be displayed in a merged form, with the number of calls shown before the method, separated by an asterisk (*).
-
Attributes: Displays detailed information about the execution of the method, such as the specific request address, HTTP status code, parameter values of the method, database operations, database address, etc.
-
Start Time: Displays the time when the code segment starts executing, with the last three digits being milliseconds.
-
Offset: Displays the time offset of the code segment relative to the request start time.
-
Duration: The total time of the code segment's exclusive time, network time, and exception time.
-
Duration Percentage: Displays the composition of the code segment's duration in the form of a bar chart, including exclusive time, network time, and exception time. Different colors represent different parts of the duration. Please refer to the legend in the upper right corner of the table for details.
-
Exclusive Time: The execution time of the code segment itself.
-
Class Name: The class to which the code segment belongs.
-
Application: The application to which the code segment belongs.
-
Details: Click the details icon to view the method stack details.
Call Tree
The Call Tree page includes four areas: A, B, C, and D.
- Area A: Call stack
- Area B: Call sequence diagram
- Area C: Span details
- Area D: Search
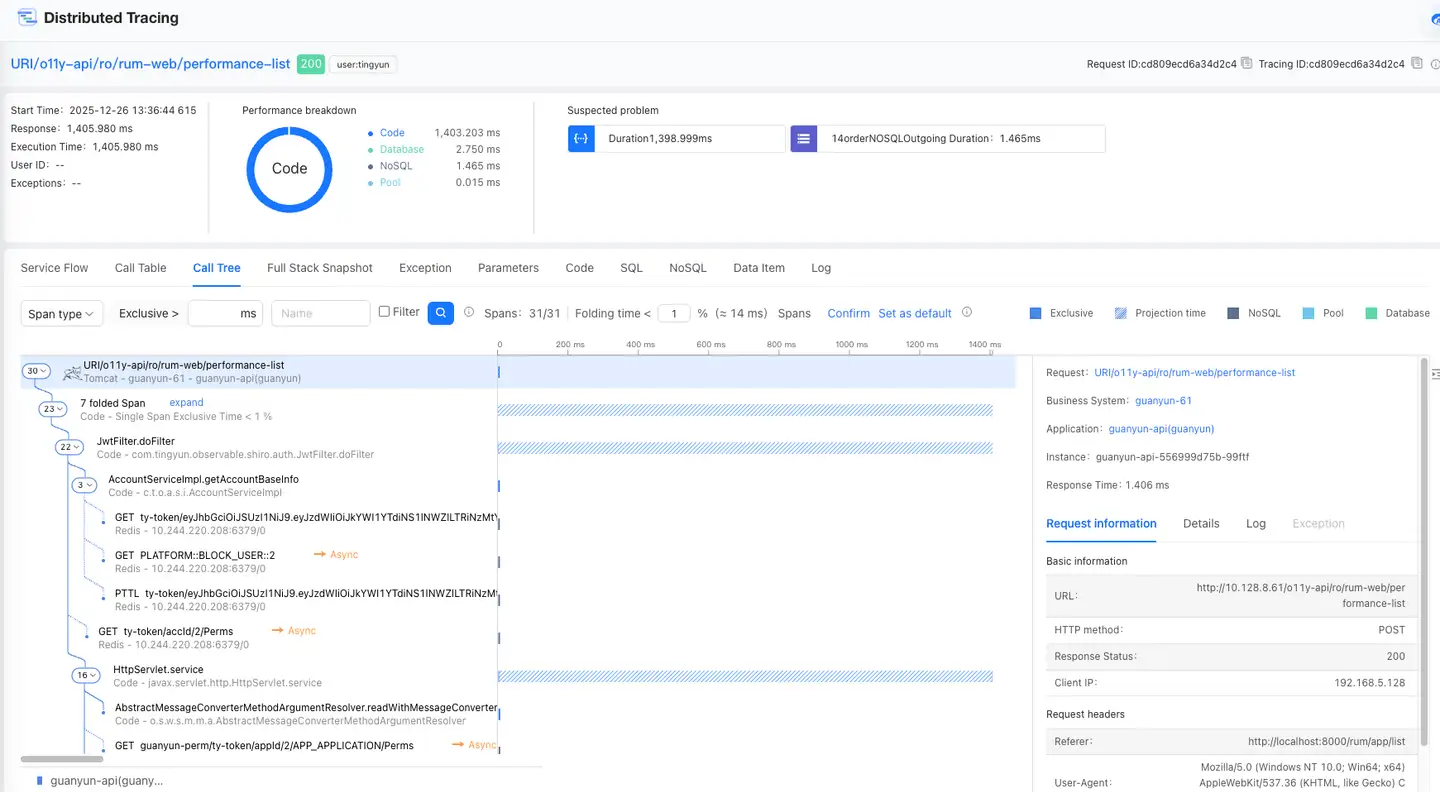
Call Stack
The call tree in Area A displays the code invocation process of this trace.
-
Method call relationships are shown as connected lines, with different applications distinguished by line colors. Asynchronous calls are indicated by dashed lines.
-
The legend for each application is displayed at the bottom of the call stack.
-
The entry is a virtual node (the first Span), which shows request information. The first line shows the request name, the second line shows the container, business system, and application. The container icon appears before the request information. If the container type is not collected, a language icon is displayed instead.
-
In addition to the virtual node at the entry, the following Span information is shown:
- Code: The first line displays className.methodName (className is the last segment), and the second line displays type (metric_scope)-packageName.className.
- Database: The first line displays SQL statement keywords, and the second line displays component type-component subtype/instance.
- NoSQL: The first line displays operation, key, and the second line displays component subtype-instance.
- MQ: The first line displays Producer/Consumer, topic, and the second line displays component type-component subtype/instance.
- External: The first line displays URL, and the second line displays component type-className.methodName.
- Pool: The first line displays GetConnection, connection pool name, and the second line displays component type-instance.
- GenAI: Displays the URL and model called by AI, showing AI type, model, tokens, and other relevant information in the form of tags.
- Asynchronous: Asynchronous call relationships are identified by dashed lines. The first line displays className.methodName, the second line displays language type-packageName.className, and an asynchronous icon is displayed on the right.
-
The number before a Span indicates the number of all methods called by the current method. The number is not displayed before the last called method.
-
When multiple same-level methods, components (same type, instance, operation) are called consecutively, the Spans will be displayed in a merged form. "N×Span Name" indicates the number of times the method was called. The start time and offset are the start time of the first method merged, while the response time and exclusive time are the sum of the exclusive times of all methods.
The following situations are not merged:
-
Exceptions are not merged
-
Cross-application nodes are not merged
-
Asynchronous nodes are not merged
-
-
When an exception occurs, the method is displayed in red. Click the Span where an exception occurred, and the Exception tab is displayed by default in the details on the right.
Call Sequence Diagram
Area B displays the call sequence of the code in the form of a bar chart. Click or hover the mouse over the bar chart to view the Span name (className.methodName), start time, offset (the time offset of the Span relative to the request start time point), response time, exclusive time (the execution time of the Span itself), exclusive time proportion, and other information during the execution process of this trace request.
Span Details
Click a Span, and Area C will display the details, Stacktrace, and exception information (if any) of that Span. Click the icon on the right to hide Area C, and click again to restore the display. Click the icon in the red box after the class name to view the decompiled source code, which can be downloaded. Viewing the source code requires enabling the source code acquisition feature.
When the clicked Span is a connection pool call, detailed metrics of the corresponding connection pool can be viewed in the details.
-
Pool name: The name of the connection pool, which is the unique identifier of the connection pool. It is usually composed of the connection pool framework name (C3P0, Druid, etc.) + a random code.
-
Max Active: The maximum number of active connections in the initial configuration of the connection pool registered when the application starts.
-
Init Active: The number of active connections in the initial configuration of the connection pool registered when the application starts, which is also the minimum number of connections.
-
Max Idle: The maximum number of idle connections in the initial configuration of the connection pool registered when the application starts. Some frameworks do not require this setting, in which case Max Idle equals Max Active.
-
Min Idle: The minimum number of idle connections in the initial configuration of the connection pool registered when the application starts.
-
Current Wait Count: The current number of threads waiting to acquire a connection.
Search
In Area D, you can enter an exclusive time or method name to filter Spans. After directly clicking the search button, the search results will be highlighted. if you check the Filter checkbox and then click the search button, only Spans that meet the conditions will be displayed below.
Multiple consecutive methods with exclusive time less than 1% are collapsed by default, but this does not include External, Database, MQP, MQC, NoSQL, and error Spans. This time can be set, and after modification, click OK to take effect, or click Set as Default to restore the default value. After collapsing, the first line displays the number of collapsed methods, and the second line displays the exclusive time proportion of a single method < 1% (or the set value).
The legend for the bar chart is displayed on the right.

-
Exclusive Time: The call time of the Span itself.
-
Projection Time: The time spent calling other services.
-
Pool: The time to acquire a connection from the connection pool.
-
Network: Network time.
-
External: External service call time.
-
Database: Database call time.
-
NoSQL: NoSQL call time.
-
MQ: MQ call time.
Full-Stack Snapshot
The full-stack snapshot page displays the thread call information of the current request. This page is divided into 5 functional areas, including thread call sequence diagram, thread information, legend and timeline, search area, and data view.
1: Call sequence diagram.
2: Thread information.
3: Legend and timeline.
4: Search area.
5: Data view.
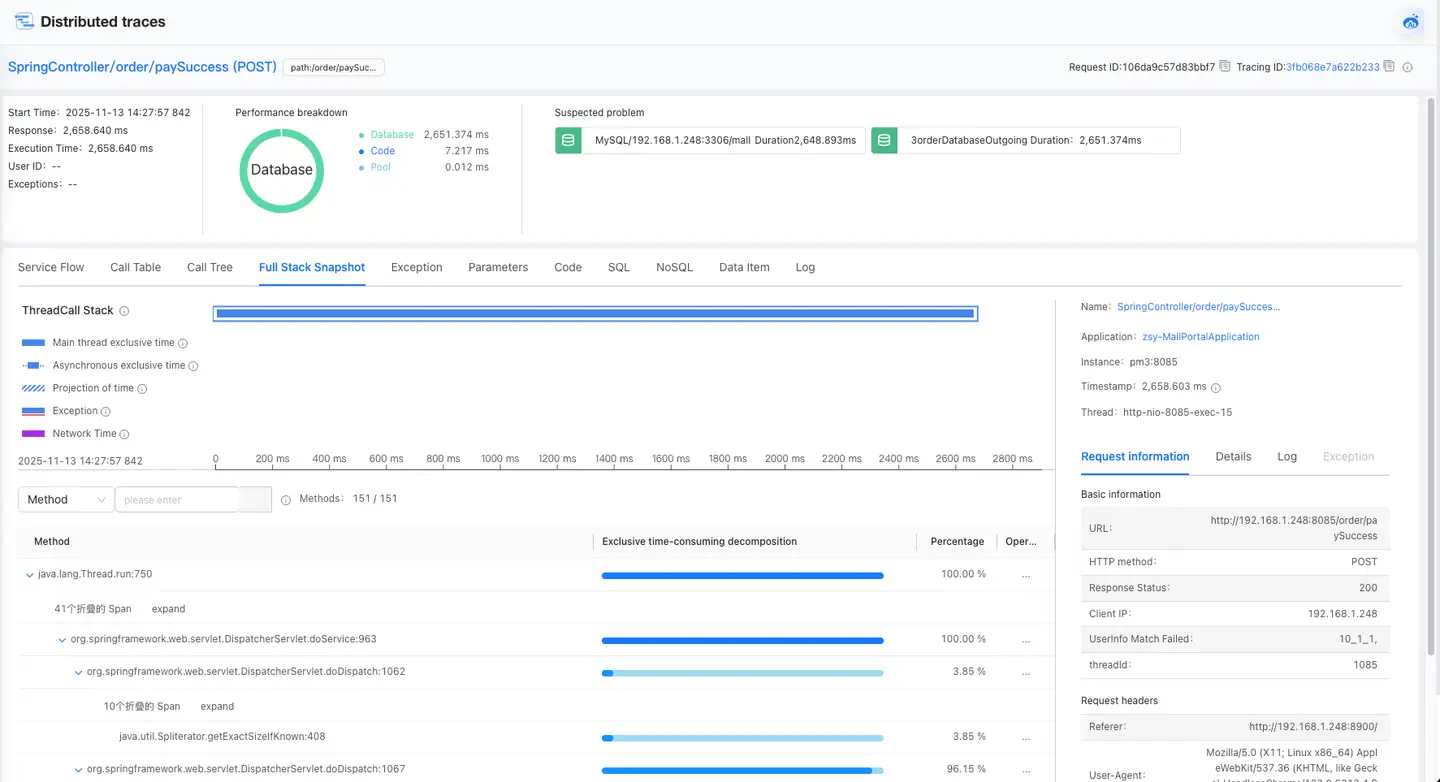
Call Sequence Diagram
The thread call sequence diagram displays the call sequence of all threads in all services in the complete call chain of this request. The explanation of the diagram is as follows:
-
Each row represents a thread in a service, which can be a synchronous thread or an asynchronous thread.
-
The solid line block represents the call time of itself, and the dashed line block represents the projection time, which is the time spent calling other services. It represents the exclusive time of asynchronous threads.
-
Click a thread to display the snapshot data of that thread below. If there is no data under a thread, it may be because the execution time of the thread is less than the time interval of snapshot collection.
-
Hover the mouse over a thread to view the time information and summary information of the thread.
-
Network time 1 = start time of the lower-level method - start time of the upper-level method, network time 2 = end time of the upper-level method - end time of the lower-level method.
Thread Information
The thread information area displays the summary information, request information, details, and exceptions of the currently selected thread. Asynchronous threads only display details and exceptions.
-
Summary Information: Displays the request name, application, application instance, exclusive time, and thread name. Asynchronous threads are labeled as "Async". You can click the request name to navigate to the request details page, click the application name to navigate to the application details page, or click the instance name to navigate to the instance details page.
-
Request Information: Displays URL, HTTP method, response status, client IP, thread Id, request headers, response headers, request parameters, posts.
-
Details: Displays time information, chain information, and environment information. Span ID is action_id, and Parent Span ID is the action_id of the caller.
-
Exceptions: Displays the errors and exceptions of the current thread. The first exception is expanded by default. The exceptions of the main thread display all exceptions of the main thread and asynchronous threads. The exceptions of asynchronous threads only display the exceptions of the current thread.
Legend and Timeline
The dark line block in the legend represents the call time of itself, i.e., the exclusive time, while the light line block represents the projection time, i.e., the time spent calling other services. The union of all blocks represents the total time, and the red line block indicates that an exception occurred in the thread.
Search
Methods under a thread support searching by method name and time ratio. Switch in the drop-down list. When Method is selected, fuzzy search is supported. When Proportion is selected, methods with a proportion greater than the specified value will appear in the search results.
Methods displays the number of methods in the search results / total number of methods.
Method time supports display by total method time and exclusive time, click the tab on the right to switch.
Data View
-
The Method column displays the merged method call stack, in the format: packageName.className.methodName:lineNumber. When the exclusive time proportion of multiple consecutive (3 or more) method calls is
<0.5%, they will be displayed in a merged form. The following cases are exceptions:- The root node is not merged
- The last method is not merged
- When there are multiple children, the method is not merged
-
Proportion: Method exclusive time / total thread time, rounded to 2 decimal places.
-
Click the icon in the Operation column and select Custom Instrumentation to quickly add this method to monitoring.
-
Click the icon in the Operation column and select View Source Code to view the source code of the application. This option is only displayed after enabling the source code acquisition feature in the global configuration.
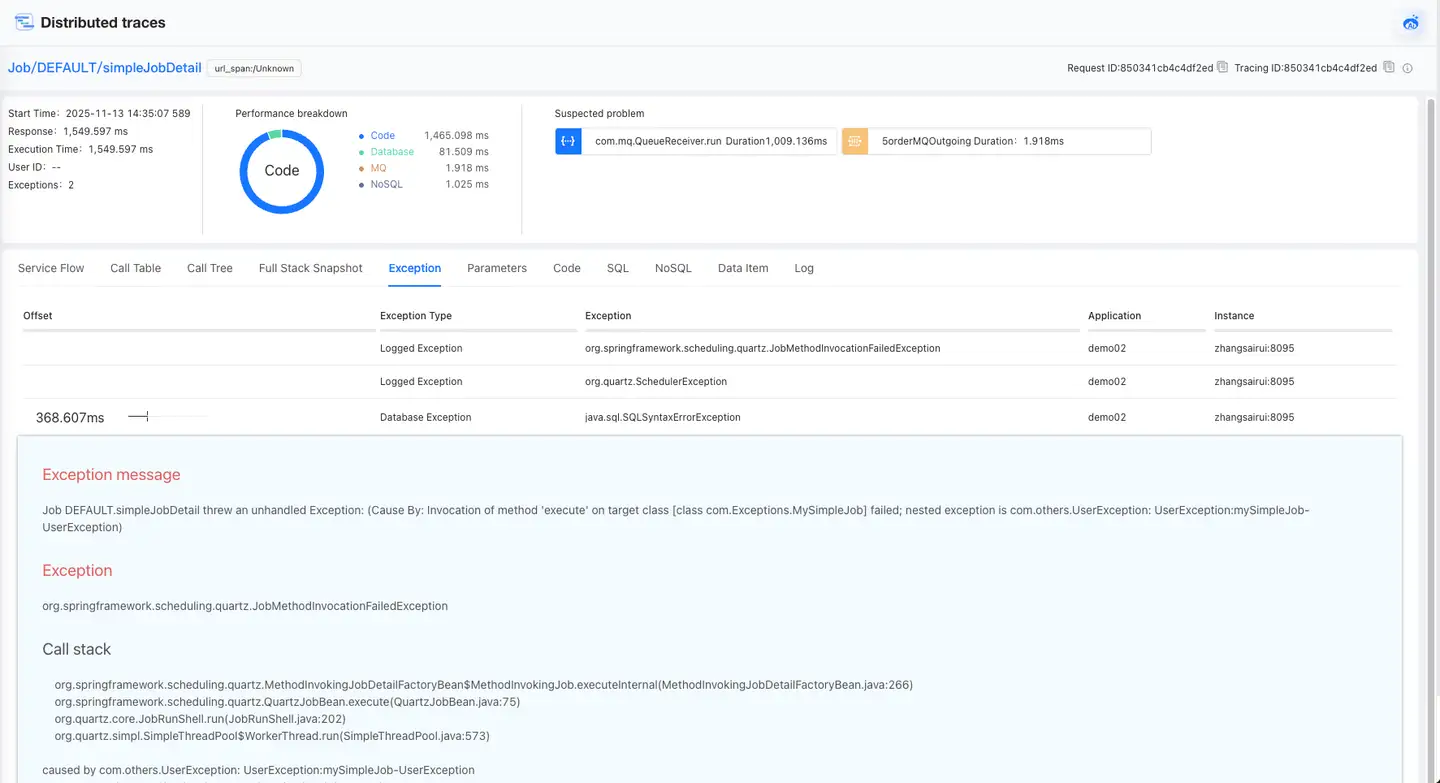
Exceptions
Provides a centralized view of all exceptions captured during the current request trace. These exceptions are listed in chronological order of occurrence. The list includes:
- Offset: The time difference between when the exception occurred and the start time of the request.
- Exception Type: Exception types include code exceptions, database exceptions, external service exceptions, and many other types.
- Exception Name: The name of the exception, such as Java exception class names, status code exceptions like 404, and database exceptions.
- Associated Application: The name of the application where the exception occurred.
- Associated Instance: The name of the application instance where the exception occurred.
Click an entry in the exception list to view detailed information about the corresponding exception in the content area below, including exception or error information, error type, and error stack.
Parameter Information
Displays parameters collected from HTTP request and response headers in this request trace, as well as user-defined parameters collected from method parameters or return values.
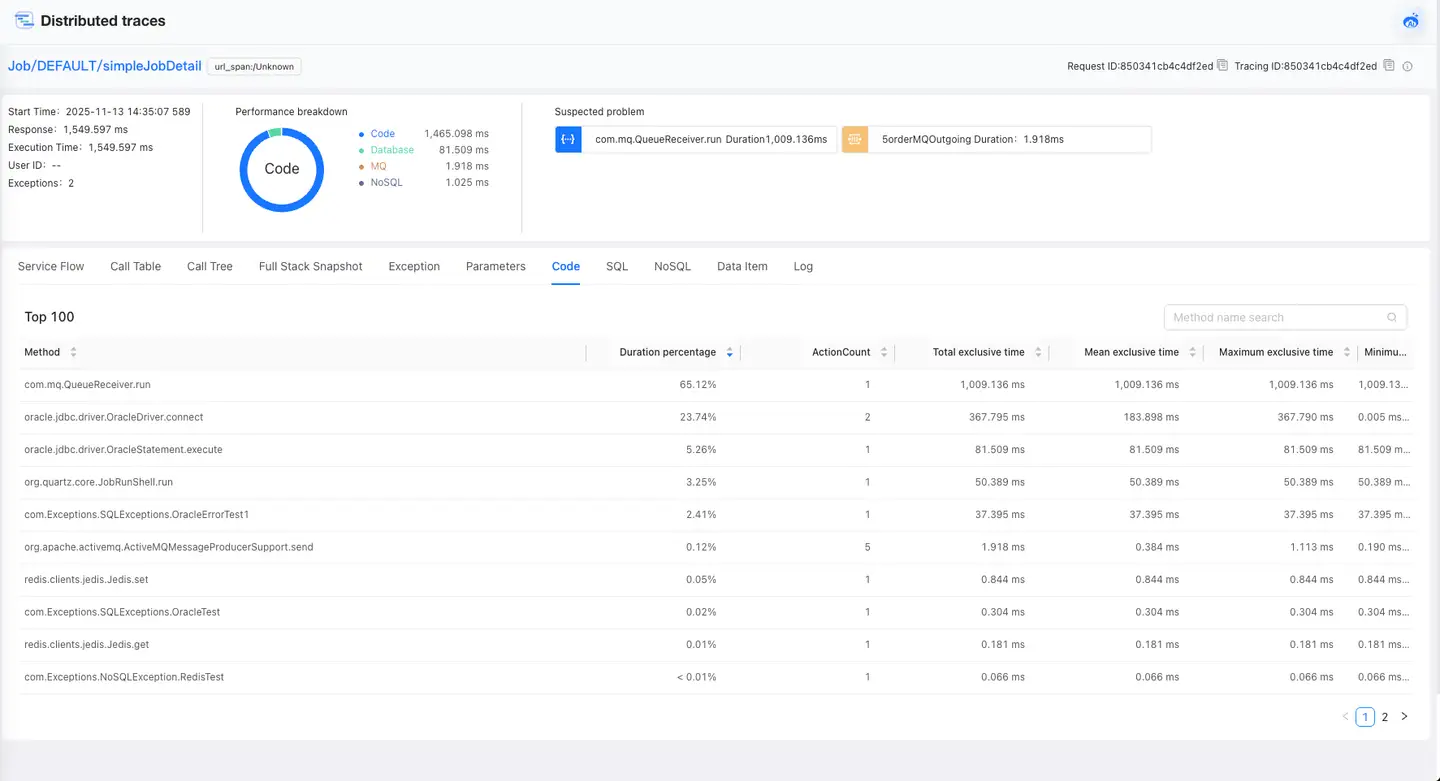
Code Statistics
The Code Statistics page shows the top 100 methods by time consumption percentage for this request, sorted in descending order by default. It supports sorting by method name (alphabetical order), time percentage, call count, total exclusive time, average exclusive time, and maximum exclusive time in both ascending and descending orders.
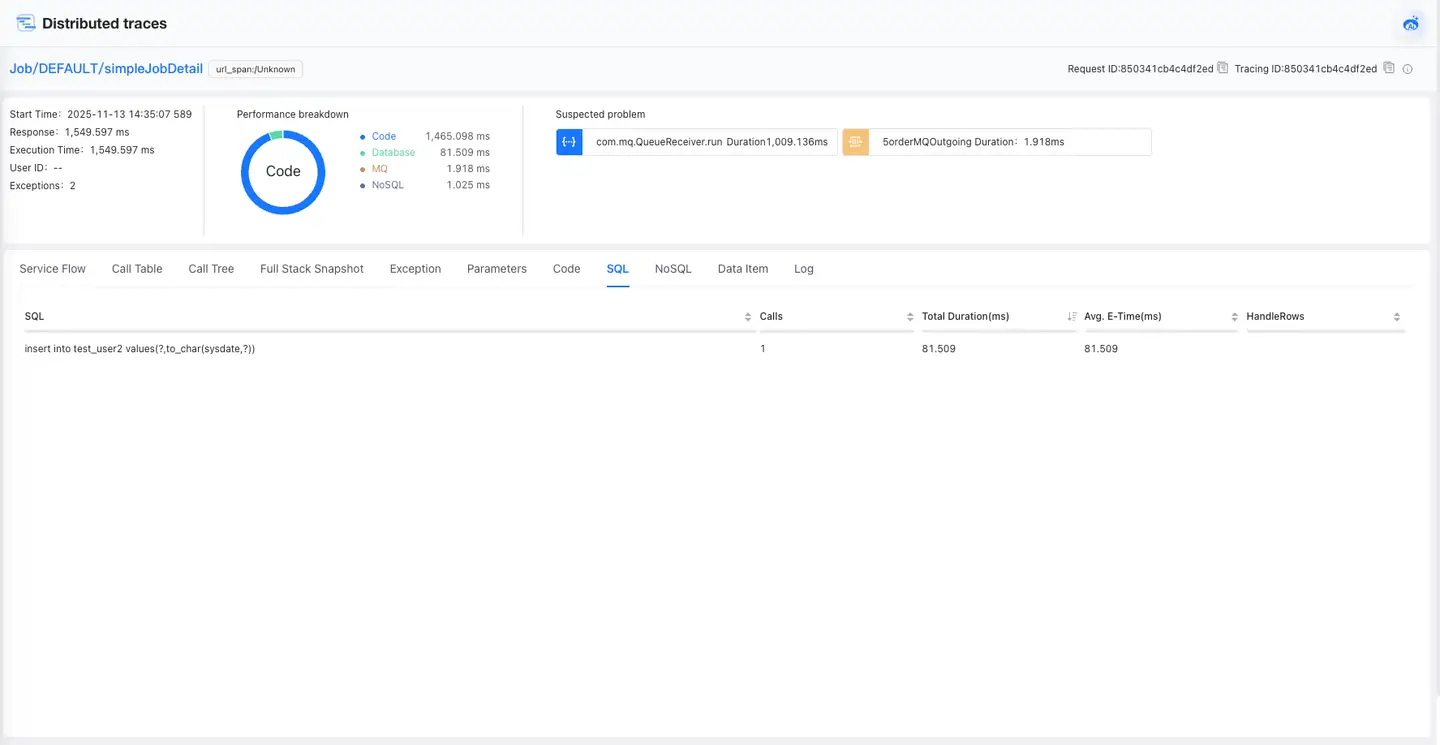
SQL Analysis
Displays a list of all SQL statements for this request, including detailed SQL statements, call count, total time, average execution time, and the line number of the code that calls the SQL statement. Supports sorting functionality.
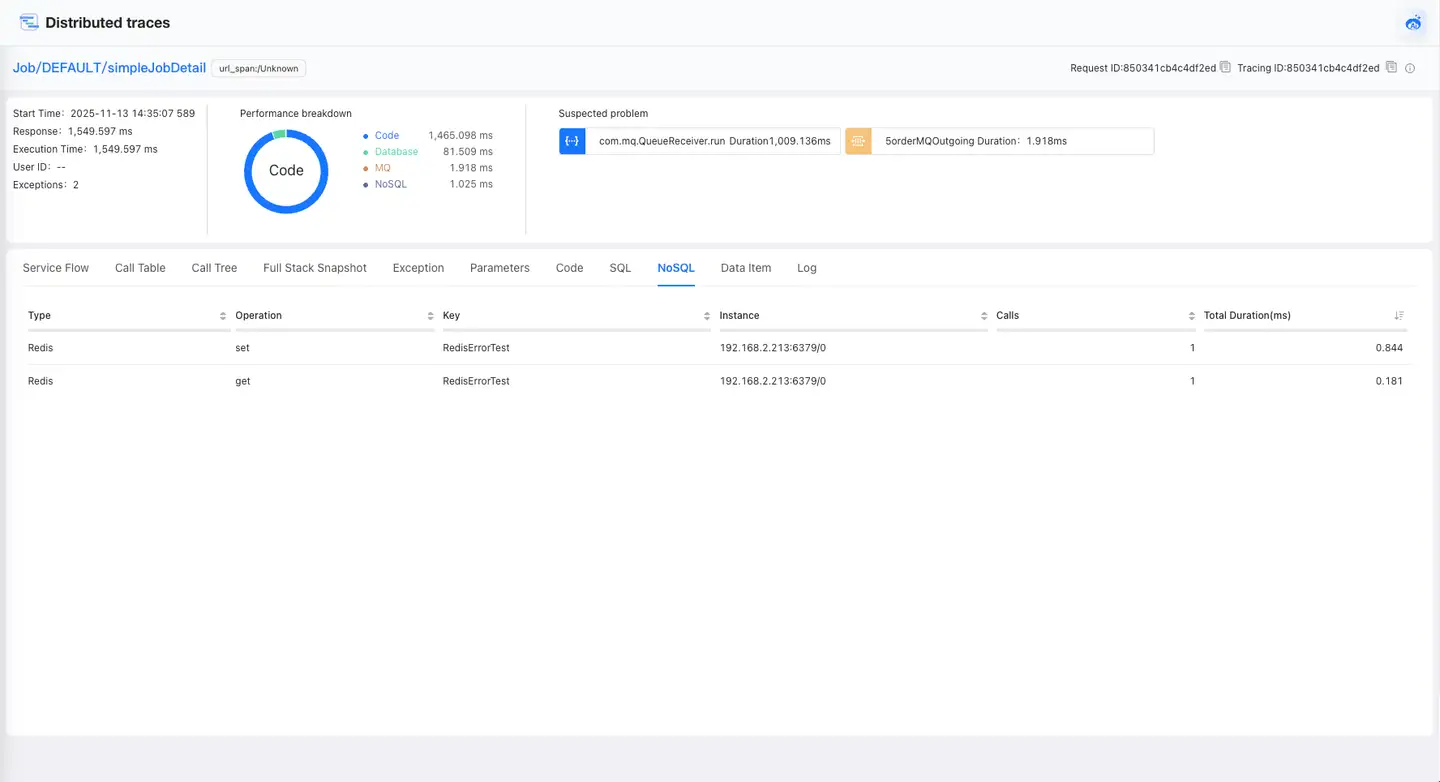
NoSQL Analysis
Displays a list of all NoSQL operations for this request, including NoSQL type, NoSQL operation, Key, NoSQL instance, call count, and total time. Supports sorting functionality.
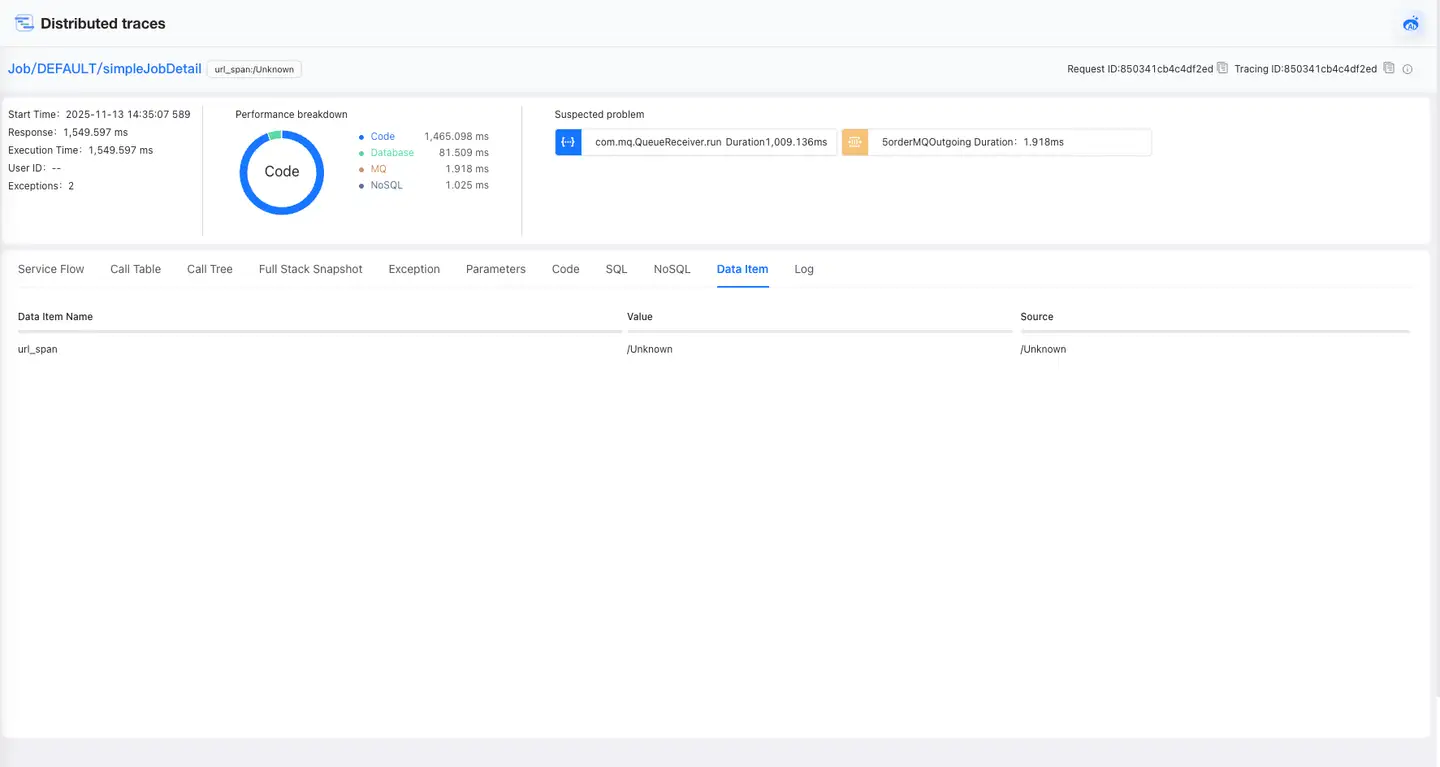
Data Items
Displays the data item information obtained in this request trace, including data item name, Value, and data item source.
Logs
The Logs page displays log entries recorded before and after the traced request occurred.
-
Allows you to filter logs specifically from a selected application. By default, logs from all applications are shown.
-
Enables you to locate the complete logs for a specific request using its Trace ID. By default, logs are filtered to show the complete set for the current trace ID.
-
Supports viewing logs within customizable time windows around the trace event: 15 minutes before/after, 30 minutes before/after, 1 hour before/after, 2 hours before/after, 8 hours before/after, and 24 hours before/after.
-
Supports searching logs by entering log keywords.