Requests
The Requests module provides comprehensive analysis of all monitored requests from metrics, traces, relationships, problems, and other aspects. Requests are divided into web requests and background tasks.
- Web Requests: Network requests initiated from outside the program and transmitted using the TCP/IP protocol, including transactions and service interfaces.
- Background Tasks: Programs that run on a scheduled basis and are not initiated by user interaction, such as scheduled batch processing tasks.
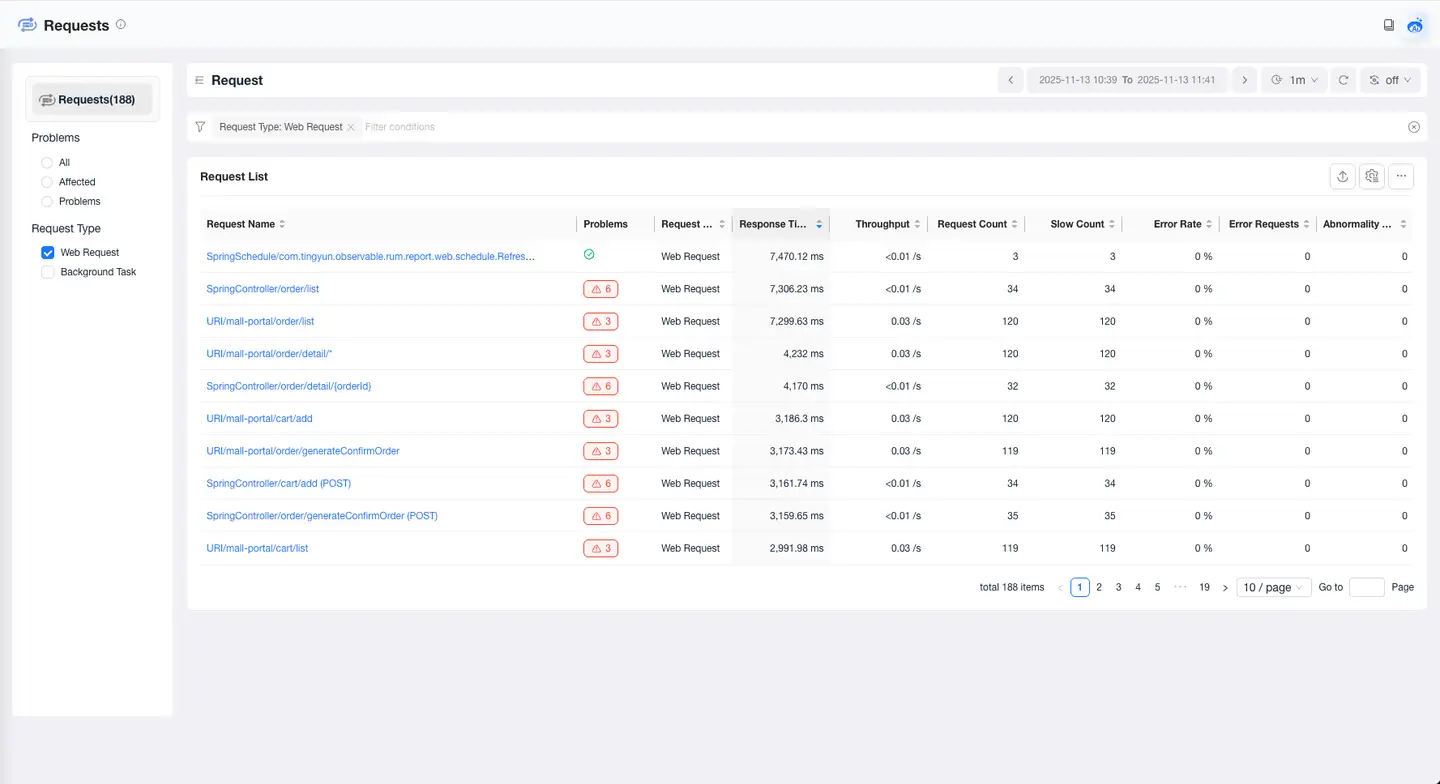
Request List
The Requests page displays all monitored requests, including requests with Tingyun request & microservice Agents installed, and requests monitored by integrated third-party Agents. The list items include request name, request type, associated application, median response time, throughput, request count, error rate, error count, and other information.
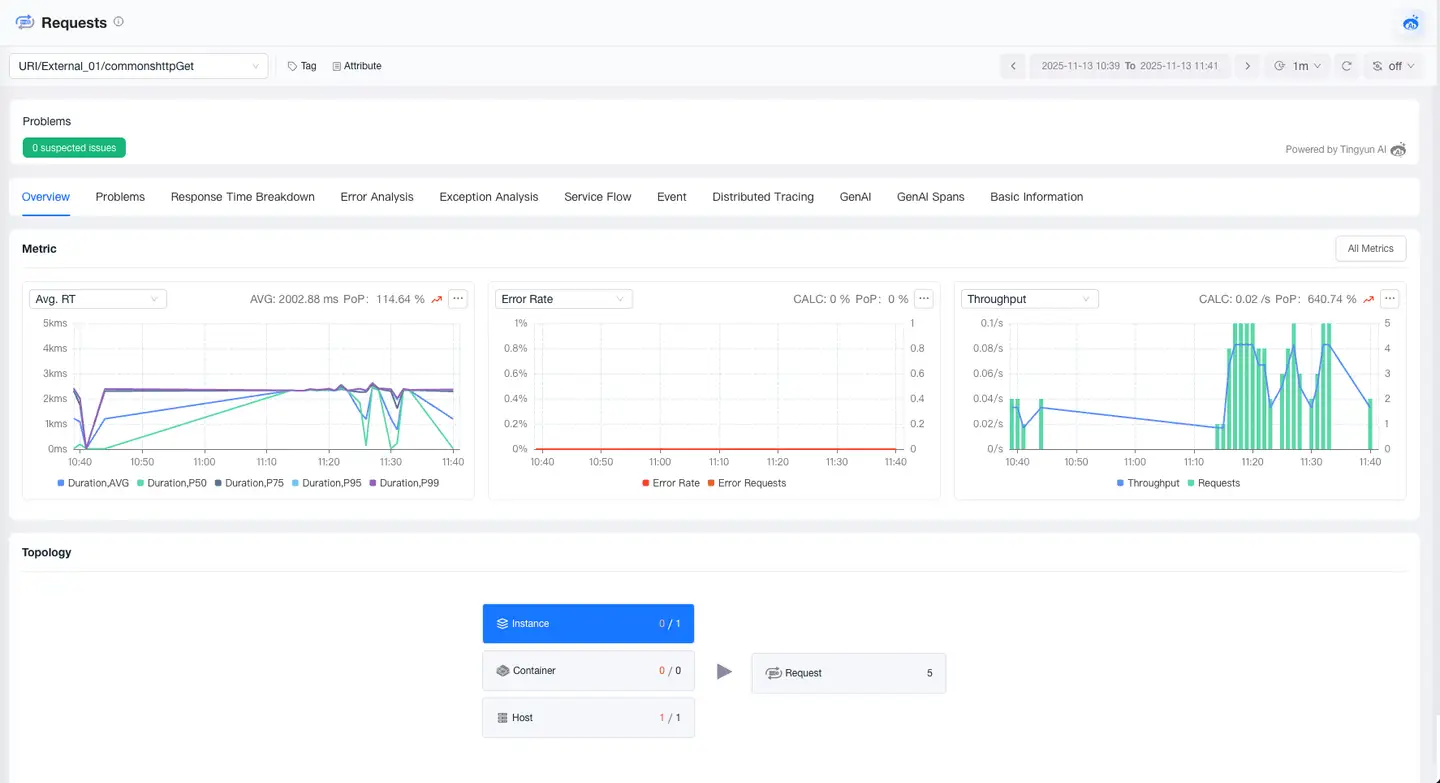
Request Overview
The Request Overview module provides you with a comprehensive performance view of requests, including tags, attributes, problems, metrics, and relationships. Through this module, you can quickly understand the performance trends of requests and the upstream and downstream call relationships, helping you quickly locate problems and optimize request performance.
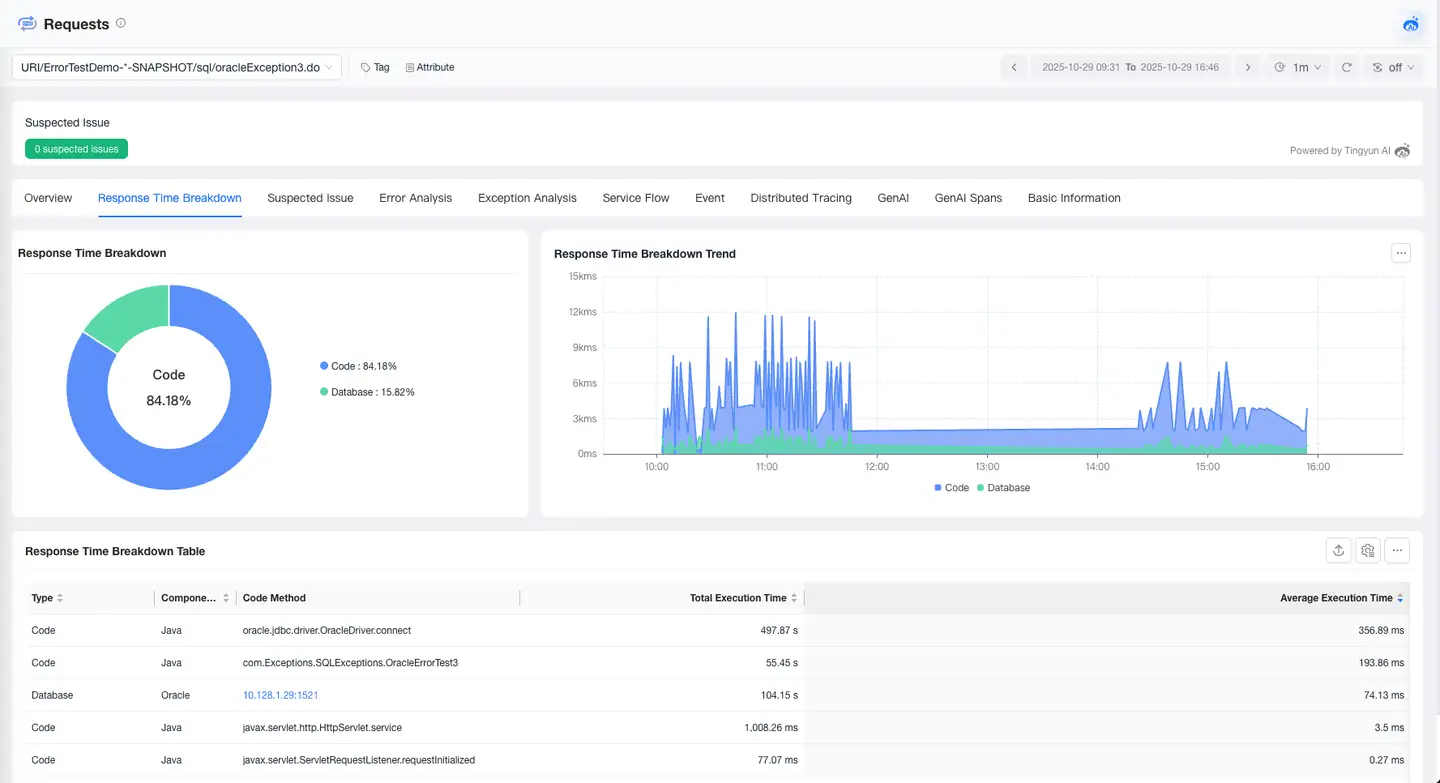
Response Time Breakdown
The Response Time Breakdown feature helps you deeply analyze the composition of request response time, accurately pinpointing performance bottlenecks. It supports breaking down response time from the dimensions of Code, Database, MQ, External Services, and GenAI, and provides detailed analysis capabilities to help you quickly optimize performance bottlenecks.
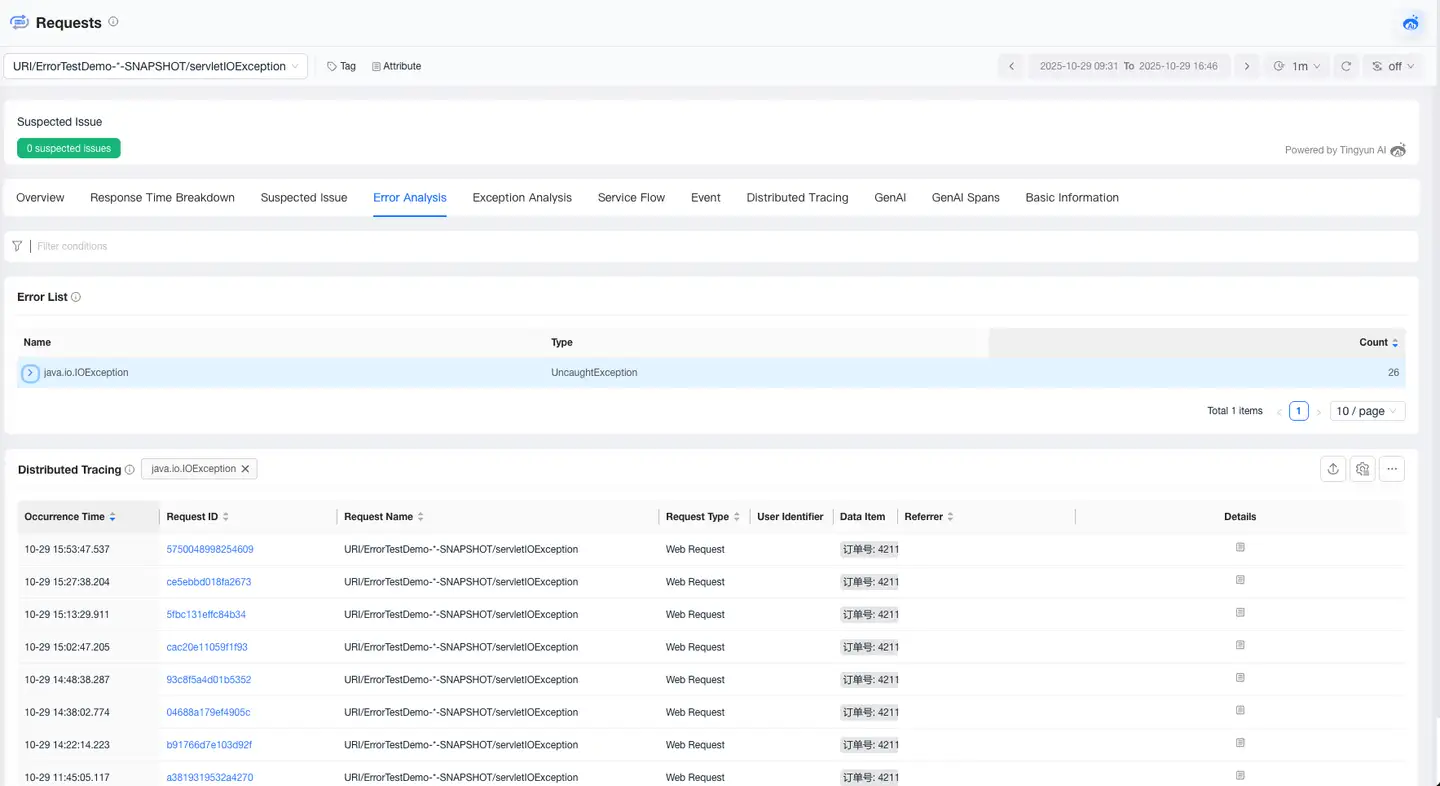
Error Analysis
The Error Analysis page allows you to view all error information that occurs in the current request, locate the impact scope and root cause of errors, and supports viewing the trace of the error.
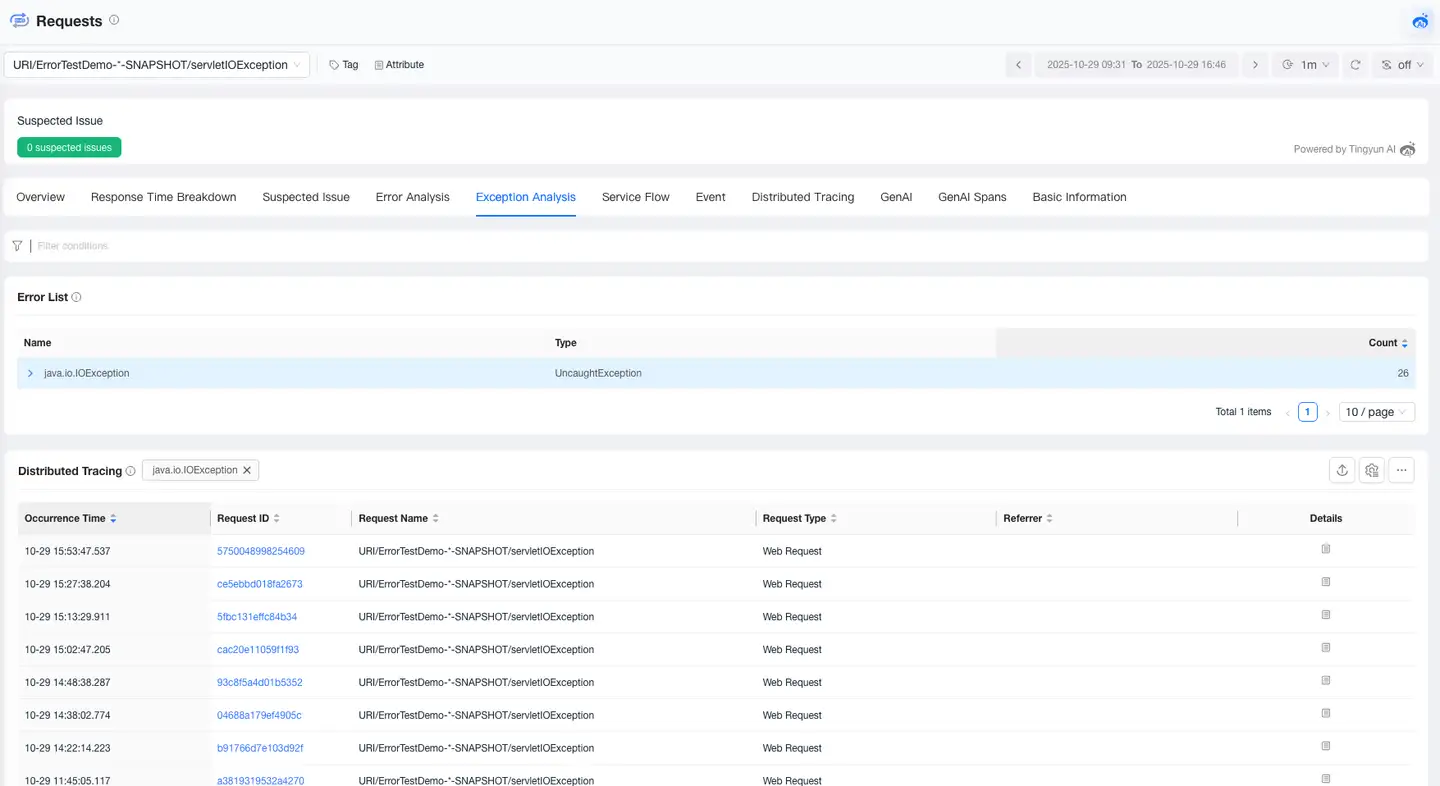
Exception Analysis
The Exception Analysis page allows you to view all exception information that occurs in the current request, locate the impact scope and root cause of exceptions, and supports viewing the trace of the exception.
Service Flow
Service Flow displays the dependency relationships and performance metrics between requests and requests, as well as between requests and components within an application. It helps you:
- Understand the sequence and dependency relationships of request and component calls
- Locate performance bottlenecks by identifying which applications are affecting overall response time
- Identify busy requests and components
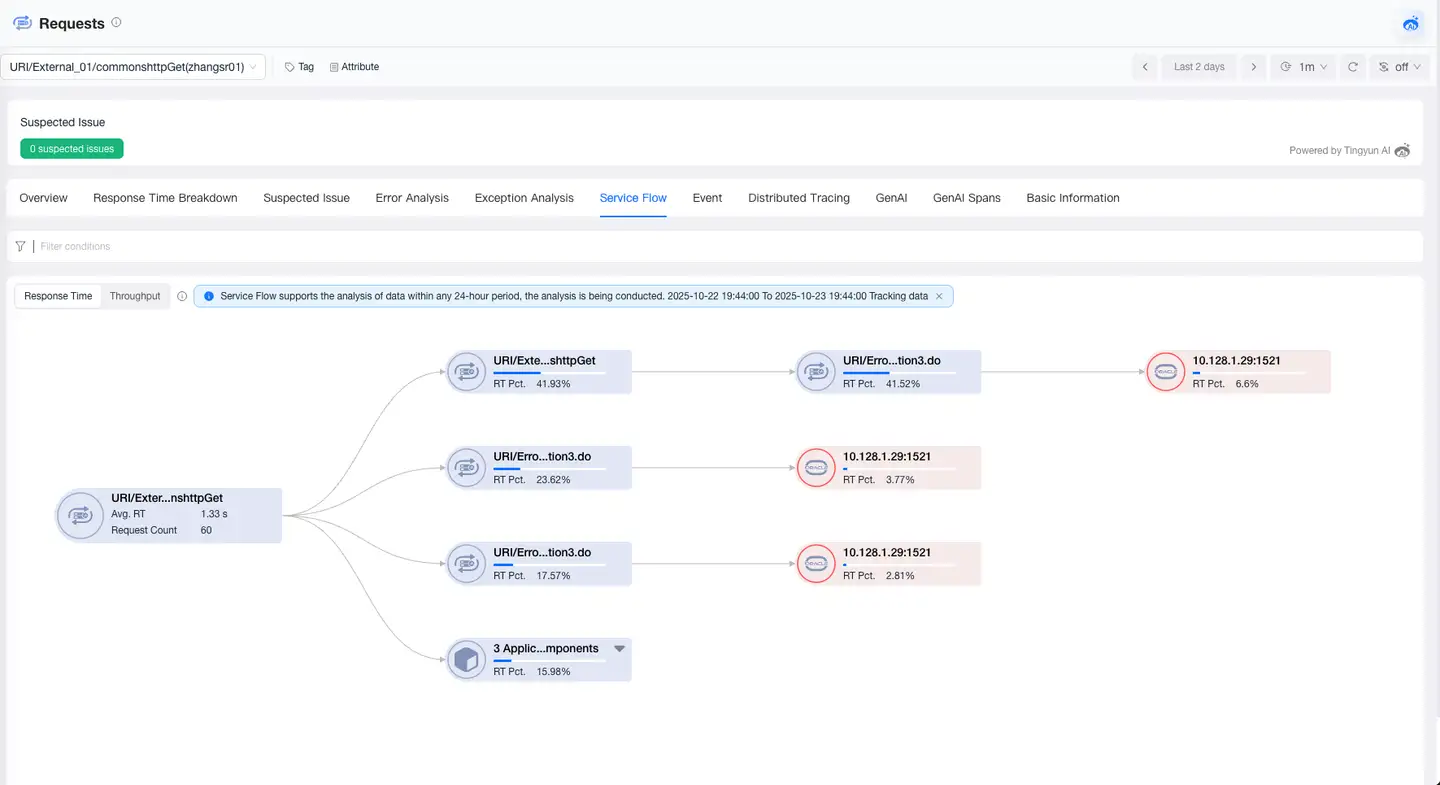
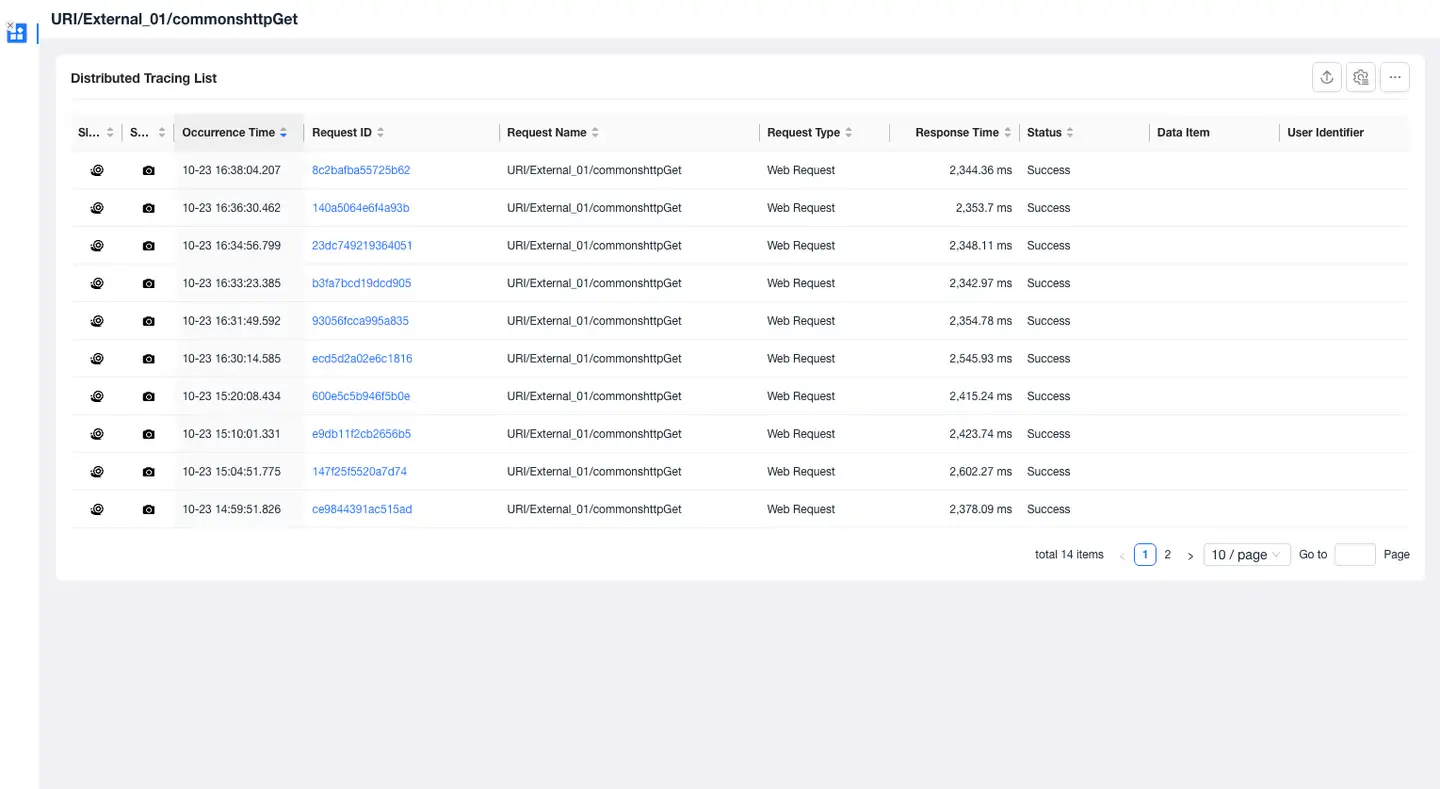
Click on a card to view the average response time and request count for the current request in the trace. Click the icon on the right to view details. The details allow analysis of traces for the current request, helping users further identify the root cause of slowness at the current node.
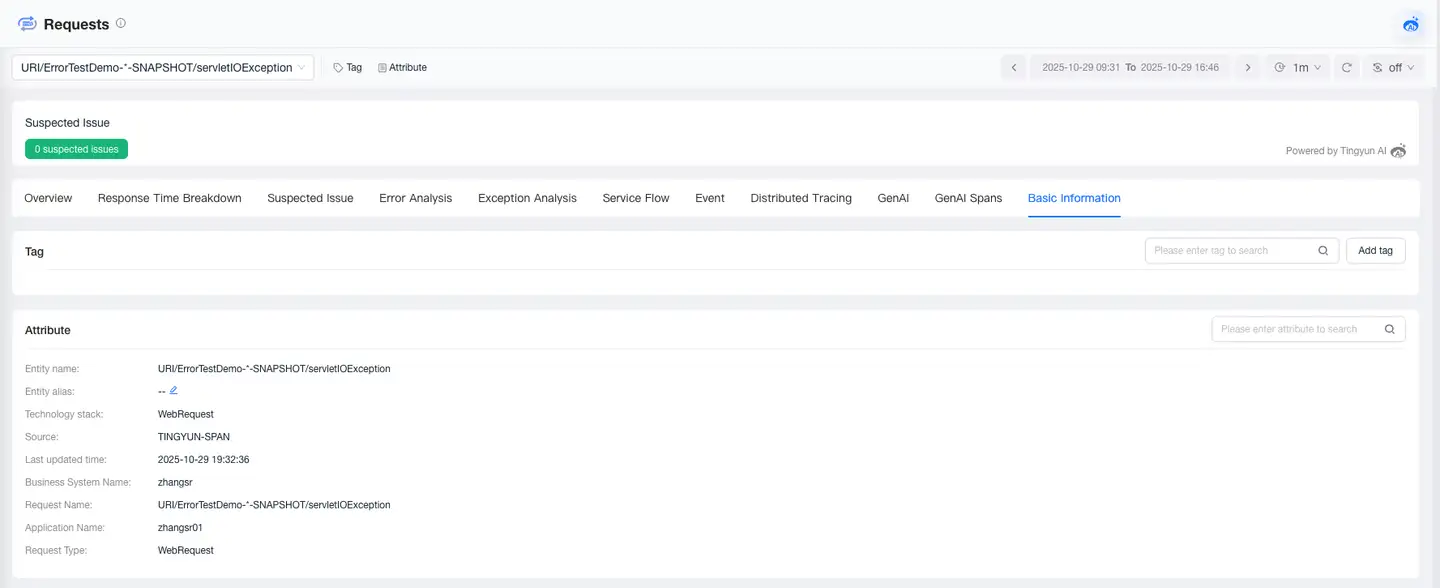
Basic Information
The Basic Information page displays the tags and attributes of the request. The Tags module shows the key and value of tags and supports users in adding or deleting tags. The Attributes module displays the attribute information of the request, such as name, alias, and associated application.