Profiling
eBPF Profiling
eBPF is a powerful kernel technology that allows running sandboxed programs dynamically in the kernel without modifying kernel source code. In the field of application performance monitoring, eBPF continuous profiling can capture performance bottlenecks in applications in real-time, including CPU and I/O usage, helping developers identify performance bottlenecks through detailed analysis, thereby optimizing programs, reducing latency, increasing throughput, and saving costs.
- On-CPU: Represents the time spent executing on the CPU, i.e., the actual CPU time consumed by functions, helping identify functions with high CPU consumption.
- Off-CPU: Represents the time waiting for the CPU, analyzing wait times during blocking operations such as I/O, locks, timers, paging/swapping, suitable for analyzing thread blocking or scheduling bottlenecks.
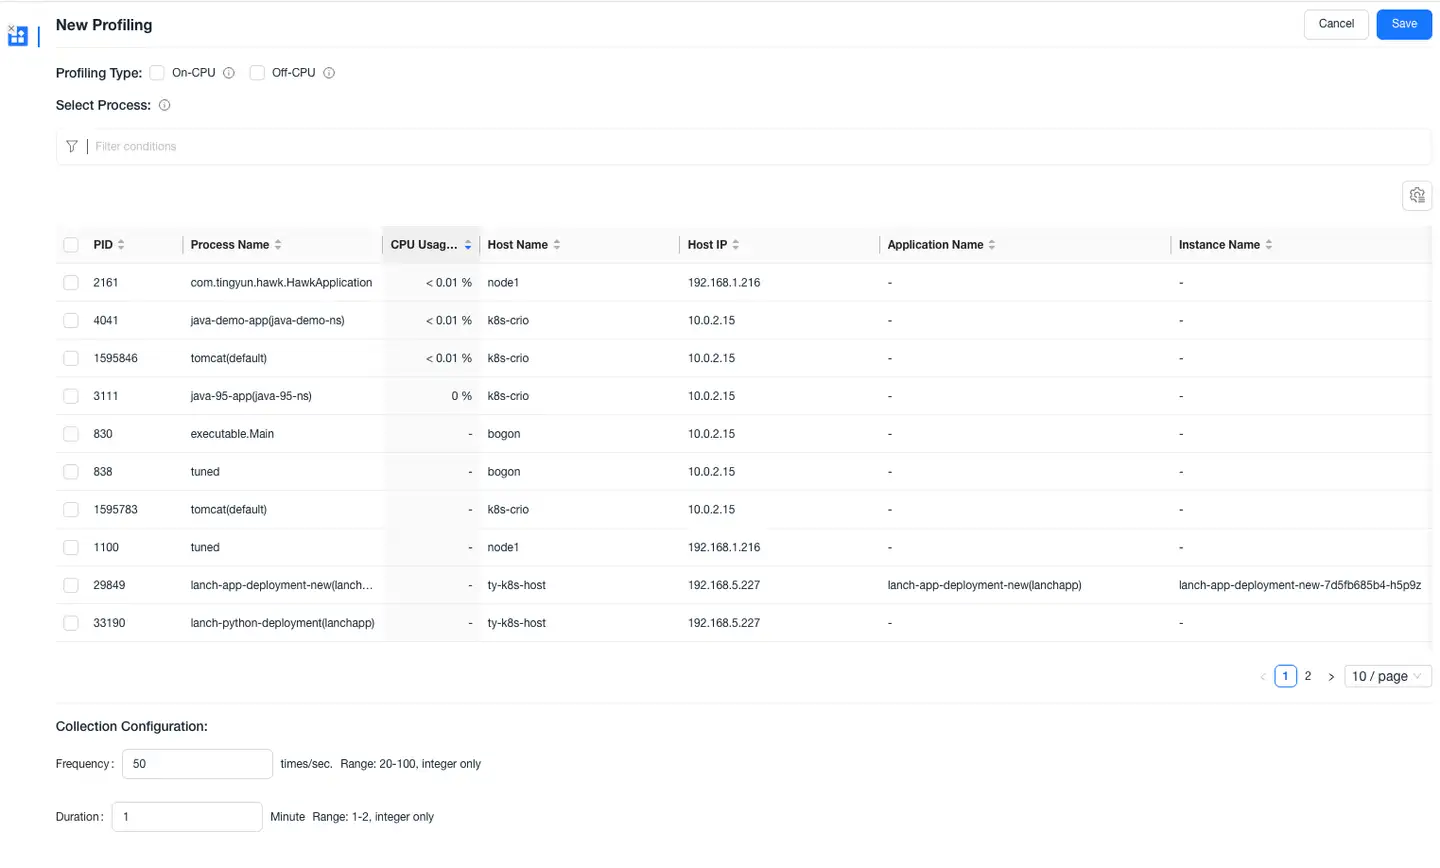
Create New Profile
- Enter the Profiling lightweight application, click the New Profile button in the upper right corner to open the New Profile page.
- Select the profile type, process, collection frequency, and duration for this profile:
- Profile Type: On-CPU, Off-CPU, supports multiple selection.
- Select Process: Supports selecting processes active in the last 30 minutes, supports filtering processes by host IP, host name, application name, instance name, etc.
- Collection Configuration: Default collection frequency is 50 times/second, duration is 1 minute.
- Only supports UniAgent 4.2.0.0+ and Kubernetes UniAgent 4.2.0.0+.
- Kernel version: x86 architecture requires 4.19+, arm64 architecture requires 5.5+.
- Does not support Nginx and PHP language processes.
- JDK version requirements (must support Serviceability Agent):
- Supports the following JDK types and versions:
- OpenJDK 1.7+
- Oracle JDK (HotSpot), Adoptium, and other mainstream distributions
- Does not support the following types and versions:
- JDK1.5, JDK1.6 (no built-in SA support)
- IBM JDK (different architecture, SA incompatible)
- Oracle JRockit (JRockit is independently implemented, incompatible with HotSpot's debugging mechanism)
- Supports the following JDK types and versions:
- The following Linux versions may have issues when performing eBPF profiling:
- Defective versions: 6.1.x, Fixed version: 6.1.36
- Defective versions: 6.3.x, Fixed version: 6.3.10
- Defective versions: 5.19 and above 5.x, 6.0.x and 6.2.x, Fixed version: 6.3.1
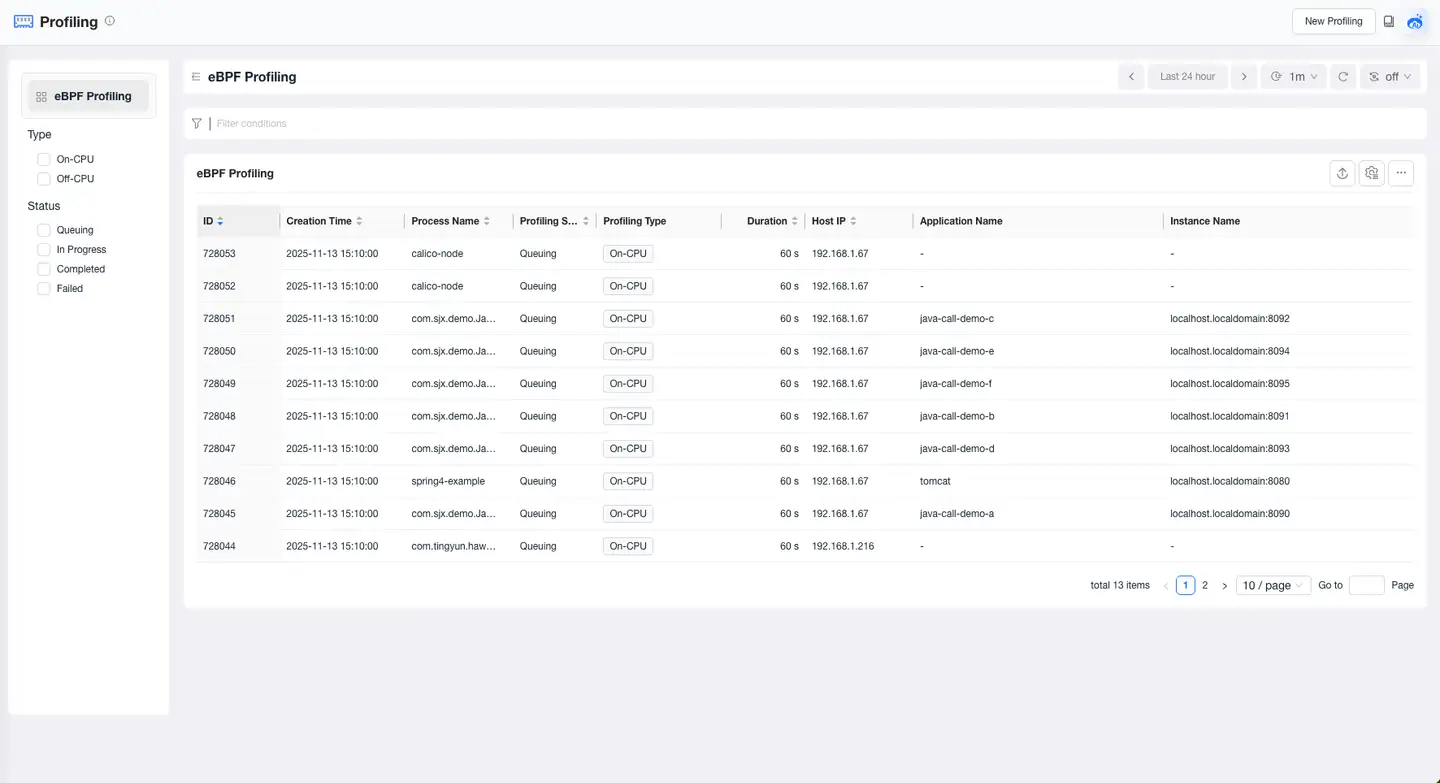
Profile List
The Profile List displays profiling results for the selected time range. Click ID to enter the profile details and view the profiling results.
Profile Details
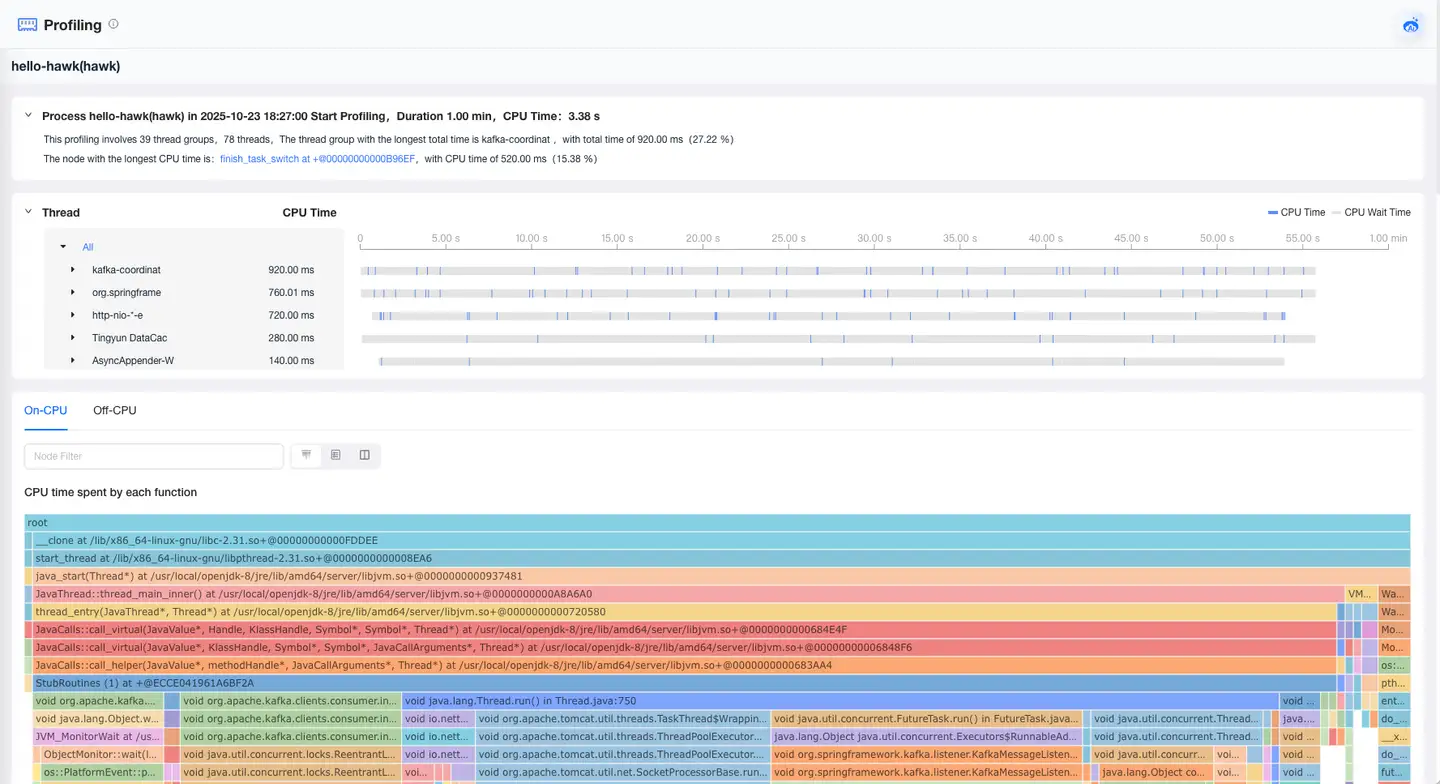
Thread Graph
By default, displays the On-CPU and Off-CPU time consumption for each thread group. Expand a thread group to view the time consumption of each thread. Supports clicking on thread groups/threads to view corresponding flame graphs.

Profiling Results
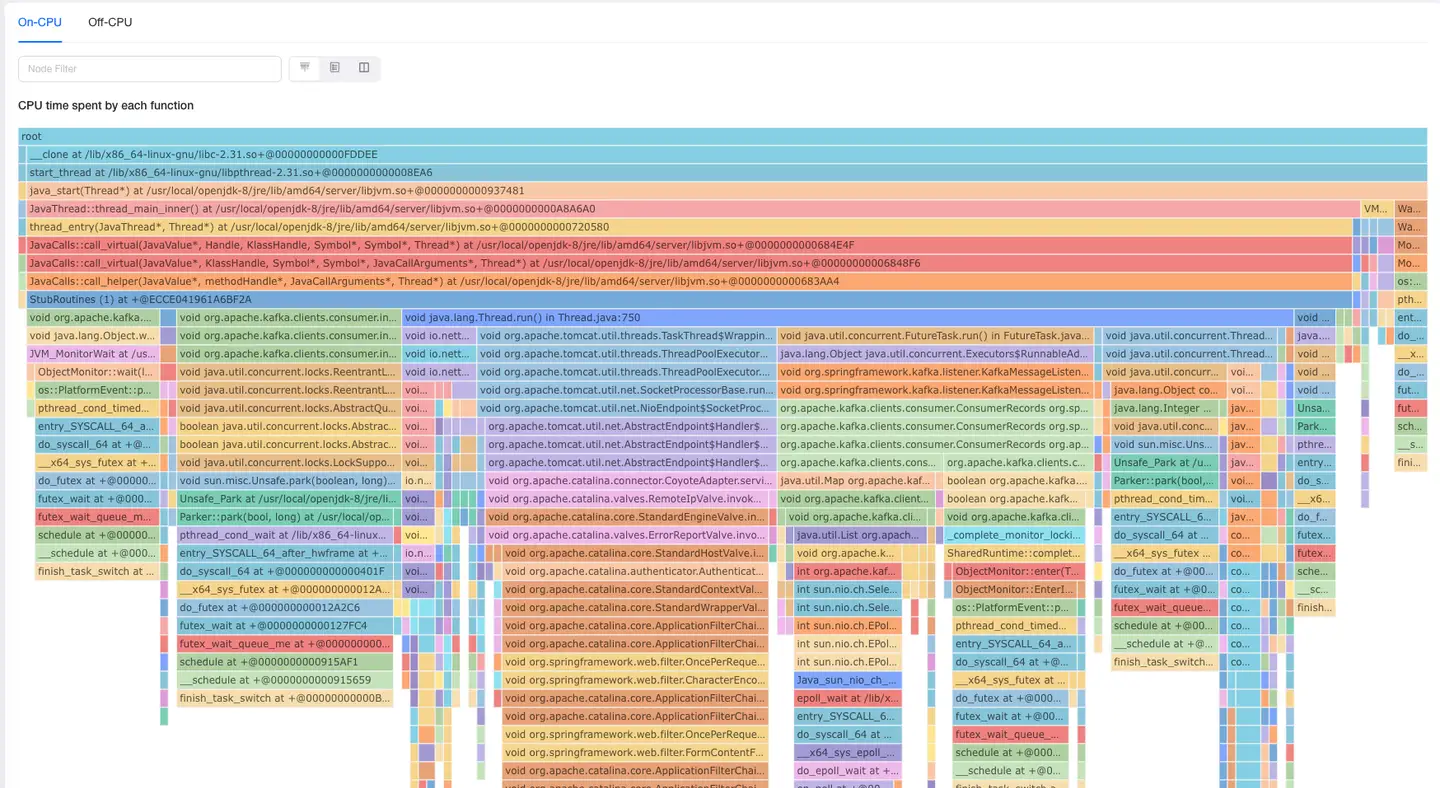
On-CPU Profiling
-
On-CPU profiling records the actual CPU time used by each function, helping identify functions or modules with high CPU consumption.
-
Displays:
- Flame Graph: Shows the CPU usage of each function, with color width representing the relative execution time of the function.
- Tooltips: When hovering over a function, displays the function's total time percentage, exclusive time percentage, etc.
- Supports displaying profile details in three ways: flame graph only, list only, or both flame graph and list simultaneously.
Off-CPU Profiling
-
Off-CPU profiling records the time functions spend waiting for CPU resources, suitable for analyzing thread blocking or scheduling bottlenecks.
-
Displays:
- Flame Graph: Shows the CPU wait time of each function, helping identify potential thread blocking points.
- Tooltips: When hovering over a function, displays the function's total time percentage, exclusive time percentage, etc.
- Supports displaying profile details in three ways: flame graph only, list only, or both flame graph and list simultaneously.
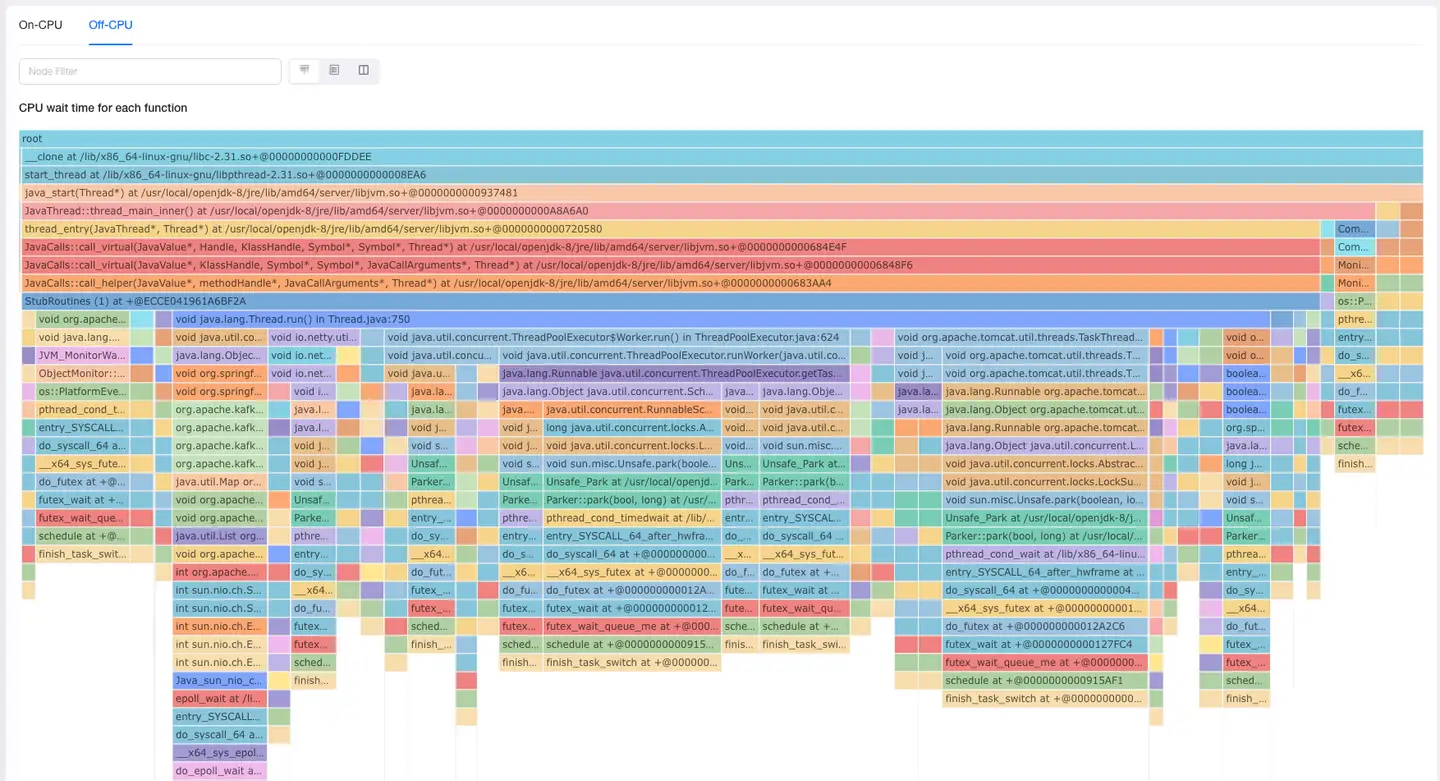
Note: For Off-CPU flame graphs, the total time of the root node may exceed the profiling duration, as the total time is the sum of times for each thread. For example: if the current process has 10 threads and the profiling duration is 1 minute, the total time of the root node would be 10 minutes.