GenAI
GenAI refers to the various large language models called by an application. GenAI observability provides an overview of the overall runtime performance of these AI model calls, including key metrics such as execution time, first token time, input token count, output token count, and also the GenAI span information. This helps users quickly understand the current state of GenAI and identify performance bottlenecks.
Note: Python Agent V4.0.0.0+ supports GenAI monitoring.
GenAI Overview
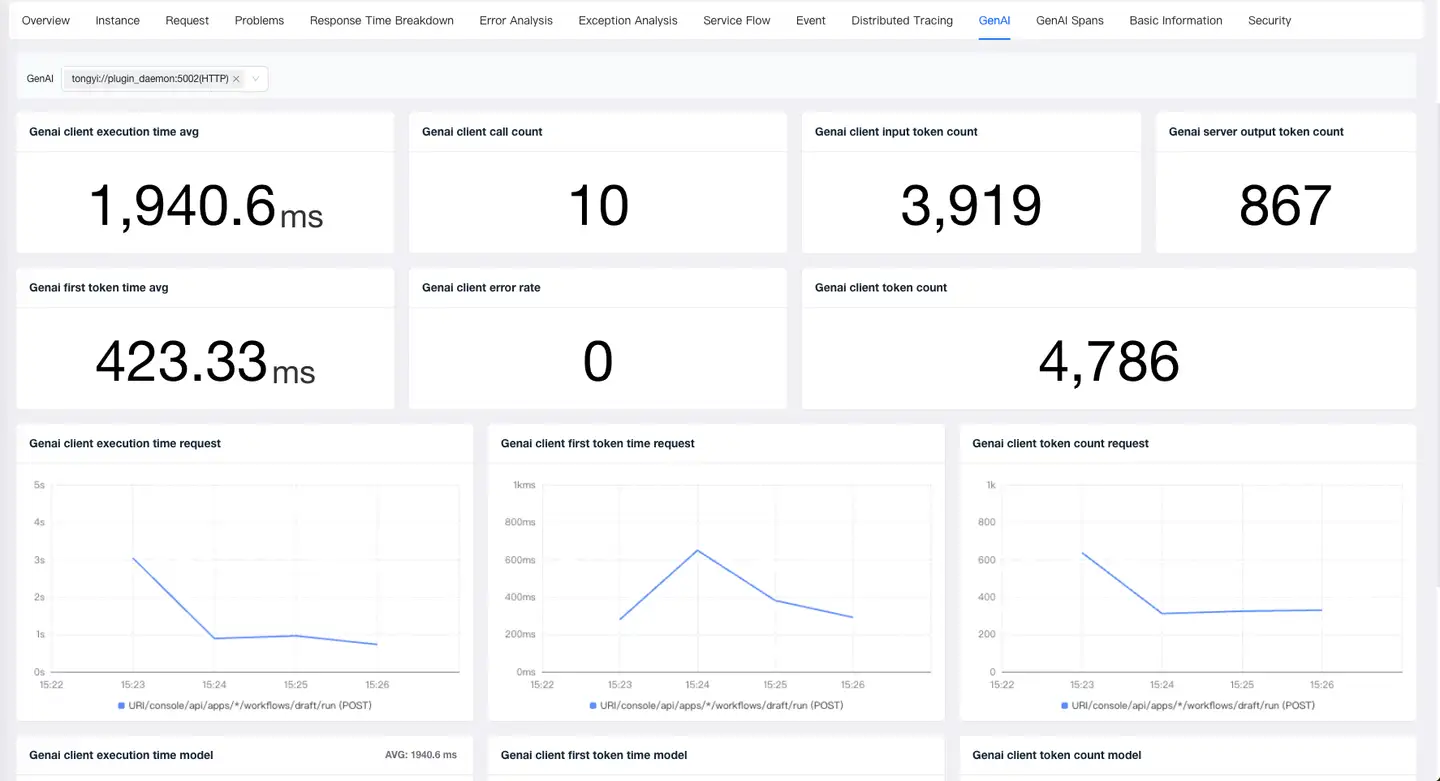
- Metrics: GenAI allows viewing key performance metrics for AI model calls, including GenAI client execution time, GenAI first token time, GenAI client call count, GenAI client error rate, GenAI client input token count, GenAI server output token count, and GenAI client token count.
- Analysis by Request: Enables viewing trend charts for each request’s GenAI client execution time, GenAI first token time, and GenAI client token count when calling an AI model.
- Analysis by Model: Enables viewing trend charts for each AI model’s GenAI client execution time, GenAI first token time, and GenAI client token count.
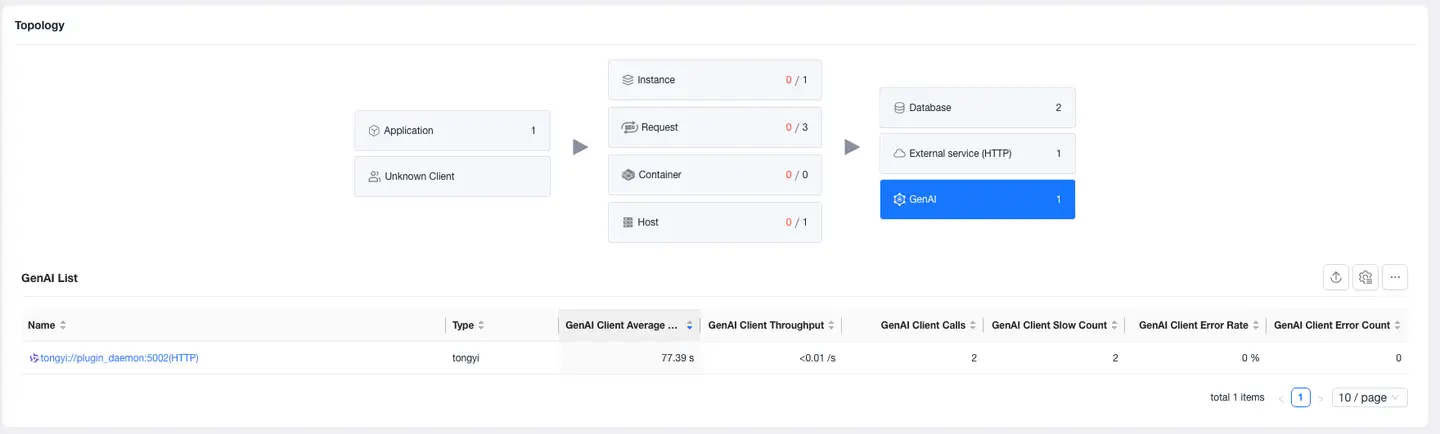
GenAI Calls
-
Select Application/Request - Overview - Relationships, you can view the performance of all AIs called by the current application/request.
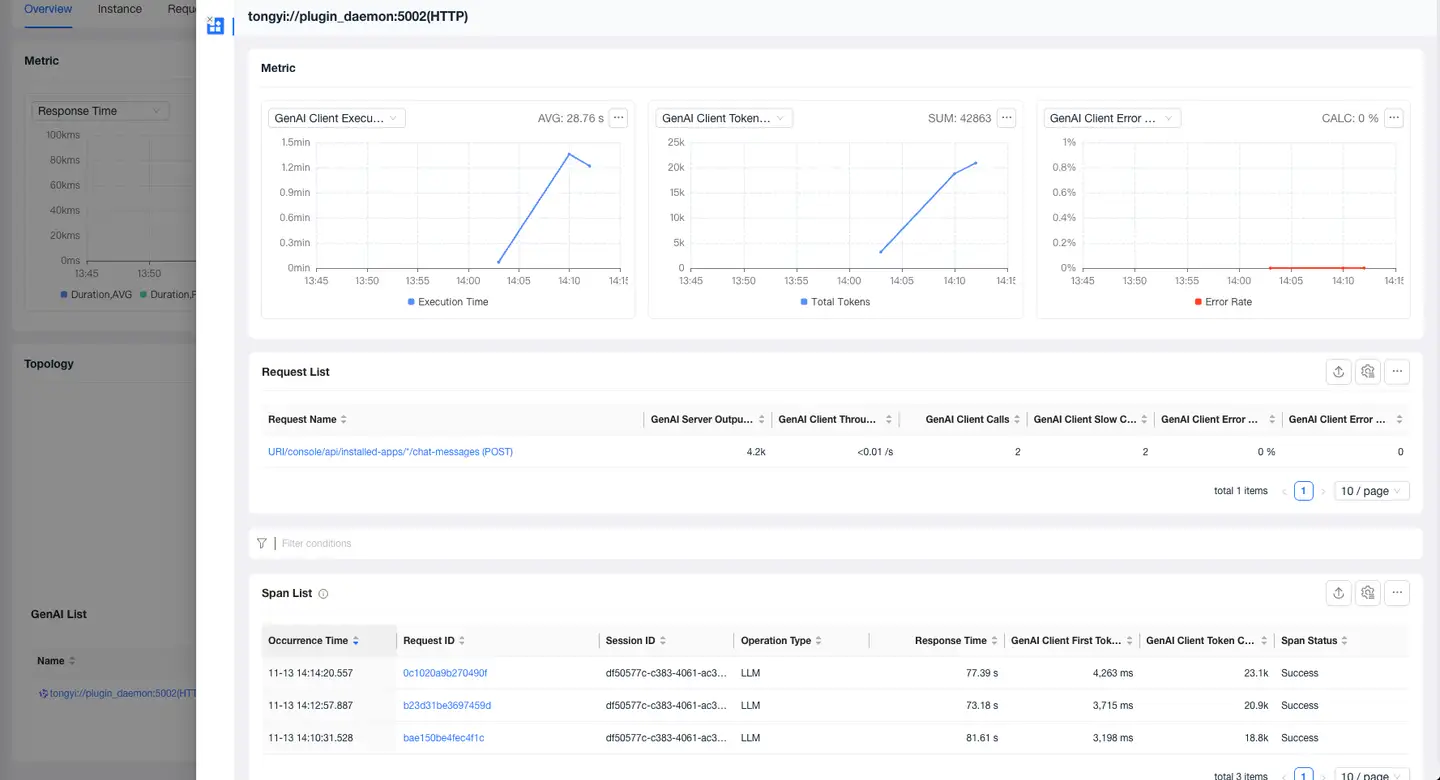
-
Click the name to view the current AI model's metrics, requests calling the current model, and Span list in the details page.
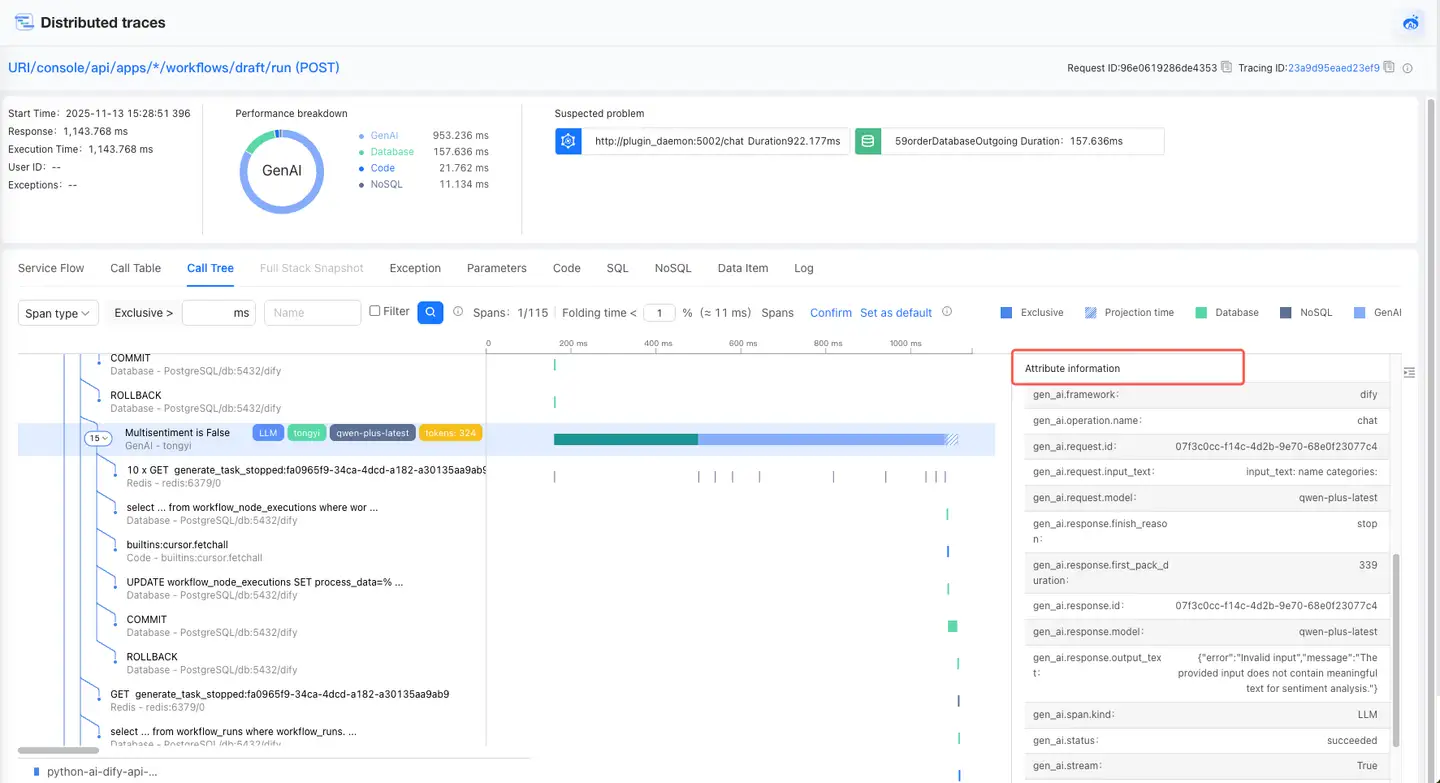
GenAI Tracing
Call Tree and Call Table allow you to view GenAI's call stack and details.
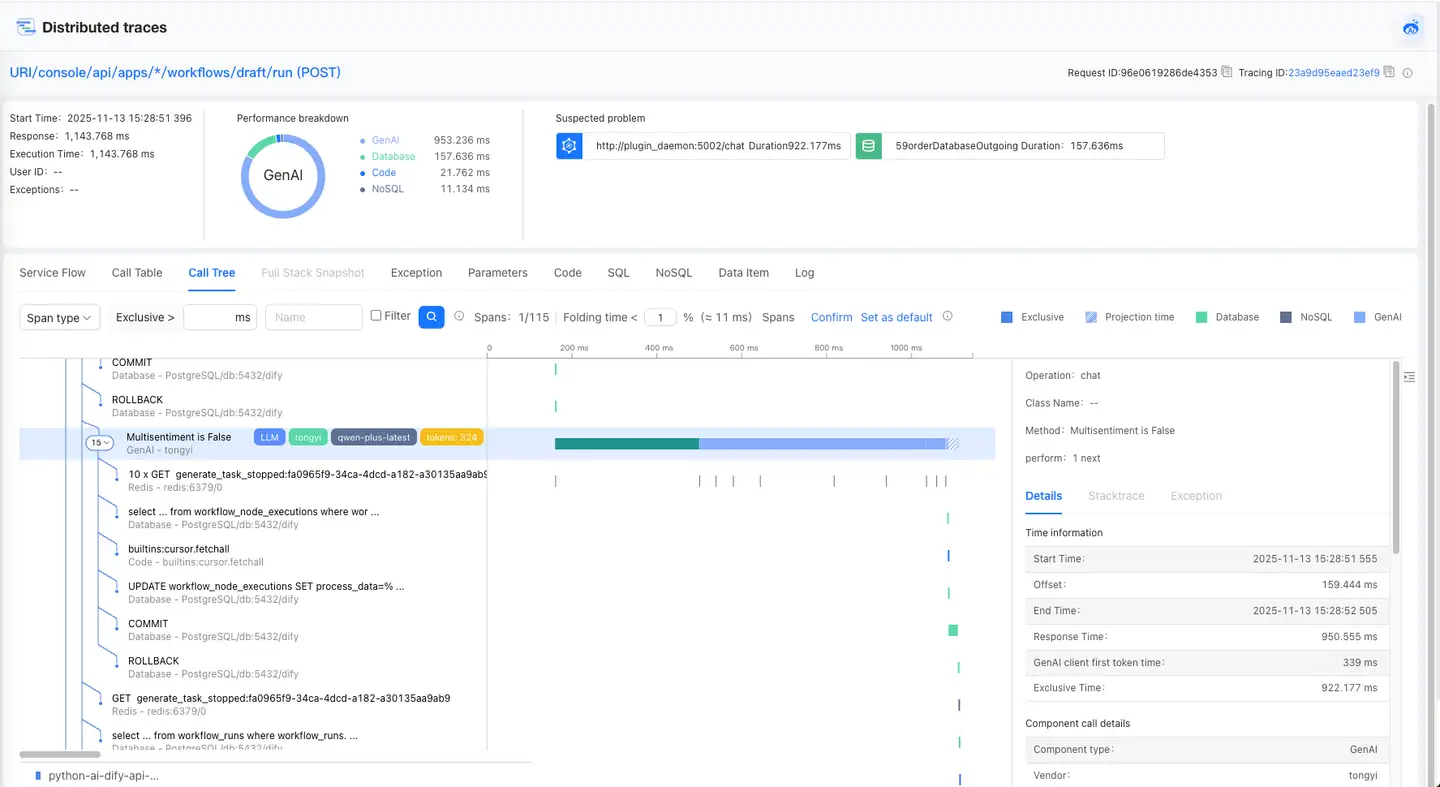
- The call stack on the left shows GenAI’s code-level calls and displays key AI information in the form of tags, including vendor, model, tokens, etc.
- The timeline diagram allows you to view the current GenAI execution time, start time, exclusive time, and offset.
- Clicking the call stack displays the specific details of the GenAI on the right.