Error Analysis
The Error Analysis module aggregates and analyzes errors and exceptions that occur in the current business system, application, or instance.
-
Error: An exception that affects user access requests is referred to as an error. When multiple errors occur within a single request, only the highest-priority error is recorded for that request, while other errors are excluded from statistics. Errors are prioritized in descending order of severity, including:
- Business Error
- Uncaught Exception
- HTTP Error Code
- Redirect Error Page
- Logged Exception
- Logged Error Message
-
Exception: Refers to anomalies occurring during code execution that do not affect user access. The statistical scope includes:
- External Service Exceptions
- Database Exceptions
- NoSQL Exceptions
- MQ Exceptions
- Code Exceptions
Error Analysis
Error Analysis displays errors for all requests, including web requests and background task errors.
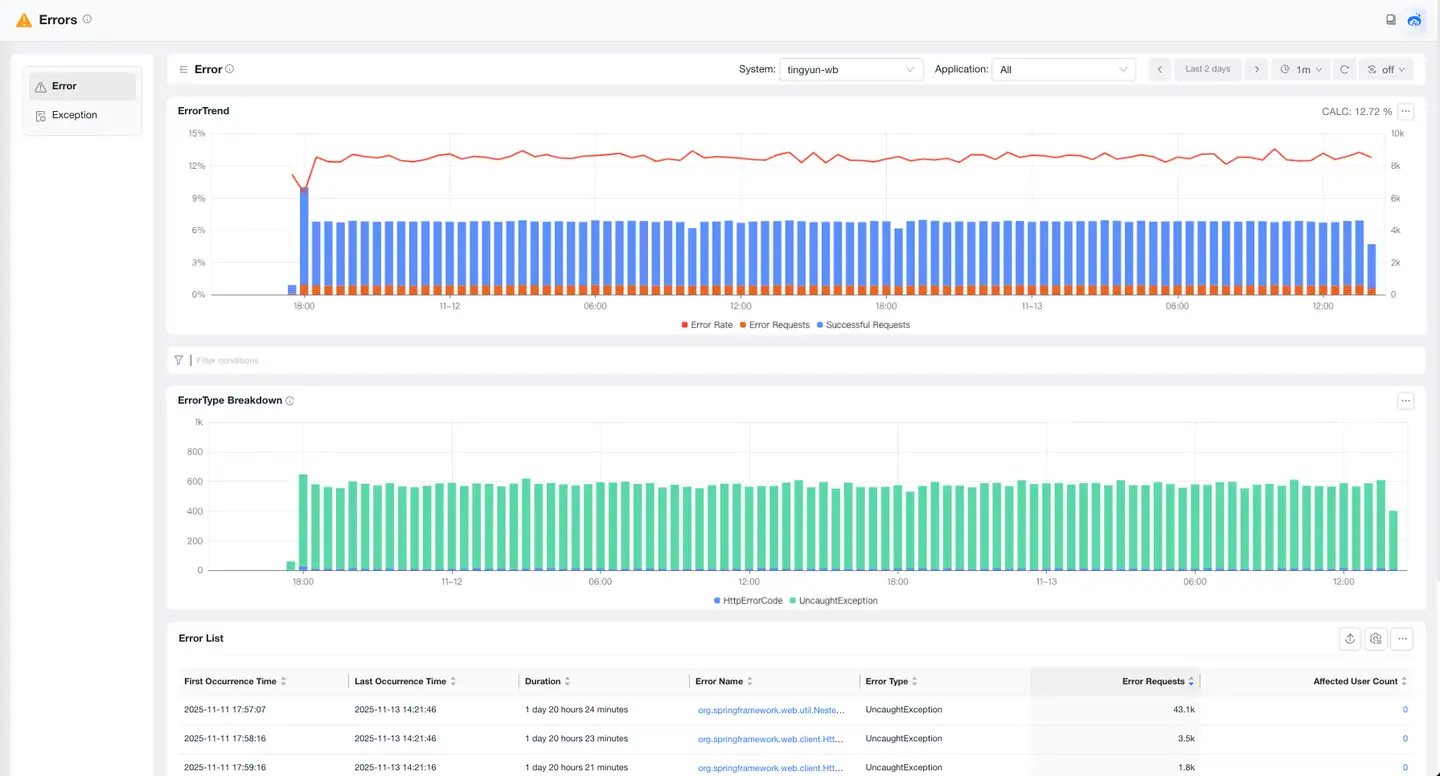
Error Trend Chart
The error trend chart shows the trends of normal request count, error count, and error rate. You can select the statistical object from the drop-down list at the top of the page.
Error Type Breakdown
The breakdown chart displays the composition of error types in a stacked bar chart. The total number of errors during the statistical period is shown in the upper right corner of the chart.
Error List
The error list displays all error information of the statistical object. Users can click the Error Name to access the detailed error page, click the Affected User Count to view both the quantity and specific information of impacted users, or click Data Items to view business impacts such as affected order amounts.
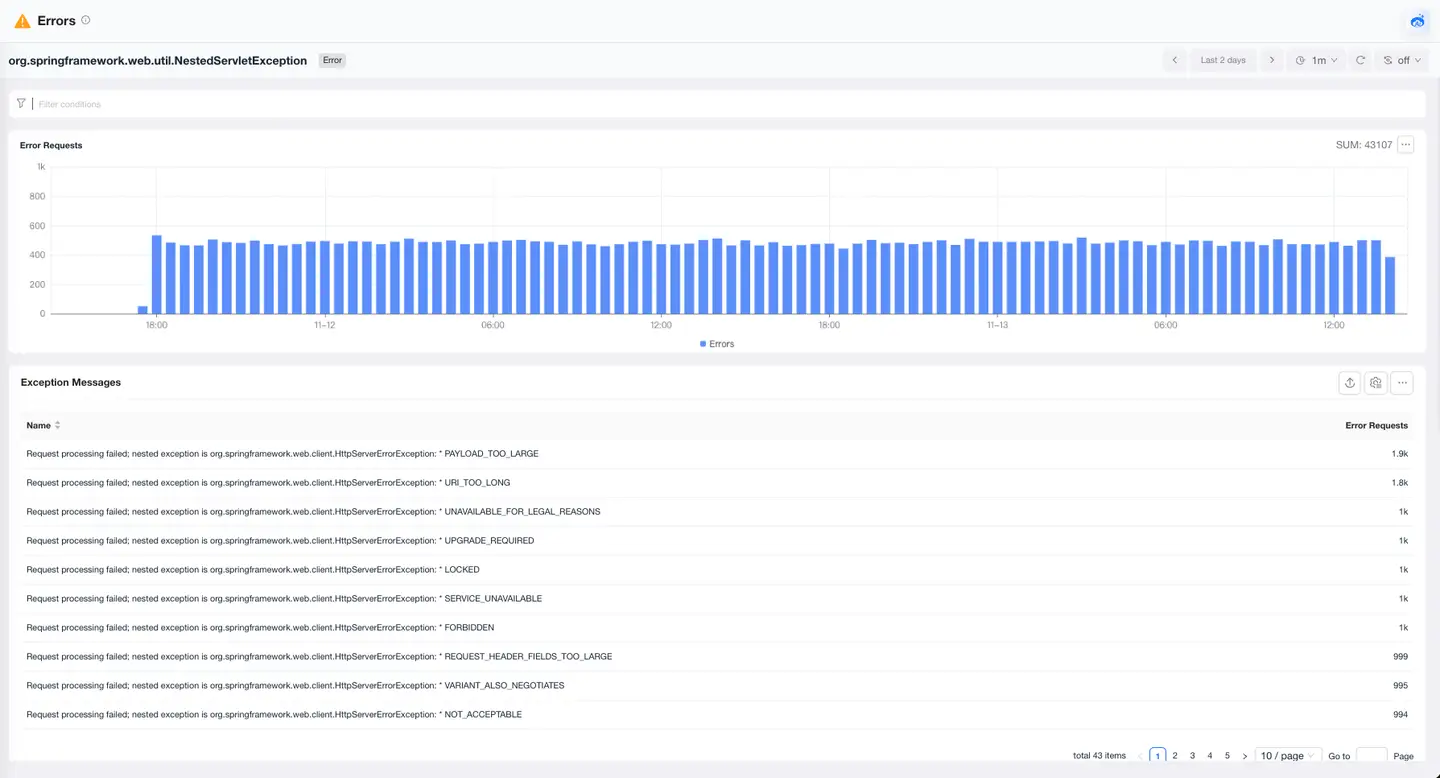
Error Details
The error details page analyzes the current error from aspects such as error count trend, Exception Messages, affected requests, and error traces to locate the root cause and impact scope of the error.
Exception Analysis
Exception Analysis displays exceptions for all requests, including web requests and background task exceptions.
Exception Trend Chart
The exception trend chart shows the trends of request count and exception count. You can select the statistical object from the drop-down list at the top of the page.
Exception Type Breakdown
The breakdown chart displays the composition of exception types in a stacked bar chart. The total number of exceptions during the statistical period is shown in the upper right corner of the chart.
Exception List
The exception list displays all exception information for the statistical object. Users can click the Exception Name to access the detailed exception page, click the Affected User Count to view both the quantity and specific information of impacted users, or click Data Items to view business impacts such as affected order amounts.
Exception Details
The exception details page analyzes the current exception from aspects such as exception count trend, Exception Messages, affected requests, and exception traces to locate the root cause and impact scope of the exception.