Configuration
Applications & microservices provide four levels of configuration options. The configuration levels (i.e., the order of precedence) from highest to lowest are: global configuration, business system configuration, application configuration, and instance configuration. Some configuration items may appear across multiple levels. The effective rules are as follows:
-
If a lower-level configuration is set to inherit from the upper level, the monitored object at the current level will inherit and maintain exactly the same settings as the upper level.
-
If the lower-level configuration is set to "Configure Separately" and the toggle is enabled with a value different from the upper level, the current lower-level setting will take effect. The priority of configuration effectiveness is:
Global Configuration < Business System Configuration < Application Configuration < Instance Configuration. -
If the lower-level configuration is set to "Configure Separately" but the toggle is not enabled, it means the monitored object at the current level does not enable this feature.
Global Configuration
Global configuration allows you to set options that apply across all system components.
General Options
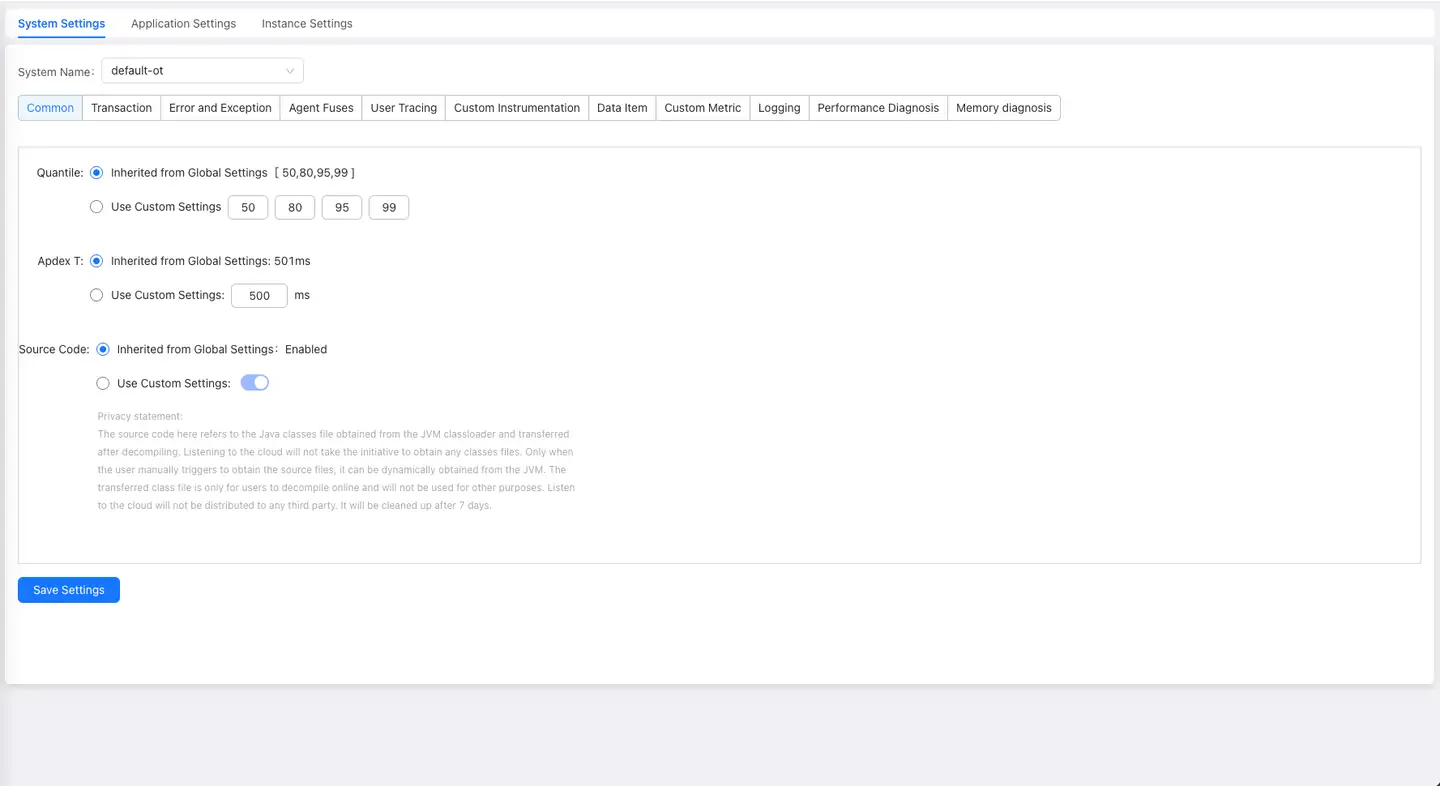
Apdex T
Apdex defines the optimal threshold T for application response time (i.e., Apdex T). Based on the application response time and T, three different performance levels are defined:
-
Satisfied: Application response time is less than or equal to T (T is determined by performance evaluators according to expected performance requirements), meaning the user is satisfied with the application's performance. For example, if T is 1.5s, a response time of 1s is considered satisfactory.
-
Tolerating: Application response time is greater than T but less than or equal to 4T. If T is set to 1s, then 4 * 1 = 4 seconds is the upper limit for tolerable response time.
-
Frustrated: Application response time is greater than 4T. Additionally, if a request's response status code is 400 or above (except 401) or an outermost exception occurs, it is classified as frustrated regardless of response time.
Applications & microservices use the average response time as the calculation metric, with the default Apdex T set to 500 milliseconds. The Apdex T configuration in Global Configuration applies to applications in all business systems.
The Apdex standard is user-centric, sampling real response times. After collecting data for a period, the application's response time performance is converted into a quantifiable user satisfaction score, called the Apdex Index, ranging from 0 to 1. 0 means all requests are unsatisfactory, 1 means all requests are satisfactory.
Formula: Apdex Index = (Number of Satisfied Requests + Number of Tolerating Requests/ 2) / Number of Successful Requests
Log Tracing
Java Agent 3.6.3.3 and Below Versions
A request often spans many applications, with request logs scattered across various applications, making it difficult to find all logs for a single request. The log tracing function can solve this problem well. After enabling the log tracing function, the Agent can automatically output NBS.APPID and NBS.REQUEST_GUID attributes in user log content. Through the NBS.REQUEST_GUID attribute, logs of single requests on different applications and instances can be correlated. When users trace slow requests through distributed tracing, they can query all log information of that slow request in application logs based on the trace ID of that slow trace.
Notes:
- NBS.REQUEST_GUID is the trace ID.
- Log tracing is disabled by default.
- This function is only supported for Java applications.
- The log tracing function supports mainstream Log4j and Logback logging frameworks.
- To use the log tracing function, all applications in the link need to deploy Tingyun APM Agent.
To configure log tracing, take the following steps:
-
When enabling log tracing for the first time in an application, you need to enable the following settings in the Agent configuration file tingyun.properties.
# Log tracing Plugin. Once enabled, the application logs will include Application & MicroServices related data, such as application ID, trace ID, etc.
class_transformer.tingyun-log4j-plugin-2.0.0.enabled=true
class_transformer.tingyun-log4j-plugin-2.3.enabled=true
class_transformer.tingyun-log4j-plugin-1.2.enabled=true
class_transformer.tingyun-logback-plugin-1.2.enabled=true -
Log in to the Application & MicroServices console, select Global Configuration in the left navigation bar, and enable the log tracing function in the General Options tab.
-
Configure the monitored application's log configuration file.
-
Log4j Configuration
log4j.appender.order-file-appender.layout.ConversionPattern=[%d] [%-5p] [%t]
[%c] [%R][%A]%m%n -
Log4j2 Configuration
<Console name="Console" target="SYSTEM_OUT">
 <PatternLayout pattern="%d{HH:mm:ss.SSS} [log4j2] %-5level %logger{36} -
 %msg%n[%A][%R]"/>
</Console> -
Logback Configuration
<encoder>
     <pattern>%d{HH:mm:ss.SSS} [%thread] %-5level %logger{36} -
  %msg%n[%A][%R]</pattern>
</encoder>
-
-
View the application logs.
For example, Log4j log output format is as follows:
2020-10-29T16:30:27,730-07:00][DEBUG][com.tingyun.Log-0][com.tingyun.Test][NBS.REQUEST_GUID:167d328d-b82a-4b8c-8049-7a3a13af158f][NBS.APPID:0017]

Test Log Message
Among them, [%R] is responsible for outputting the request's NBS.REQUEST_GUID. After configuration, logs will include NBS.REQUEST_GUID information. In the entire request link, the NBS.REQUEST_GUID generated by the entry transaction will serve as the unique identifier for the entire request link. This value will be continuously passed in the link until the last request of the link (except when encountering components that cannot implement cross-application tracing) to achieve full-link tracing. Logs of all applications involved in the call chain display the same NBS.REQUEST_GUID. [%A] is responsible for outputting the application's NBS.APPID, which is the unique ID generated by the Application & MicroServices system for each monitored application. After configuration, logs will include NBS.APPID information. If the log tracing function is disabled, even if you configure [%R], NBS.REQUEST_GUID will not be embedded.
Java Agent 3.6.4 and Above Versions
A transaction often spans many applications, with transaction logs scattered across various applications, making it difficult to find all logs for a single request. The Application & MicroServices log tracing function can solve this problem well. After enabling the log tracing function, the APM Agent can automatically output tingyun.app_id, tingyun.trace_id, and tingyun.span_id attributes in user log content. Through the tingyun.trace_id attribute, logs of single requests on different applications and instances can be correlated. When users trace slow transactions through Application & MicroServices, they can query all log information of that slow transaction in application logs based on the trace ID of that slow trace.
Notes:
- tingyun.trace_id is the trace ID in the Tingyun Application & MicroServices console page.
- Log tracing is disabled by default.
- This function is only supported for Java applications.
- The log tracing function supports mainstream Log4j and Logback logging frameworks.
- To use the log tracing function, all applications in the link need to deploy Tingyun APM Agent.
To configure log tracing, take the following steps:
-
Log in to the Application & MicroServices console, select Global Configuration in the left navigation bar, and enable the log tracing function in the General Options tab.
-
By default, the Agent uses the automatic injection method to add tingyun.app_id, tingyun.trace_id, and tingyun.span_id attributes to logs. The advantage of this method is that the Agent automatically writes data to application logs without modifying application configuration. The disadvantage is that you cannot customize the output position of the above attributes in the log configuration file.
Log output example:
2022-03-24 16:43:52.302 [http-nio-8079-exec-1] INFO [tingyun.app_id:2503,tingyun.trace_id:77469a69f8b9fdce,tingyun.span_id:77469a69f8b9fdce] com.tyt.controller.LogbackController -Thread[http-nio-8079-exec-1,5,main] -
If your environment has some definitions for log format, log tracing may affect log parsing. In this case, if you still want to use the log tracing function, you can customize the output position according to your business needs. You can use the manual injection method (not recommended), which requires configuring the monitored application's log configuration file. For example, if you want to output the above attributes at the beginning of the log, you can configure as follows:
log4j.appender.order-file-appender.layout.ConversionPattern= [TINGYUN] [%d] [%-5p] [%t] [%c]%m%nLog output example:
[tingyun.app_id:2503,tingyun.trace_id:77469a69f8b9fdce,tingyun.span_id:77469a69f8b9fdce] 2022-03-24 16:43:52.302 [http-nio-8079-exec-1] INFO com.tyt.controller.LogbackController -Thread[http-nio-8079-exec-1,5,main]Among them, [TINGYUN] is responsible for outputting the request's tingyun.app_id, tingyun.trace_id, and tingyun.span_id. In the entire request link, the tingyun.trace_id generated by the entry transaction will serve as the unique identifier for the entire request link. This value will be continuously passed in the link until the last request of the link (except when encountering components that cannot implement cross-application tracing) to achieve full-link tracing. Logs of all applications involved in the call chain display the same tingyun.trace_id. tingyun.app_id is the unique ID generated by Application & MicroServices for each monitored application. tingyun.span_id is the unique ID generated by Application & MicroServices for each segment of the request link. If the log tracing function is disabled, even if you configure [TINGYUN], the above 3 attributes will not be embedded.
Sampling
Sampling is a strategy for whether to retain distributed tracing data, and enabling it does not affect metric data. The Tingyun platform offers two sampling modes: "Call Chain Sampling" and "Request Sampling", of which only one can be enabled at a time.
Call Chain Sampling
By default, Application & MicroServices Agent provides full business and performance data collection. However, when application traffic is relatively large, to reduce the Agent's consumption of CPU, memory, and other resources, you can retain collected call chain data according to a certain proportion, which can help you record the most valuable link data with lower performance overhead. Call chain sampling is suitable for the following scenarios:
- During stress testing or major promotions when traffic is too high, to avoid full call chain data upload affecting client performance, you can consider adjusting the sampling rate proportion as needed.
- In daily situations, full call chain data upload leads to high network bandwidth costs, you can consider adjusting the sampling rate proportion as needed.
Call chain sampling records a certain proportion of call chain data based on trace ID. For example, with a fixed proportion of 10‰, 10 call chain data records are kept for every 1000 call chain data. Sampling will not cause call chain data itself to be incomplete - either the entire link data is retained or the entire link data is discarded. After enabling call chain sampling, Agent Collector retains transaction traces based on the sampling rate while ensuring call chain completeness, and performance summary data still maintains full collection. The default call chain sampling toggle is disabled. After enabling, the default sampling rate is 5‰. Please adjust the sampling rate according to actual needs.
Note: Only Agent Collector versions V3.6.1.2 and above support call chain sampling.
Request Sampling
After enabling request sampling, Tingyun platform will ignore call chain completeness requirements and retain trace data for each request based on sampling configuration at the instance level. In this mode, link completeness cannot be guaranteed. Please enable with caution.
You can collect distributed tracing data according to two modes: fixed proportion or fixed count.
- By default, 5‰ of distributed tracing data is collected per instance per minute, which can be configured according to actual needs.
- By default, 10,000 distributed tracing data are collected per instance per minute, which can be configured according to actual needs.
Source Code Retrieval
Note: This function is only supported in private deployment mode.
To help users find code problems more quickly, Application & MicroServices can retrieve user application source code for problem analysis. The source code here refers to Java Class files obtained from JVM ClassLoader, which are decompiled and stored. Tingyun will not actively retrieve any Classes files. Only when you manually trigger source file retrieval will it dynamically retrieve from JVM. The stored Class files are only for your online decompilation use and will not be used for other purposes. Tingyun will not distribute to any third party and will be automatically cleaned up after being temporarily stored on disk for 7 days.
To retrieve source code, take the following steps:
-
Implementation personnel configure the apm-api and apm-config of the Nacos component, changing the value of applicaticonService.showSourceCode to 1. The default value is 0, and the Retrieve Source Code function item is not displayed on the report.
-
Enable the retrieve source code function on the report.
-
Restart the application.
You can view the source code of a certain class in the Call Tree of the distributed tracing page details.
Tracing Options
-
Slow Request Threshold: When a request's response time is greater than the threshold, it will be marked as a slow request by Application & MicroServices.
-
Slow Method Stack: For methods, SQL statements, NoSQL operations, and custom methods involved in requests, method stacks, slow SQL details, and slow NoSQL operation details are only recorded when execution time is greater than the threshold. Enabled by default.
-
Obfuscate SQL: Refers to obfuscating numeric and string values in tracked SQL statements, replacing them with question marks "?". Enabled by default. Only effective for slow SQL tracing and request tracing.
-
Collect Request Parameters: Collect HTTP request headers and request parameters. Enabled by default.
-
Ignore Parameter List: If you don't want to collect individual sensitive parameters, you can set them, with multiple parameters separated by English commas.
-
GenAI Monitoring: After enabling this monitoring, the Agent will collect GenAI call situations. Currently only Python 3.4.8.0+ is supported. Enabled by default.
Errors and Exceptions
-
Collect Errors and Exceptions: When enabled, the application Agent will collect error and exception information from all applications in each business system. Enabled by default.
-
Capture Exception Stack: After enabling, exception information in transaction traces will include stack information. Enabled by default.
-
Select Language Type: Currently supports three languages: Java, .NET, and .NET Core. Different languages display different configuration items.
-
Collect Log Exceptions: After checking the Log4j or Logback checkboxes, you can collect and count exception information in error-level and above logs output by logging components. For example, if the application outputs a log log.error("message","IOException"), then IOException will be collected. .NET and .NET Core also support System logging components. After checking the logging component checkboxes, you can check the Message with log level higher than 'error' and Set transaction status as error checkboxes.
- Message with log level higher than 'error': By default, for error-level and above logs, if the log only has a message without exception information, it will not be counted as an exception. After checking this checkbox, the above logs will also be counted as exceptions.
- Set transaction status as error: After checking, transactions corresponding to error-level and above logs will be considered as errors, otherwise they will only be considered as exceptions. Logback only has error-level logs.
-
Ignore Based on Logged Message: Log exceptions that match the log message matching rules will not be considered as exceptions or errors. Click the Add button, select the message matching method, and enter exception information. Regular expressions are not supported here. Rules can be edited and deleted.
-
Ignore Based on Exception Class: You can add exception classes that you don't want to count as errors and exceptions to the list. These classes will be ignored in subsequent error statistics. Click the Add button and enter the complete exception class name including the package name. You can check the Exception Message Filter checkbox to ignore exceptions through exception information printed by exception.getMessage(). If the match is successful, that Exception will not be considered an Exception. Select the message matching method and enter exception information. Regular expressions are not supported here. Rules can be edited and deleted.
- Custom HTTP Status Codes: By default, Tingyun will set transaction status to error for Status Codes 400 ~ 505. However, business errors may not conform to this rule. For example: 900 in financial scenarios may represent "insufficient balance" and needs to be treated as a transaction error, while 401 is considered a normal transaction request. Through custom HTTP status codes, you can set error status codes and normal status codes respectively to identify whether transactions are normal, to meet the needs of the above two scenarios. Custom HTTP Status code names of "Error Status Code" type will be displayed as error types in error analysis, in the format: HTTP Error Code:
${name}. Status code rules can be edited, deleted, and batch deleted.
- Custom HTTP Status Codes: By default, Tingyun will set transaction status to error for Status Codes 400 ~ 505. However, business errors may not conform to this rule. For example: 900 in financial scenarios may represent "insufficient balance" and needs to be treated as a transaction error, while 401 is considered a normal transaction request. Through custom HTTP status codes, you can set error status codes and normal status codes respectively to identify whether transactions are normal, to meet the needs of the above two scenarios. Custom HTTP Status code names of "Error Status Code" type will be displayed as error types in error analysis, in the format: HTTP Error Code:
Notes:
- This option only takes effect when the Collect Errors and Exceptions option is enabled.
- When a certain status code is set as both an error status code and a normal status code, Tingyun will determine whether it is ultimately an error status code or normal status code based on the priority of configuration items. The higher the ranking, the higher the priority.
-
Custom Business Errors: Business errors refer to some abnormal results in business. Business errors are identified by defining rules for data item values. When business error rules are met, the transaction status will be set to error, and the error name will be the custom business error description. Business errors can be independently analyzed for trends, stacks, callers, call stacks, and request context in the error module. Click Add, enter the business error description, select data items (supports creating new data items), set matching rules for values, then click Confirm. Up to 3 matching rules can be added. Custom business errors can be edited, deleted, and batch deleted.
-
Custom Redirect Pages: When users frequently encounter situations where operations fail and jump to an error prompt page during application operations. You can define error pages that applications redirect to after errors occur. When the match is successful, the status of the transaction corresponding to this operation will be set to error. Click Add, enter the name, set matching conditions and the URL of the redirect page, then click Confirm. Custom Redirect Pages can be edited, deleted, and batch deleted.
Agent Circuit Breaker
Java Agent consumes application process resources during operation, including CPU and memory. When application process resources are tight, to ensure stable operation of the application process, Java Agent will trigger a circuit breaker mechanism, shutting down partial data collection to reduce consumption of process resources.
Related term explanations are as follows:
-
Heap Memory: JVM heap memory.
-
Garbage Collection: JVM garbage collection mechanism.
-
Garbage Collection CPU Time Ratio: CPU time consumed by Garbage Collection / Total CPU time.
There are two situations that trigger Agent circuit breaker:
-
When heap memory usage exceeds the configured value (default: 70%) or Garbage Collection CPU time ratio exceeds the configured value (default: 10%), sampling will be performed on data collection (default: 50%).
-
When heap memory usage exceeds the configured value (default: 80%) or Garbage Collection CPU time ratio exceeds the configured value (default: 20%), data collection will be disabled, but Agent heartbeat will still be retained.
When application process resources recover, data collection will resume.
Business System Configuration
Business system configuration applies to each independent business system. If you want the business system configuration to be completely consistent with global configuration, you can choose to inherit settings from global configuration. You can also configure independent configurations for each business system separately.
Except for percentiles, user traceability custom instrumentation, data items, and custom metrics, other business system configuration items are identical to global configuration items.
General Options
Percentiles: For specified business systems, you can separately set the percentile curves to be displayed, i.e., check Separate Configuration and then set. Business system-related percentile statistical charts display 50th, 80th, 95th, and 99th percentile curves by default.
User Traceability
When you need to trace which user performed a certain request, first set the user information retrieval method. When slow request tracing occurs, Application & MicroServices will capture user identifiers according to the data source you set in order of priority until one is obtained. When you view the list on the Distributed Tracing page, you only need to look at the User Identifier column to know which user triggered the slow request.
Note: When configuring user traceability in Java Agent, when cross-application exists in the application or Tingyun Web instrumentation is enabled, data will be written to Header or Cookie. When the data written by the application itself to Header or Cookie plus the data written by Java Agent exceeds the length limit of Header or Cookie, it causes the application to fail to write Header or Cookie, which in turn causes application errors. Java Agent 3.6.2.1 has made length restrictions on data written to Header or Cookie, with a default of 50 characters. This modification method cannot completely avoid the problem but can greatly reduce the possibility of the problem occurring.
Configure Retrieval Methods
To configure user traceability, click Add Data Source, select the retrieval method from the drop-down list, including the following methods:
-
Java method parameter(s): Retrieve from method parameters. This is the default method. Retrieving parameters through this method will automatically generate a custom instrumentation and automatically execute it, displayed in the Custom Instrumentation tab. Enter keywords of the class name in the Class search box, find the class name, then select the method where the user identifier parameter is located in the Method section, and then select the parameter to retrieve.
-
p1:xxxx or p2:xxxx represents the current method's parameters, sorted by method input parameter order.
-
this: The current Class's this object.
-
Getter Chain: Method call chain, which can retrieve a specific value in an object, such as getPerson().getName().
-
-
Web request query parameter: Retrieve from the request's URL parameters. Enter the parameter name representing user information in the text box.
-
HTTP request header: Retrieve from parameters in the HTTP request header. Enter the parameter name representing user information in the text box.
-
HTTP post parameter: Retrieve from parameters in the HTTP request body. Enter the parameter name representing user information in the text box.
-
HTTP response header: Retrieve from parameters in the HTTP response header. Enter the parameter name representing user information in the text box.
-
Servlet session attribute: Retrieve from parameters saved in Session for user identification. Enter the attribute name representing user information in the Key text box. If you need to retrieve a specific value in an object, please fill in the Getter Chain method call chain, such as getPerson().getName().
-
Web request path: Retrieve from the URI part of the request URL.
-
HTTP cookie: Retrieve from parameters saved in Cookie for user identification. Enter the parameter name representing user information in the text box.
Data Processing
In some cases, the retrieved parameter information is not accurate user information. For example, a certain field in the parameter is the real user information. For this situation, you can check Data Processing to perform secondary precision on parameters, including between, before, and after three methods. For example, if the Web request is https://help.tingyun.com/document_detail/106690.html?spm=a2c4g-11174359.6.643.54e960f80sE7s8, where only the part before "-" in the spm parameter is user information, then we set the Substring method to before, content to "-", and Tingyun APM will retrieve user information as a2c4g. You can also enter test content in the preview text box below and click View Result to confirm.
Manage Data Sources
After clicking Save Configuration, newly added data sources will be displayed at the top of the list, i.e., with the highest priority. You can click the arrows in the Order column to adjust the priority of data sources. The higher the ranking, the higher the priority. ↑ means move to top, ↓ means move to bottom. ↑ means move up one row, ↓ means move down one row. Tingyun APM will match data sources in order of priority to retrieve user identifiers. When you don't want to use a certain data source, you can turn it off in the Status column.
You can search for data sources based on Key keywords in the search box.
Custom Instrumentation
You can monitor certain methods of various non-standardized application components or methods of components not yet supported by Tingyun. When a method is called, the Agent will perform performance data search (such as call count, average response time, etc.) on that method. The retrieved content will be displayed in the transaction breakdown table and call stack of transaction traces.
Custom Instrumentation Status Bar: After the custom instrumentation status toggle is enabled, your configured custom instrumentation can be executed. When disabled, you can still configure custom instrumentation but cannot execute instrumentation.
Unexecuted Instrumentation List: Displays custom instrumentation configurations that are configured but not yet executed. Click the Add Custom Instrumentation button in the upper right to configure through code package addition and manual entry.
Add Through Code Package
When you cannot accurately input specific class names and method names, you can locate methods by hierarchy in the application code. Base packages will not be displayed here. In the drop-down menu, select the application, and you can search by class name, method name, or parameter name. Matched content will be displayed in blue, and searched methods will be automatically expanded and displayed. You can also directly click expandable packages and classes to locate methods. The parameter types are in parentheses, and the return value type is displayed last. After checking Ignore Method Parameters, parameters in methods will be displayed as ellipses, as shown in the figure below. Overloaded methods will be merged and displayed as one.
After determining one or more methods on the left, the right panel will display the Instrumentation Options and Ignore Transaction When Calling Method option buttons.
-
Instrumentation Options:
-
Include Subclasses: After checking, all subclasses of the class where the current method is located will be monitored.
-
Entry Method: Some methods, because they don't have entry methods, won't be displayed as a transaction even if custom instrumentation is performed. Therefore, if such methods are to be monitored as a transaction, this item must be checked.
-
Named Transaction/Business Interface: After checking, the method name will be used as the transaction name or service interface name. The transaction or service interface naming method is: Custom/Class Name/Method Name. If not checked, the transaction name will be some default method names.
-
Collect Method Parameters: After checking, you can collect parameters of the current method. The attribute name is to give a name to the parameter. A data item will be generated by default and displayed in the Data Items tab list. Only parameters with configured attribute names will be collected. When the parameter type is an object, if you want to collect a specific value, please configure the Getter Chain. If you need to continue adding parameter values to the name after naming the transaction, please check the Parameter Naming checkbox. This checkbox can only be checked when both the Named Transaction/Business Interface and Collect Method Parameters functions are enabled. The naming method is: Custom/Class Name/Method Name?key=parameter value.
-
-
Ignore Transaction When Calling Method: When this method is called, the transaction involved in this method will not be monitored, i.e., the above transaction will no longer appear in the transaction list or transaction trace list.
Manual Entry
If you are very familiar with application code, you can use this method. It includes 5 matching rules (i.e., Match Type), described as follows:
-
Class method by signature: Please accurately input the class name (including package name) and method name.
-
Ignore method parameters: Regardless of how many parameters the method has, all parameters will be collected.
-
Specify method parameters: Since method overloading occurs in Java code, parameter types need to be specified to uniquely determine a method. In the case of overloading, only methods with the same number of parameters as configured will be collected. For example, if there are 3 methods with the same method name, with 1 parameter, 2 parameters, and 3 parameters respectively, and we only configure one parameter type, then Tingyun APM will only collect the method with 1 parameter.
-
Instrumentation options: Please refer to the Instrumentation Options description under Add Through Code Package.
-
Ignore transaction when calling method: When this method is called, the transaction involved in this method will not be monitored, i.e., the above transaction will no longer appear in the transaction list or transaction trace list.
-
-
Class method by return type: Please accurately input the class name (including package name) and return value type.
-
Include subclasses: After checking, all subclasses of classes containing methods with this return value type will be monitored.
-
Entry method: Some methods, because they don't have entry methods, won't be displayed as a transaction even if custom instrumentation is performed. Therefore, if such methods are to be monitored as a transaction, this item must be checked.
-
Named transaction/business interface: After checking, the method name will be used as the transaction name or service interface name. The transaction or service interface naming method is: Custom/Class Name/Method Name. If not checked, the transaction name will be some default method names.
-
Collect method return value: After checking, you can collect return values of methods containing this return value type in this class. The attribute name is to give a name to the return value. A data item will be generated by default and displayed in the Data Items tab list. When the return value type is an object, if you want to collect a specific value, please configure the Getter Chain.
-
Ignore transaction when calling method: When methods containing this return value type in this class are called, the involved transactions will not be monitored, i.e., the above transactions will no longer appear in the transaction list or transaction trace list.
-
-
Interface method by signature: Please accurately input the interface name and method name.
-
Ignore method parameters: Regardless of how many parameters the method has, all parameters will be collected.
-
Specify method parameters: In the case of overloading, only methods with the same number of parameters as configured will be collected. For example, if there are 3 methods with the same method name, with 1 parameter, 2 parameters, and 3 parameters respectively, and we only configure one parameter type, then Tingyun APM will only collect the method with 1 parameter.
-
Instrumentation options: Please refer to the Instrumentation Options description under Add Through Code Package.
-
Ignore transaction when calling method: When this method is called, the transaction involved in this method will not be monitored, i.e., the above transaction will no longer appear in the transaction list or transaction trace list.
-
-
Interface method by return type: Please accurately input the interface name and return value type.
-
Entry method: Some methods, because they don't have entry methods, won't be displayed as a transaction even if custom instrumentation is performed. Therefore, if such methods are to be monitored as a transaction, this item must be checked.
-
Named transaction/business interface: After checking, the method name will be used as the transaction name or service interface name. The transaction or service interface naming method is: Custom/Class Name/Method Name. If not checked, the transaction name will be some default method names.
-
Collect method return value: After checking, you can collect return values of methods containing this return value type. The attribute name is to give a name to the return value. A data item will be generated by default and displayed in the Data Items tab list. When the return value type is an object, if you want to collect a specific value, please configure the Getter Chain.
-
Ignore transaction when calling method: When methods containing this return value type are called, the involved transactions will not be monitored, i.e., the above transactions will no longer appear in the transaction list or transaction trace list.
-
-
Method annotation for class: Please accurately input the annotation name.
-
Entry method: Some methods, because they don't have entry methods, won't be displayed as a transaction even if custom instrumentation is performed. Therefore, if such methods are to be monitored as a transaction, this item must be checked.
-
Named transaction/business interface: After checking, the method name will be used as the transaction name or service interface name. The transaction or service interface naming method is: Custom/Class Name/Method Name. If not checked, the transaction name will be some default method names.
-
Ignore transaction when calling method: When methods containing this annotation name are called, the involved transactions will not be monitored, i.e., the above transactions will no longer appear in the transaction list or transaction trace list.
-
Manage Custom Instrumentation Rules
After custom instrumentation is created, it will be displayed in the unexecuted instrumentation list, with enabled status by default. If you don't want to perform instrumentation on a certain configuration after clicking the Execute Instrumentation button, you can turn off that configuration in the Enable column. In the search box, you can search the list by entering class name, interface name, method annotation name, return value type, or method name.
Executed Instrumentation List: After clicking the Execute Instrumentation button at the bottom, custom instrumentation configurations with enabled status begin to execute and are displayed in this list. It includes four states:
-
Instrumentation successful: All instances of all applications in the business system execute instrumentation successfully.
-
Partially successful: Some instances of some applications in the business system execute instrumentation successfully, while some fail.
-
Instrumentation failed: All instances of all applications in the business system execute instrumentation failed.
-
Waiting for execution: Waiting for execution according to plan. Custom instrumentation can only be executed if the Agent has a heartbeat within 5 minutes.
Completed custom instrumentation configurations can be turned off in the Enable column to stop the Agent from collecting data for that configuration. In the search box, you can search the list by entering class name, interface name, method annotation name, return value type, or method name.
Data Items
You can define business-related parameters as data items. Data items can be used by custom metrics. Click Add in the upper right corner to configure data items.
-
Name: Enter the name of the data item.
-
Data Type: Select the data type of the data item, including String, Integer, and Double three types.
-
When multiple values occur, retain: For a request, the same method may be called multiple times, such as recursive calls of methods. The values of entry parameters are likely to be different each time they are called. At this time, you can set to retain the first (take the parameter value of the first call), the last (take the parameter value of the last call), or take the occurrence count.
-
Add data item source: Sources include the following 8 methods.
-
Java method parameter(s): Retrieve from method parameters. This is the default method. Retrieving parameters through this method will automatically generate a custom instrumentation and automatically execute it, displayed in the Custom Instrumentation tab. After selecting the class name in the Class drop-down menu (supports search), select the method where the parameter to be used as the data source is located in the Methods section, then select the data source to retrieve.
-
Class name: Class name, including package name.
-
Simple class name: Simple class name, not including package name.
-
Method name: Method name.
-
this: The current Class's this object. When you need to retrieve a specific value in an object, you can fill in the Getter Chain, such as getPerson().getName().
-
p1:xxxx or p2:xxxx represents the current method's parameters, sorted by method input parameter order.
-
-
Web request query parameter: Retrieve from the request's URL parameters. Enter the parameter name representing this data item in the text box.
-
HTTP request header: Retrieve from parameters in the HTTP request header. Enter the parameter name representing this data item in the text box.
-
HTTP post parameter: Retrieve from parameters in the HTTP request body. Enter the parameter name representing this data item in the text box.
-
HTTP response header: Retrieve from parameters in the HTTP response header. Enter the parameter name representing this data item in the text box.
-
Servlet session attribute: Retrieve parameters from Session. Enter the attribute name representing this data item in the text box. If you need to retrieve a specific value in an object, please fill in the Getter Chain method call chain, such as getPerson().getName().
-
Web request URL: Retrieve from the request's URL.
-
Web request path: Retrieve from the URI part of the request URL.
-
Data Processing
In some cases, the retrieved parameter information is not accurate data source information. For example, a certain field in the parameter is the real user information. For this situation, you can check Data Processing to perform secondary precision on parameters, including between, before, and after three methods. For example, if the Web request is https://help.tingyun.com/document_detail/106690.html?spm=a2c4g-11174359.6.643.54e960f80sE7s8, where only the part before "-" in the spm parameter is user information, then we set the Substring method to before, content to "-", and Tingyun APM will retrieve user information as a2c4g. You can also enter test content in the preview text box below and click View Result to confirm.
Newly created retrieval sources will be displayed at the top first, i.e., with the highest priority. Priority decreases from top to bottom. Tingyun APM will match data sources in order of priority to retrieve data item values. When you don't want to use a certain retrieval source, you can turn it off in the Enable column.
Custom Metrics
When you want to view the number of transactions that meet certain conditions (such as order amount greater than 100 yuan) from a business perspective, you can configure custom metrics to achieve this.
| Option | Description |
|---|---|
| Metric Name | Enter the name of the custom metric. |
| Metric (SELECT) | Configure the target data items to be collected, such as price and quantity. This item is equivalent to the SELECT role in SQL statements and is required. Click New, then select data items and aggregation rules. Aggregation rules are calculation methods and will change according to different data item types. For example, String type only includes count, indicating counting. After checking a metric, click Modify to modify it. After checking one or more metrics, click Delete to delete them directly. |
| Filter (WHERE) | Configure conditions for collecting target data item data. The Agent will only collect when all conditions in the filter are met. This item is equivalent to the WHERE role in SQL statements and is optional. Click the New button to add, select data items, comparison conditions, and values. After checking a metric, click the Modify button to modify it. After checking one or more metrics, click Delete to delete them directly. |
| Dimension (GROUP BY) | Configure the statistical dimensions of target data items to be collected. This item is equivalent to the grouping role of GROUP BY in SQL statements and is optional. Click the New button to add, select data items. After checking one or more metrics, click Delete to delete them directly. |
For example, if you want to know how many orders have an amount greater than 100, that is, to count how many times transactions involving the order submission business operation have an amount parameter greater than 100. If we assume that the order amount has been set as the data item "Amount", then we can define the custom metric as "Order Amount Greater Than 100", add "Amount" to the metric, with aggregation rule as count. Add "Amount" to the filter, comparison condition as greater than, value as 100. No dimension is set.
For custom metric monitoring results, please go to the Custom Metrics tab under the application or the Custom Metrics tab under transactions to view.
Click on specific metric entries to view statistical details.
You can query the dimension display details of this metric by dimension.
Performance Diagnosis
By default, the Agent monitors a limited number of methods. For a complete call chain of a request, there may be a certain method that takes particularly long time but cannot be further analyzed at a fine-grained level. Full-stack snapshots obtain more detailed call chain information by taking multiple snapshots of the request thread to more accurately analyze performance bottlenecks. After receiving the snapshot collection instruction, the Agent will start a snapshot collection diagnosis session for a certain request thread, collecting information such as thread name and thread ID of the current thread.
Collecting full-stack snapshots has certain performance consumption, so you can control whether to enable snapshot collection as needed. After enabling, you can also control the time interval for single snapshot collection.
Full-stack snapshot collection modes include the following three:
-
Trigger Collection: Conditionally trigger full-stack snapshot diagnosis sessions.
Trigger conditions: When the proportion of slow requests exceeds the specified threshold (default 10%, data boundary: [1, 100]%) and the number of slow requests exceeds 20 within 1 minute, start the diagnosis session. The diagnosis session duration defaults to 5 minutes (data boundary: [1, 10]). During this diagnosis cycle, 10 snapshots (data boundary: [1, 100]) will be attempted to be collected per minute for each request, with a total snapshot limit of 100 (data boundary: [1, 1000]).
To avoid collecting too much snapshot data due to persistent performance issues, you can configure the waiting time between diagnosis sessions, with a default diagnosis session interval of 10 minutes (data boundary: [5, 30]).
-
Fixed Period Collection: Collect full-stack snapshots according to fixed periods. Only effective after checking the checkbox.
Trigger conditions: Collect 10 full-stack snapshots every 1 minute (data boundary: [1, 100]). When in a diagnosis session (trigger collection), fixed period collection is paused.
-
Forced Collection: Force collection of full-stack snapshots based on conditions. Only effective after checking the checkbox. This mode is disabled by default.
Trigger conditions: When request execution time exceeds 3 times the slow request threshold (data boundary: [slow request threshold, ∞]), enable full-stack snapshots for that request, with a maximum of 100 snapshots collected per minute.
Click the Save Configuration button at the bottom, and the configuration begins to take effect. You can view results in the Full-stack Snapshots tab of request trace details.
Application Configuration
Application settings configure configuration items by application unit, only effective for specified applications. Some configuration items can inherit business system-level configurations, which we will not explain here. For specific descriptions, please see business system settings. It should be noted that applications cannot inherit custom metrics from business system configurations.
General Options
-
Application Alias
Setting application aliases is only for you to view applications more conveniently in the interface and facilitate identification.
-
Auto-named Transactions
By default, application Agent names transactions by adding URI prefix before Web request URI, i.e., the transaction name structure is: URI/Web request URI part. When the auto-named transaction function is enabled, the application Agent names transactions according to application frameworks or components to enhance transaction identifiability. The transaction name structure is: Application framework or component name/Web request URI part.
Let's use an example to illustrate the auto-named transaction function. Suppose a user initiates an HTTP request from the browser side, with the complete URL being
http://www.tingyun.com/sql/oracleException1.do?city=beijing. If the component handling this transaction is Servlet, when the auto-named transaction function is not enabled, the transaction name is URI/sql/oracleException1.do. If enabled, the transaction name is Servlet/sql/oracleException1.do. -
Log Tracing
Please refer to the log tracing introduction under Global Configuration.
-
Enable Thrift Monitoring
After enabling this function, RPC calls made through the Thrift framework will be monitored. Monitoring Thrift programs not generated by official generators may cause application crashes. If there are customizations or secondary development, please fully test in the test environment before carefully enabling this function.
-
MQ Consumer Monitoring
Monitoring MQ consumers may cause a decrease in the application's ability to process messages, which in turn will cause the data in the MQ message queue to grow rapidly and cause backlog. Therefore, please fully test in the test environment before carefully enabling this function.
Sampling
Please refer to the sampling introduction under Global Configuration.
Agent Circuit Breaker
Please refer to the Agent circuit breaker introduction under Global Configuration.
Errors and Exceptions
Please refer to the errors and exceptions introduction under Global Configuration.
Transactions
Enable Tracing
Please refer to the enable tracing introduction under Global Configuration.
Transaction Naming
The transaction naming function can enrich the naming methods of transactions, including naming transactions according to request methods, naming transactions according to parts of request URIs (URI refers to the part of URL except domain name or IP address, port number, ContextPath, and parameters), or naming transactions according to various parameters of requests.
Naming Principle: The probe will aggregate transactions that meet the conditions according to the configured matching rules, and then rename the transactions according to the naming rules to facilitate your identification of transactions.
Matching Rules
After the probe collects a request, it will match the request with the matching rules. Requests that meet the same matching rule are the same type of request.
In the matching rules, the application probe's matching method for URLs is as follows:
-
Support multiple request methods: GET, POST, PUT, DELETE, HEAD.
-
Support diversified URI matching methods: equals, starts with, ends with, contains, regex.
-
Support matching URLs according to URL parameter names, Header parameter names, and Body parameter names. This part can be selectively configured according to user needs. If multiple parameter rules are configured, all rules must be satisfied to match the request.
URL parameters (applicable to GET requests):
Request header parameters:
Request body parameters (applicable to POST requests):
Naming Rules
Naming rules make the methods of transaction naming more abundant. You can specify request methods as part of transaction names, specify URI segments as part of transaction names, or specify some parameters as part of transaction names, thereby enhancing the identifiability of transactions.
If only matching rules are specified without naming rules, the transaction name generated by URL requests that meet the conditions is the transaction naming rule name. If naming rules are specified, the transaction name structure is:
-
Name by request method: Matching rule name/(request method).
-
Name by URI segment: Matching rule name/URI segment.
-
Name by URL parameter name: Matching rule name/?URL parameter key=parameter value. If there are multiple parameters, they are connected with & symbols.
-
Name by Header parameter name: Matching rule name/?Header parameter key=parameter value. If there are multiple parameters, they are connected with & symbols.
-
Name by Body parameter name: Matching rule name/?Body parameter key=parameter value. If there are multiple parameters, they are connected with & symbols.
-
Name by Cookie parameter name: Matching rule name/?Cookie parameter key=parameter value. If there are multiple parameters, they are connected with & symbols.
Let's use examples to illustrate the transaction naming function.
Example of Naming by Request Method
For the transaction URI/portal/addchart, we want to name requests made by POST method and GET method separately, so we need to configure Name by Request Method, which will ultimately generate two transactions: test/(POST) and test/(GET).
Example of Naming by URL
Suppose there are multiple similar transactions such as URI/portal/addchart, URI/redirect/addchart, and we only define operations for requests with POST method and the 3rd segment of URI being addchart. When configuring matching (aggregation) rules, we can configure as follows:
The final generated transaction name is test/addchart.
Example of Naming by URL Parameters
Suppose there is a request /order, when action=1 represents submitting an order, when action=2 represents payment. When configuring rules, we can configure as follows (rule name is test):
Through the above aggregation rules, two aggregated requests will be generated:
-
test?action=1
-
test?action=2
We can define the first type of request as the submit order operation and the second type of request as the payment operation.
Example of Naming by Header Parameters
Suppose for the transaction /order, we only name POST method requests according to the Header parameter Referer. When configuring rules, we can configure as follows (rule name is test):
When Referer is http://10.128.2.48:8080/server/system, the generated transaction name is test?Referer=http://10.128.2.48:8080/server/system.
Example of Naming by Body Parameters
Suppose for the transaction /order, we only name POST method requests according to the action in Body parameters. When configuring aggregation rules, we can configure as follows (rule name is test):
When action is 2, the generated transaction name is test?action=2.
Example of Naming by Cookie Parameters
Suppose there is a request https://10.128.2.45:8080/order, and we need to name it according to the JSESSIONID parameter in Cookie parameters:
When configuring aggregation rules, we can configure as follows (rule name is test):
Then, when JSESSIONID is 1111, the generated transaction name is test?JSESSIONID=1111.
Transaction Tracing Threshold
Here you can set tracing thresholds specifically for transactions that have already occurred.
NoSQL Key Values
By setting keys (Key) that start with a certain string in the rules, the system will aggregate and display the names of NoSQL operations involving keys that start with that string, in the format: Operation+java*. For example, if you set the key to start with "java", the operation name will be displayed as follows:
Transaction Filtering
Transaction filtering can also be called transaction/service interface blacklist, that is, transactions/service interfaces added to the blacklist will no longer have their performance data collected by the system.
The response time of transactions and service interfaces is one of the important factors affecting application scores. A large number of slow transactions and slow service interfaces will directly reduce application performance scores. However, in some specific scenarios, such as long connections, batch processing, and other known slow transactions with high QPS and long response times, if you don't want their response times to affect application scores, you can configure to filter out specified transactions or service interfaces to avoid their impact on scores.
Add transactions or service interfaces that need to be filtered to the right list, click Submit, and the configuration will take effect without restarting the probe. Check the transaction checkbox above the list, and all transactions in the list will be selected; check the service interface checkbox above the list, and all service interfaces in the list will be selected.
Note: Transaction filtering is only supported by Agent Collector 3.4.5 and above, and service interface filtering is only supported by Agent Collector 3.5.3 and above. The list displays transactions and service interfaces with data in the last 30 minutes, excluding aggregated transactions/service interfaces, that is, aggregated transactions/service interfaces do not support filtering.
Hotspot Methods
-
Hotspot Method Learning
By default, the Agent monitors key methods set by Tingyun developers based on supported frameworks, protocols, database drivers, MQ drivers, etc., and embeds methods that may have performance bottlenecks, but does not include users' own business logic code. After enabling hotspot method learning, the Agent will autonomously learn methods in the application that are time-consuming and frequently called. The corresponding methods will be instrumented, and the Agent will be able to monitor more transaction stacks than under normal circumstances, ultimately displayed in the performance breakdown tables of transactions and background tasks as well as in tracing details. The "Hotspot" category will be added to performance classifications. It is disabled by default.
-
Whitelist
Users can add specified methods to the whitelist, and the probe will only autonomously learn methods in the whitelist.
-
Blacklist
The probe will not autonomously learn methods in the blacklist. Java basic packages will be displayed by default.
-
Learning Results
The more learning times, the higher the frequency of method calls and the longer the time consumption. The top 100 methods by learning times will be displayed in the learning results list. After clicking Enable on a method, the corresponding method will be embedded, and the probe will collect performance data, ultimately displayed in the performance breakdown tables of transactions, business interfaces, and background tasks as well as in tracing details. After clicking Disable, the probe will stop collecting performance data. After clicking Delete, the corresponding method will be deleted from the learning results. Check the checkbox in front of Select to select all methods for operation.
User Tracing
Please refer to the user tracing introduction under System Configuration.
Custom Instrumentation
Please refer to the custom Instrumentation introduction under System Configuration.
Data Items
When configuring data items for application configuration, you can associate specific transactions. When that transaction has slow tracing, you can see the Data Items tab in the tracing details.
Custom Metrics
Please refer to the custom metrics introduction under System Configuration.
Diagnostic Tools
Please refer to the introduction under System Configuration.
Instance Configuration
Instance settings can perform configuration management for each independent instance of each application, providing two configuration items: hotspot method monitoring and probe circuit breaker. They can inherit configuration values from the application level, or set their own configuration item values for specific instances.