Systems
A business system refers to a collection of applications that together complete a specific type of business (such as e-commerce systems, OA systems, email systems, etc.). A business system can contain one to multiple applications, and each application can only belong to one business system.
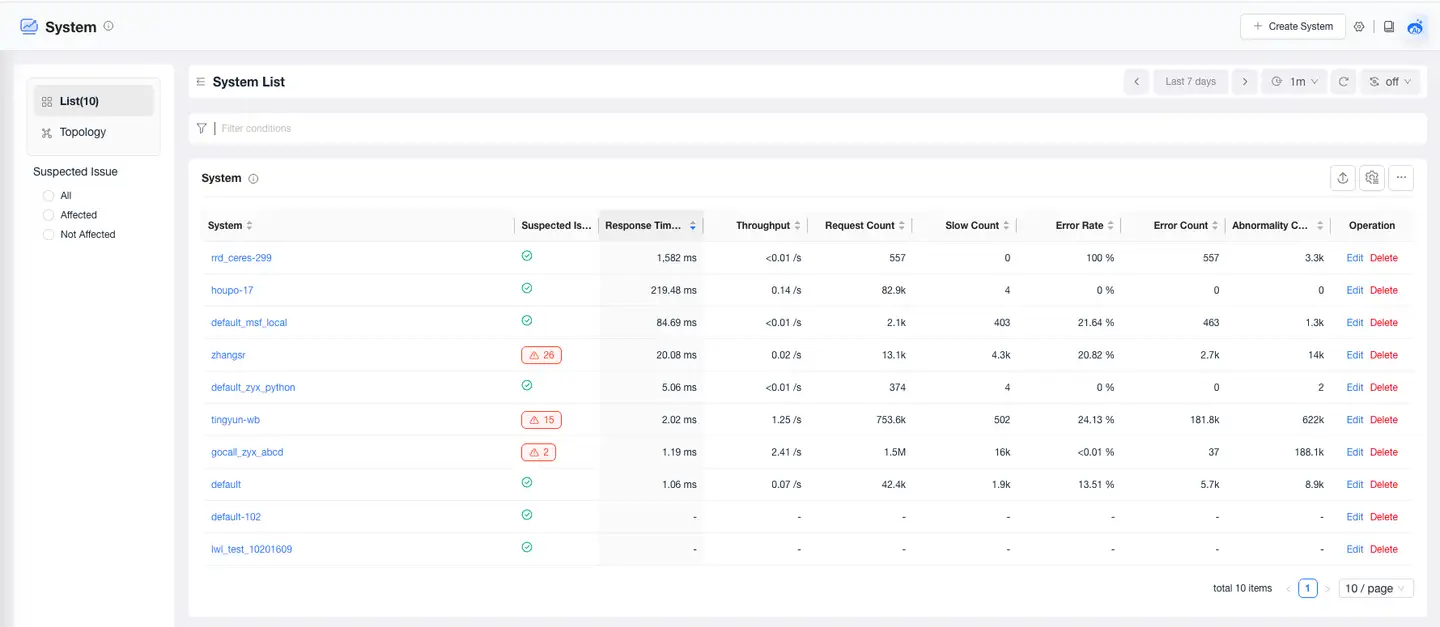
Business System List
The Business System List page displays all monitored business systems and their related performance metrics. Click the business system name in the list to enter the business system details page. It supports creating, editing, and deleting business systems. Business systems can be deleted when they have no data for 7 days.
Note: Performance metrics such as P50 response time, average response time, throughput, request count, slow request count, error rate, error count, exception count, etc., for business systems are only statistics for web requests and do not include background tasks.
Creating a Business System
Users can add related applications that jointly complete the same business to a newly created business system. Currently, there are two ways to create a business system: creating through the console and creating through a configuration file.
Creating via Console
- Click Business Systems in the left navigation bar to enter the business system list page.
- Click Create New Business System in the upper right corner.
- Configure in the Create New Business System dialog box that appears.
- Click Save to complete the creation.
Creating via Configuration File
Users can automatically create business systems in the console through the UniAgent's oneagent.conf configuration file. This UniAgent will upload data to this business system by default.
Creation Method: Before the first startup of UniAgent, modify the default_business_system configuration item in the file /opt/tingyun-oneagent/conf/oneagent.conf. The default value is "default". If you fill in a new business system, it will be newly created and displayed in the business system list or topology, as well as in the Business System dropdown menu on the UniAgents Management > Add page. If you fill in an existing business system, you can specify the business system to which the UniAgent uploads data by default.
After UniAgent starts, if you want to modify the business system to which the Agent belongs, you can directly modify it in the console.
Topology Map
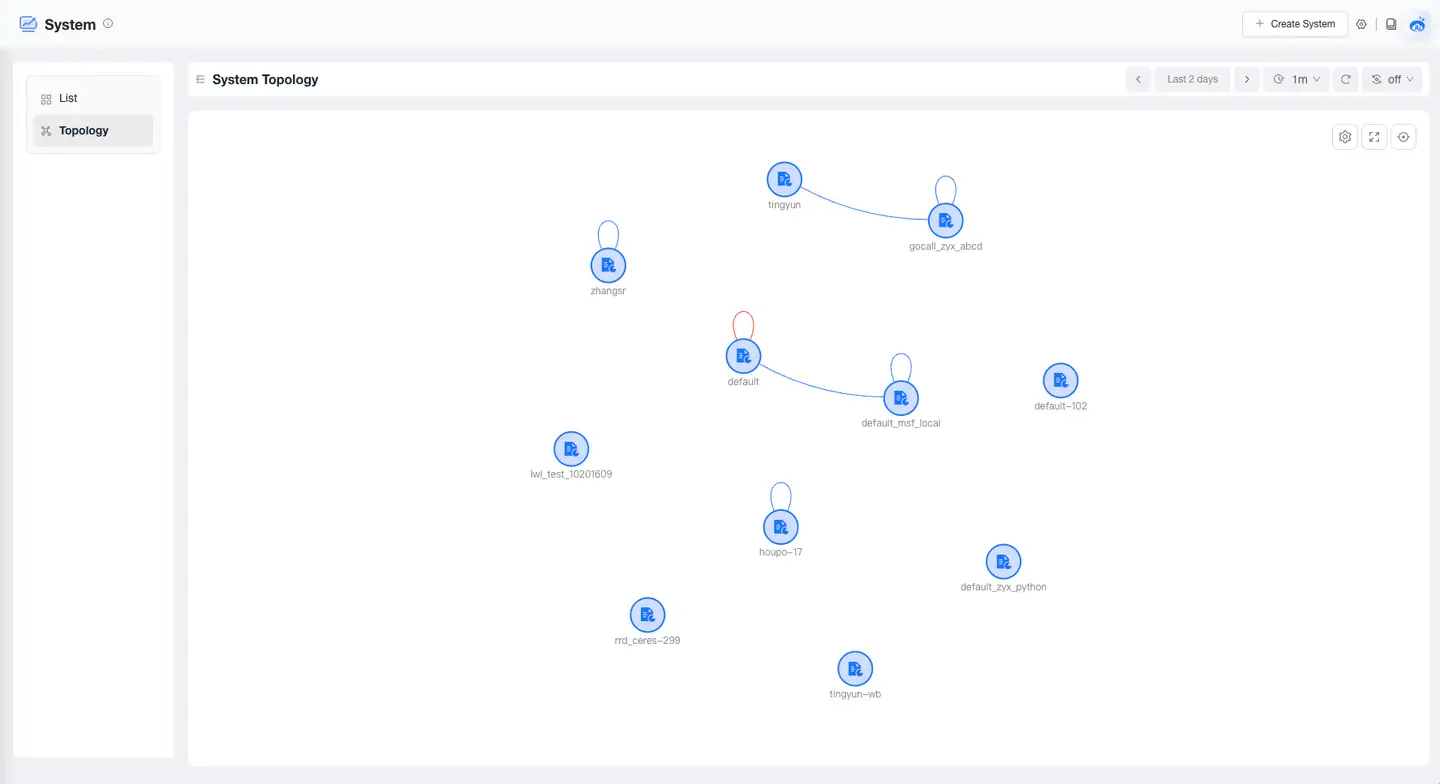
Click the Topology tab in the upper left corner of the Business System page to switch to the global business system topology map page. The global business system topology visually displays the complex invocation relationships between various business systems using icons and connecting lines, along with relevant performance metrics. This helps users quickly locate faults when performance issues occur.
The business system topology interface includes: the topology map display area and the operations in the upper right corner, as shown in the following figure:
Topology Map
By default, it shows the mutual invocation relationships between all business systems, including web requests and background task calls.
-
The color of the icons represents suspected issues: normal nodes are displayed in blue, problem nodes in yellow, and root cause nodes in red.
-
Click on a business system icon to display its details. You can view the topology map, suspected issues, distributed traces, basic information, and other content for that business system.
-
Clicking on a connecting line will display the upstream and downstream service invocation information and trace information between the two business systems in a drawer panel.
Connection Details
By default, it displays the call analysis and distributed traces between the two business systems.
Call Analysis
By default, it shows the applications of the upstream business system, the applications of the downstream business system, and related metrics. The metric data reflects the performance of the downstream service when called by the upstream service.
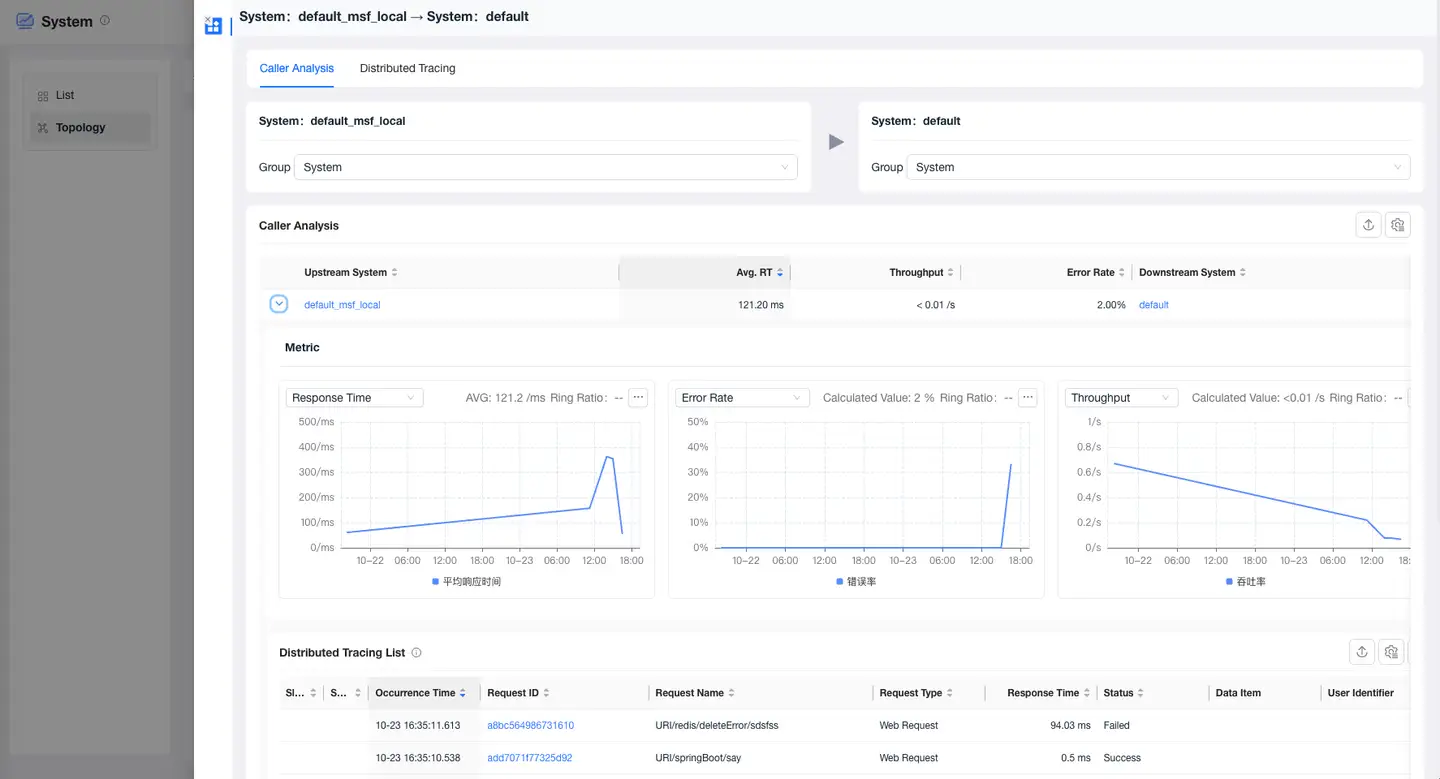
- Both upstream and downstream services support grouping by application, request, or instance. When the upstream service is grouped by request, the call analysis list will display data grouped by request dimensions.
- Expand to view trend charts for Average Response Time, Error Rate, and Throughput, as well as traces for the downstream service.
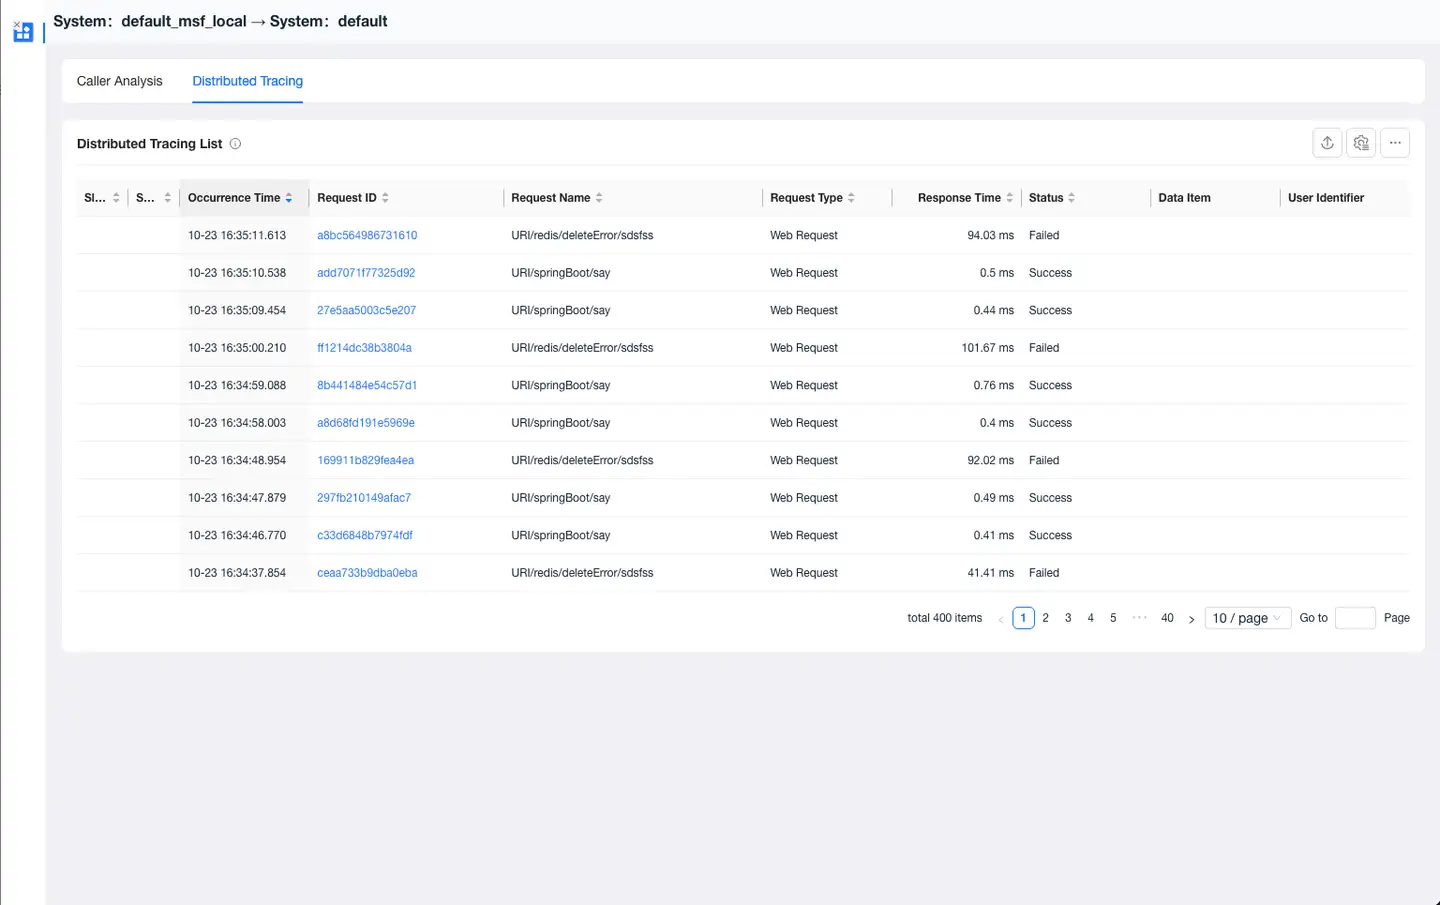
Distributed Tracing
Displays the list of distributed traces for the downstream business system when it is called by the upstream business system.
Operations
Use the various buttons to operate the topology map.
- Settings:
- Hide Isolated Nodes
- Full Screen
- Legend
Business System Overview
The Business System Overview page provides you with a comprehensive performance view of the business system, including tags, attributes, problems, metrics, and relationships. Through this page, you can quickly understand the performance trends of the business system and the upstream and downstream call relationships, helping you quickly locate issues and optimize business system performance.
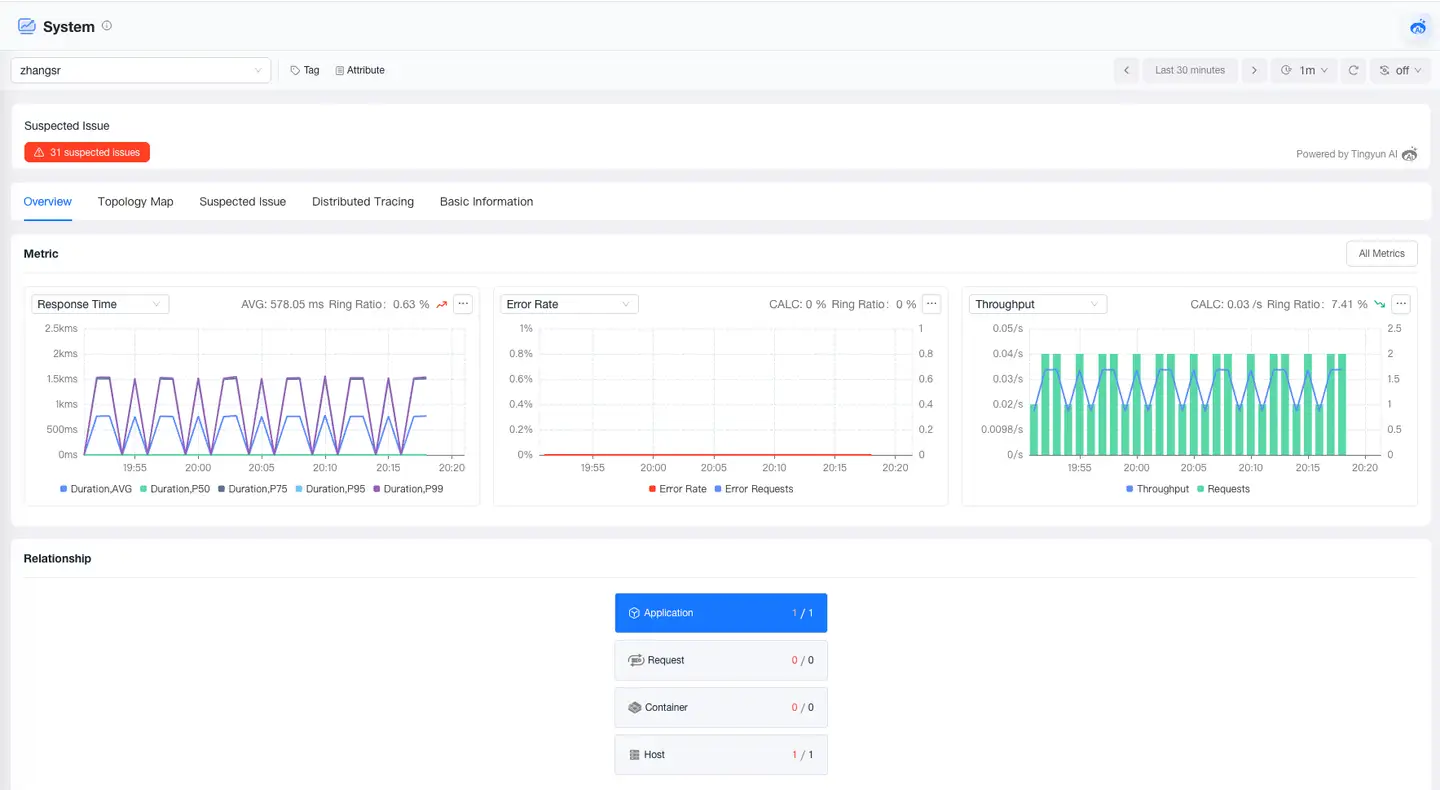
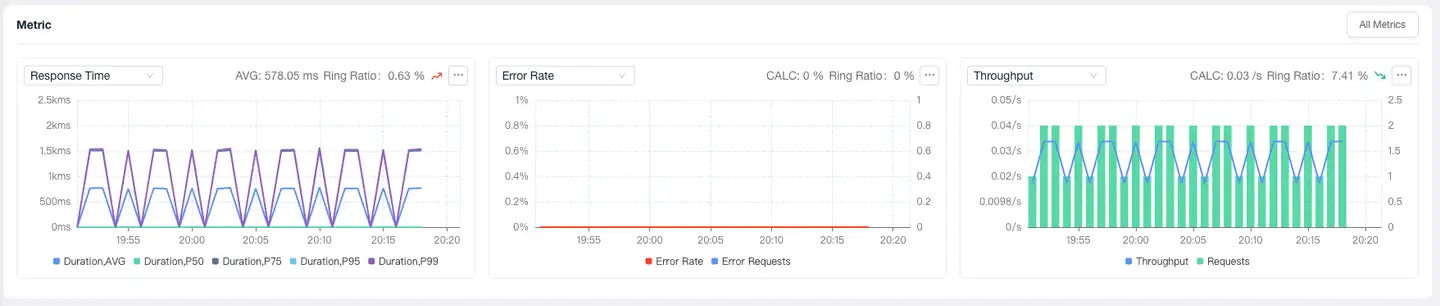
Metrics
The Metrics module displays key metrics of the business system, including trend charts of response time, error rate, and throughput metrics. It supports clicking All Metrics to view trend charts of all metrics of the business system.
Relationships
The Relationships module displays the call relationships of the current business system, from left to right are the callers, the vertical dependencies of the current business system, and the downstream business systems called.
- Caller Area: Displays the business systems that call the current business system and their count. When clicking a caller business system, a list of caller business systems is displayed below. Click the business system name in the list to view the overview of that business system.
- Current Business System: Displays the applications, requests, containers, and hosts under the current business system. Click a card to display the corresponding entity list below.
- Downstream Business Systems: Displays the business systems called by the current business system and their count. When clicking a caller business system, a list of caller business systems is displayed below. Click the business system name in the list to view the overview of that business system.

Business System Topology Diagram
The business system topology diagram displays the logical invocation relationships between active applications, service components, and other related business systems within the current business system, as well as access situations from front-end browsers, Mobile, Web, and Mp to applications. Each application, service component, and end-user is represented by an icon, with arrowed connecting lines showing the invocation relationships between applications, between applications and service components, and between applications and business systems, etc.
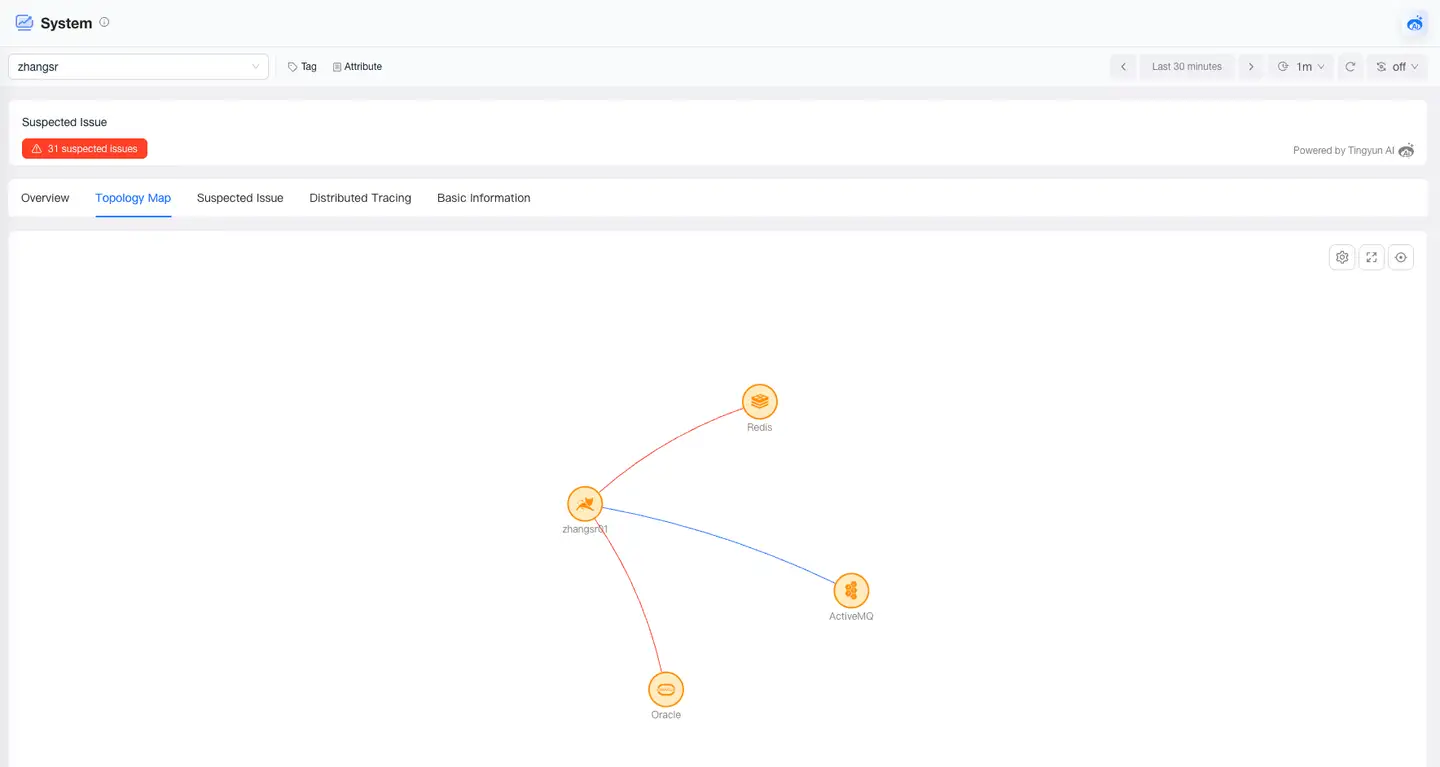
- Icon colors represent suspected issues: normal nodes are displayed in blue, problem nodes in yellow, and root cause nodes in red.
- Click on a node icon to display node details, where you can view metrics, suspected issues, distributed traces, basic information, and other content.
- Clicking on a connecting line will display upstream and downstream service invocation information, error analysis, and trace information between applications, between applications and service components, and between applications and business systems, etc., in a drawer panel.
Connection Details
By default, it displays the invocation relationships between applications, between applications and service components, and between applications and business systems, etc.
Call Analysis
By default, it shows upstream applications, downstream applications, and related metrics. The metric data reflects the performance of the downstream service when called by the upstream service.
- Both upstream and downstream services support grouping by application, request, or instance. When the upstream service is grouped by request, the call analysis list will display data grouped by request dimensions.
- Expand to view trend charts for Average Response Time, Error Rate, and Throughput, as well as traces for the downstream service.
Distributed Tracing
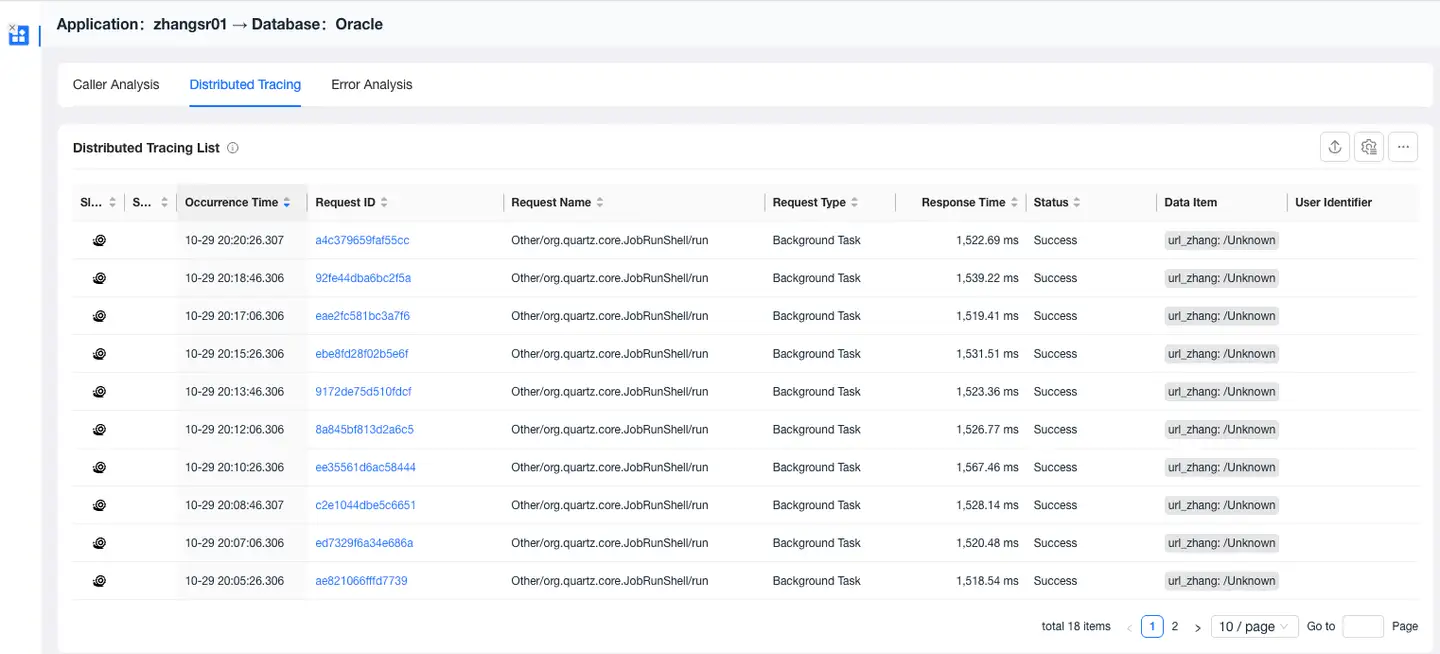
Displays the list of distributed traces for the downstream service when it is called by the upstream service.
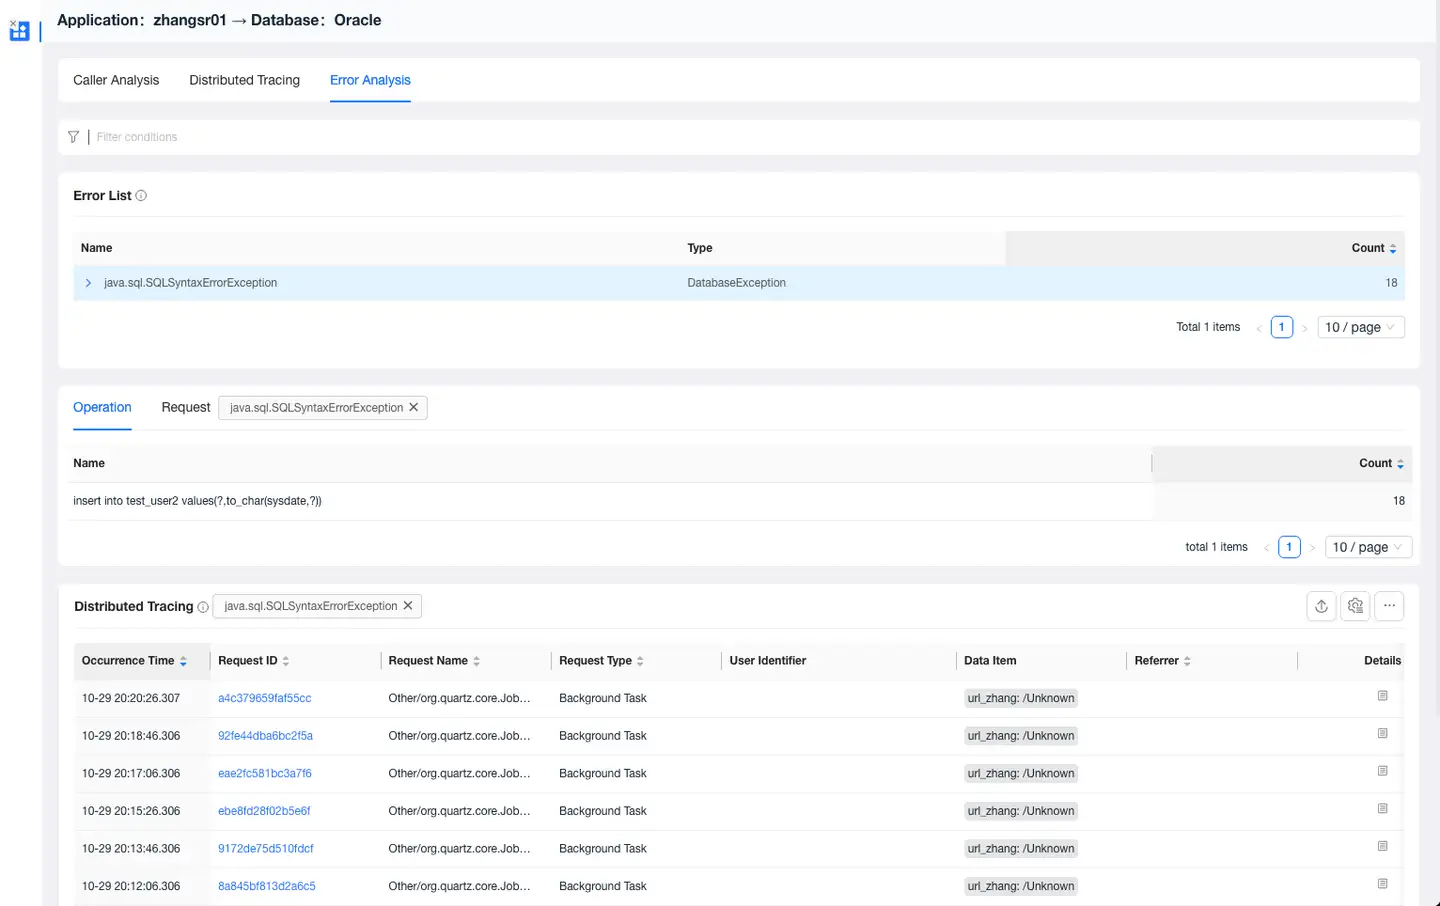
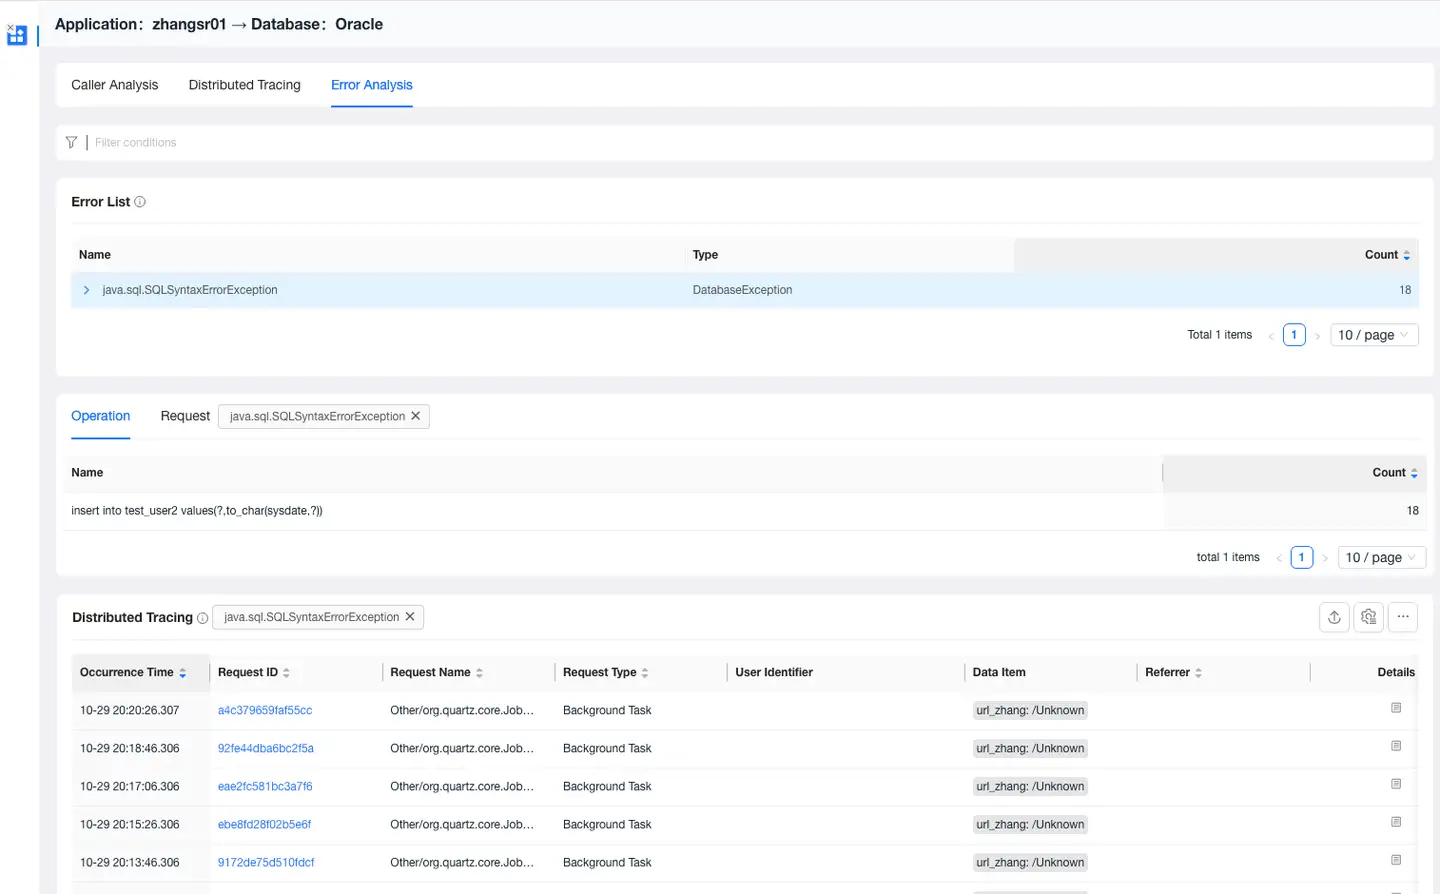
Error Analysis
Displays error details for the downstream service when called by the upstream service, including error information, messages, affected requests, and error trace lists.
Operations
Use the various buttons to operate the topology diagram.
- Settings:
- Hide Isolated Nodes
- Merge Database
- Merge MQ
- Merge HTTP Services
- Merge RPC Services
- Merge GenAI
- Merge Applications from Other Business Systems
- Display Node Count
- Full Screen
- Legend
The drawing of invocation relationships in the topology diagram and the metrics both rely on data collected by the caller application, and use data from the X-Tingyun-Data response header returned by downstream services to link invocation relationships and calculate metrics.
-
Relationship Discovery: The system draws invocation relationships by parsing the content of the caller's Span.
-
Metric Calculation: All metrics on the connecting lines are aggregated and calculated based on the caller's Span data, not the performance metrics of the downstream service.
-
Abnormal Situations:
- When distributed trace data has more requests than call analysis, possible reasons:
- When some requests from downstream services do not return tx_Data, the connecting lines and call analysis lack some performance data, while the distributed trace list data is complete.
- When distributed trace data has fewer requests than call analysis, possible reasons:
- Sampling function is enabled
- Probe circuit breaker
- Transaction filtering function is enabled
- When an application calls another application, and there is no data or missing data when selecting the request dimension for upstream services in call analysis, possible reasons:
- The request is an RPC call or MQ consumer
- If "Last XX" time range is selected, metric data and trace data may be inconsistent due to deviations in data storage timing.
- When downstream services encounter errors, the topology diagram connecting lines may show no errors, possible reasons:
- When distributed trace data has more requests than call analysis, possible reasons:
Problems
The Problems page displays problems of the business system, including problem description, impact scope, and possible causes, helping users quickly identify potential failures. Click Problem ID to view information such as the root cause and impact scope of the problem.
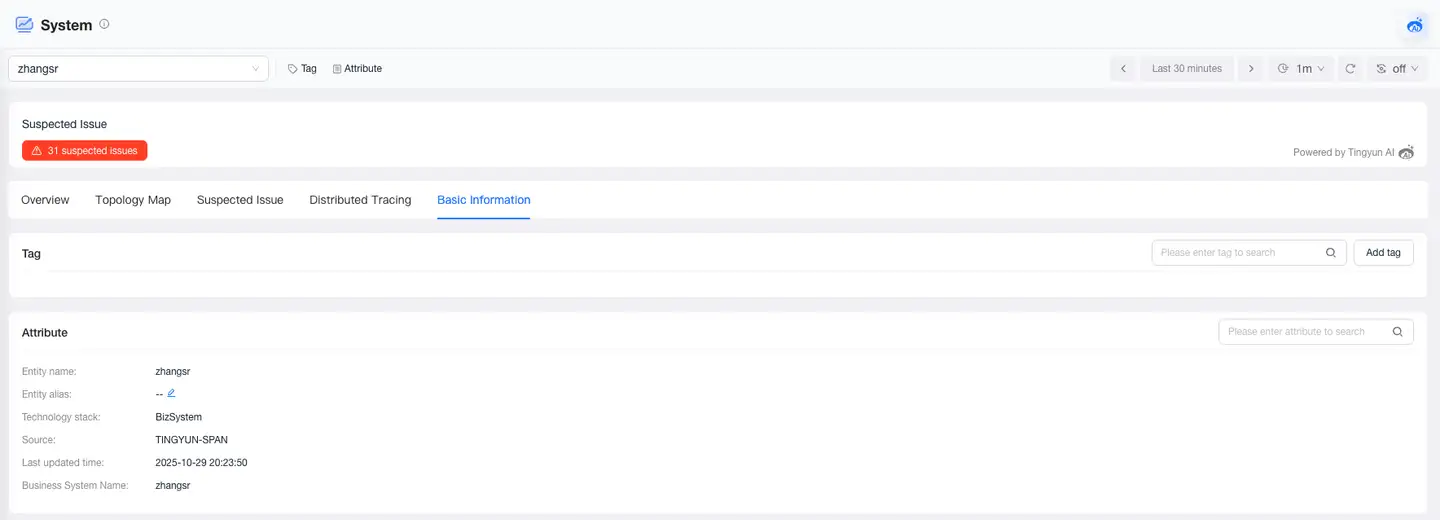
Basic Information
The Basic Information page displays the tags and attributes of the business system. The Tags module shows the key and value of tags and supports users in adding or deleting tags. The Attributes module displays the attribute information of the business system, such as name, alias, and other information.