Applications
The Applications module provides comprehensive analysis of applications from aspects such as metrics, Topology, events, logs, traces, and security.
Application List
The Application List page displays all monitored applications, including applications with TingYun application & microservice Agents installed, and applications monitored by integrated third-party Agents. The list items include performance metrics such as application name, problems, P50 response time, throughput, request count, slow request count, error rate, error count, and exception count.
Note: Performance metrics such as P50 response time, throughput, request count, slow request count, error rate, error count, and exception count for applications/instances are only statistics for web requests and do not include background tasks.
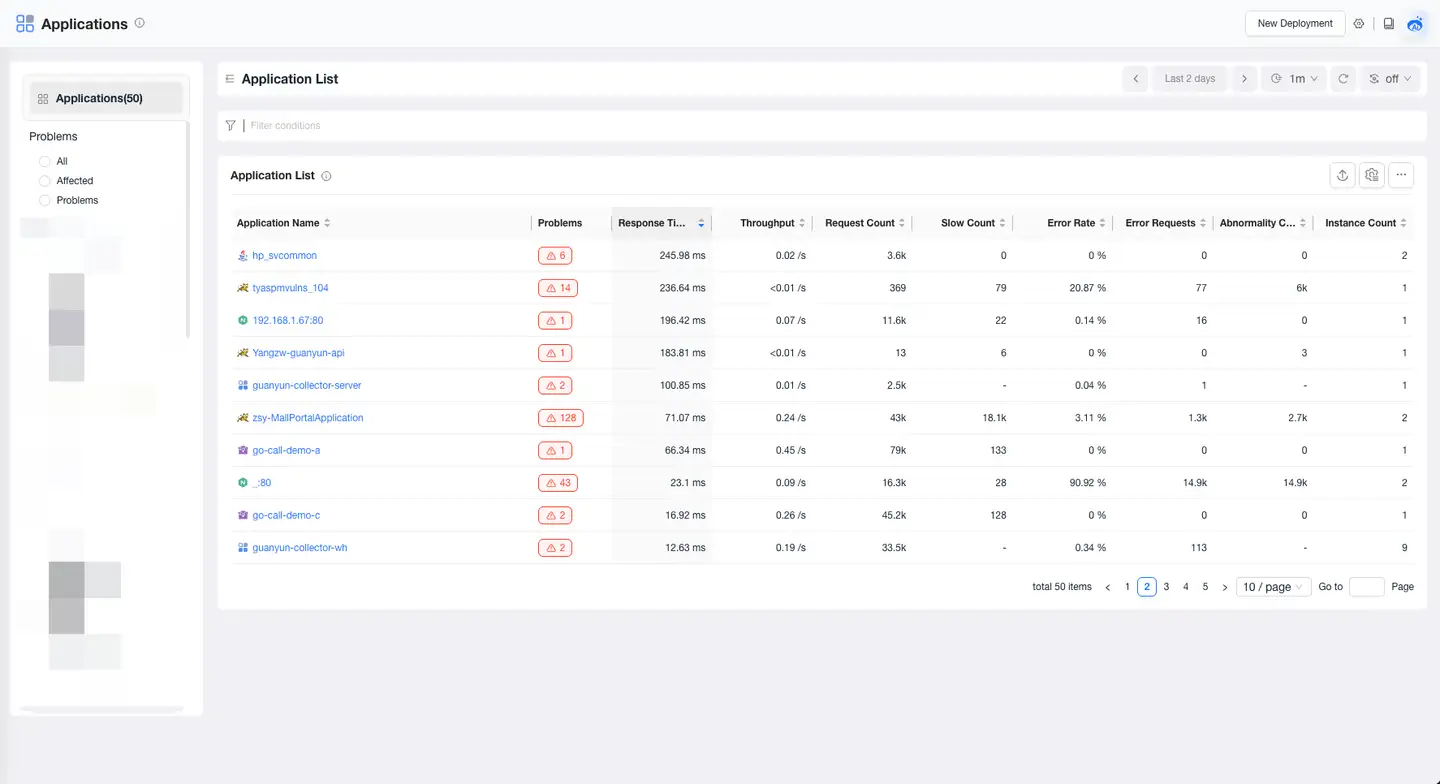
In the application list, you can perform the following operations:
-
Click the application name to enter the overview page of the target application.
-
On the left side of the page, you can filter applications by whether they are affected by problems and by technology stack.
-
Click the filter box to filter applications by Application Name, Business System, Problems, Technology Stack, and Tags.
-
Click Customize Header in the upper right corner of the list to select the columns you want to display. Some fields are mandatory.
-
Click Export in the upper right corner of the list to export the application list in CSV format. When filter conditions are set, the filtered application list is exported.
-
Click Add to Dashboard in the upper right corner of the list to add the application list to the dashboard for viewing.
Application Overview
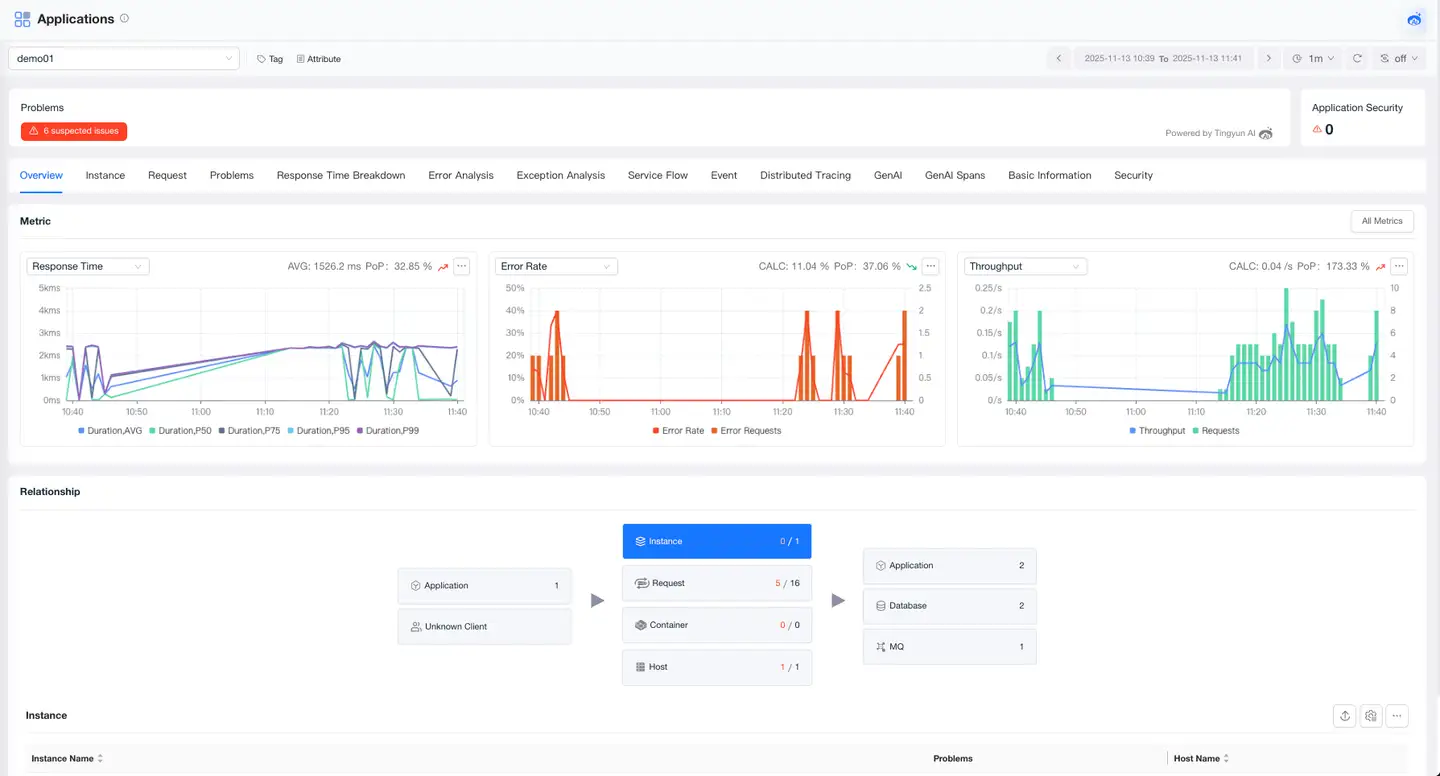
The Application Overview page provides you with a comprehensive performance view of the application, including tags, attributes, problems, metrics, and Topology. Through this page, you can quickly understand the performance trends of the application and the upstream and downstream call Topology, helping you quickly locate problems and optimize application performance.
Tags
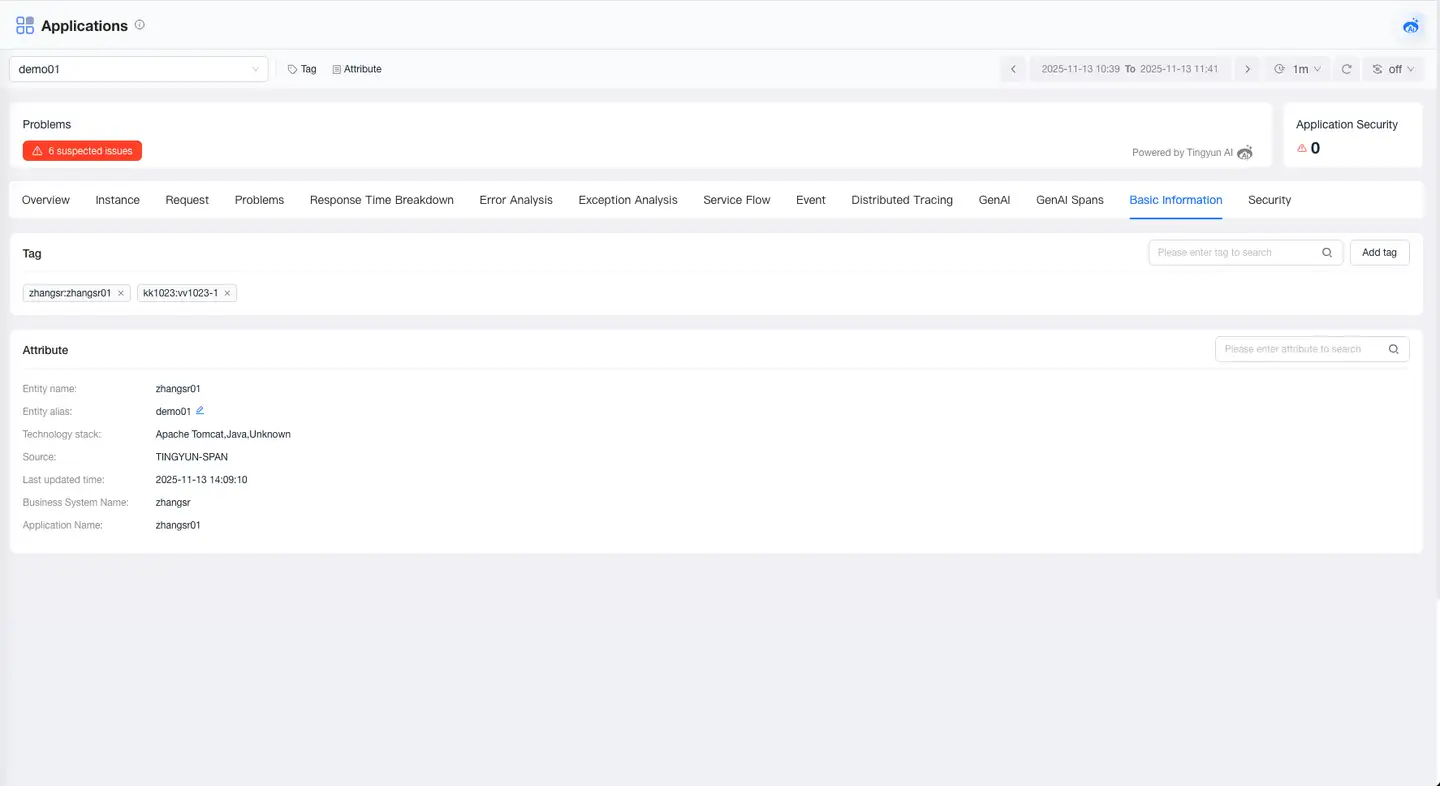
The Tags module displays the list of tags configured for the current application and supports users in dynamically adding or deleting tags, making it convenient to classify, filter, and manage applications through custom tags, improving operational efficiency.
Attributes
The Attributes module displays the basic attribute information of the application, including application name, alias, associated business system, technology stack, and other key metadata, helping users quickly understand the basic configuration and affiliation of the application.
Problems
Real-time display of the number of unresolved problems and the number of detected security vulnerabilities in the current application. You can click the Problems card to directly jump to the Problem page to investigate the root cause, ensuring application stability.
Metrics
The Metrics module displays key metrics of the application, including trend charts of core metrics such as response time, error rate, throughput, and supports clicking All Metrics to view all metrics of the application.
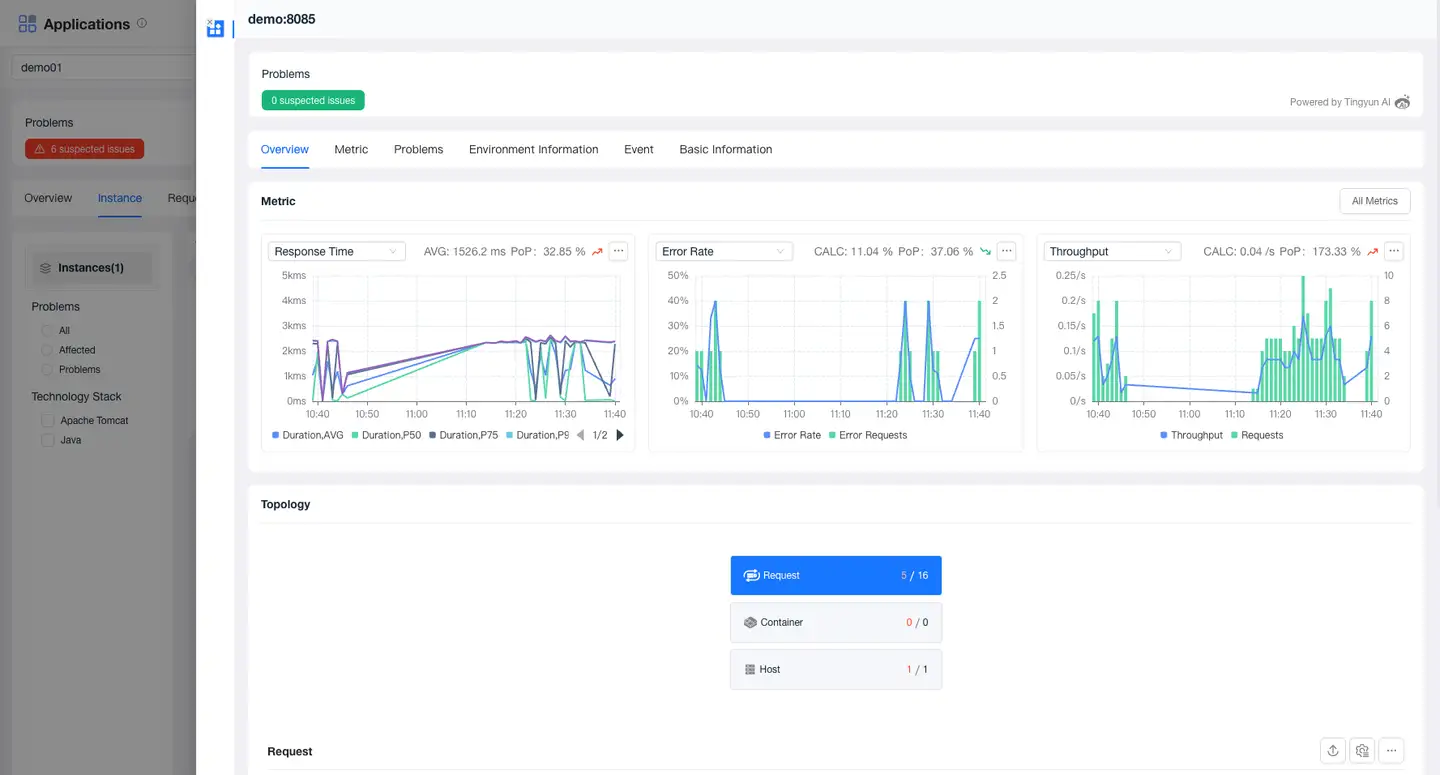
Topology
The Topology module displays the upstream and downstream call chain of the application through a visual topology diagram, including upstream callers such as Mobile, Web, Mini Program, and applications, the instances, containers, and host resources on which the current application runs, as well as downstream applications, databases, message queues, and external services called. It supports clicking to view the performance metrics of each node, providing a comprehensive understanding of the application's call Topology in the overall architecture.
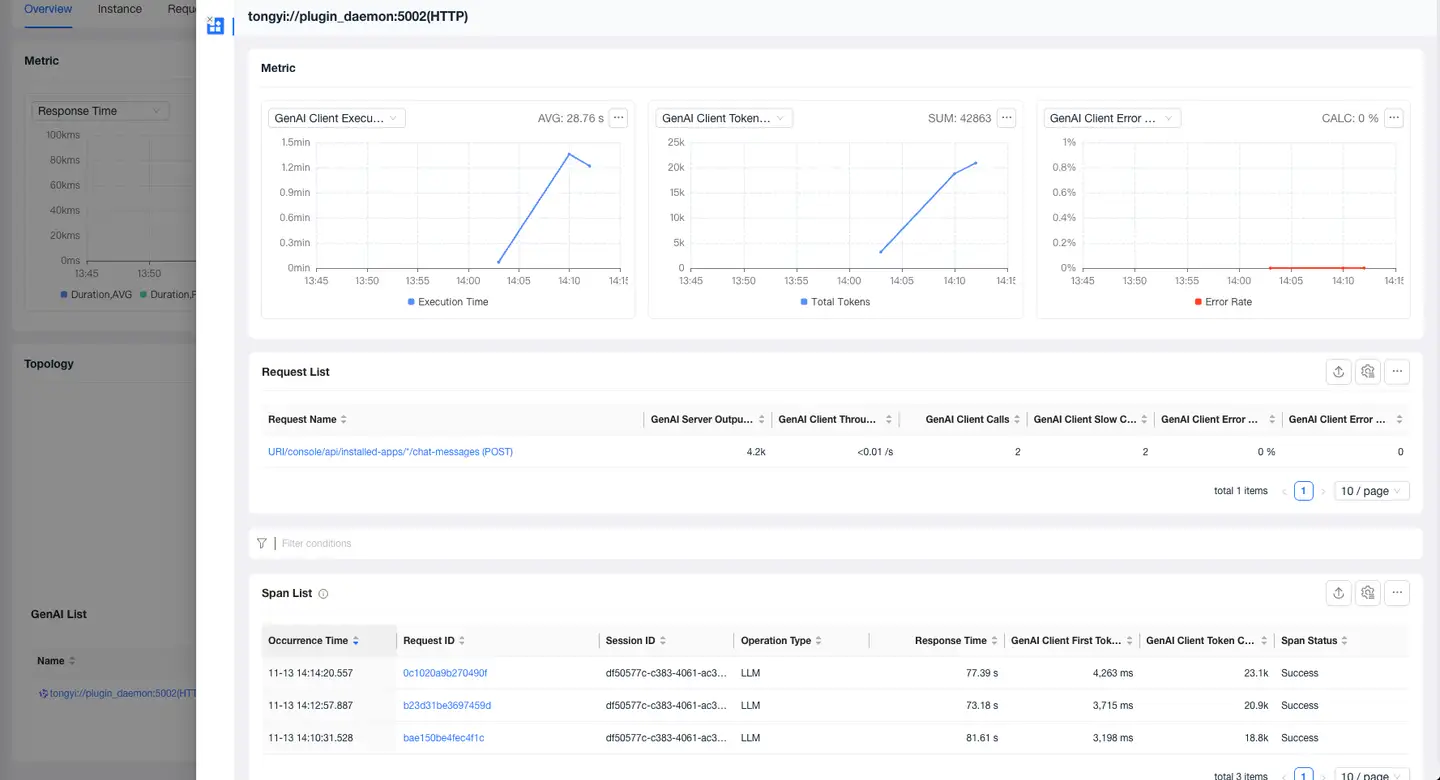
GenAI
The GenAI List displays all AI models called by the current application, allowing users to view comprehensive GenAI metrics, including GenAI Client Execution Time, GenAI Client First Token Time, GenAI Client Tokens, GenAI Client Input Tokens, GenAI Server Output Tokens, GenAI Client Calls, GenAI Client Throughput, GenAI Client Error Rate, GenAI Client Errors, and GenAI Client Slow Requests.
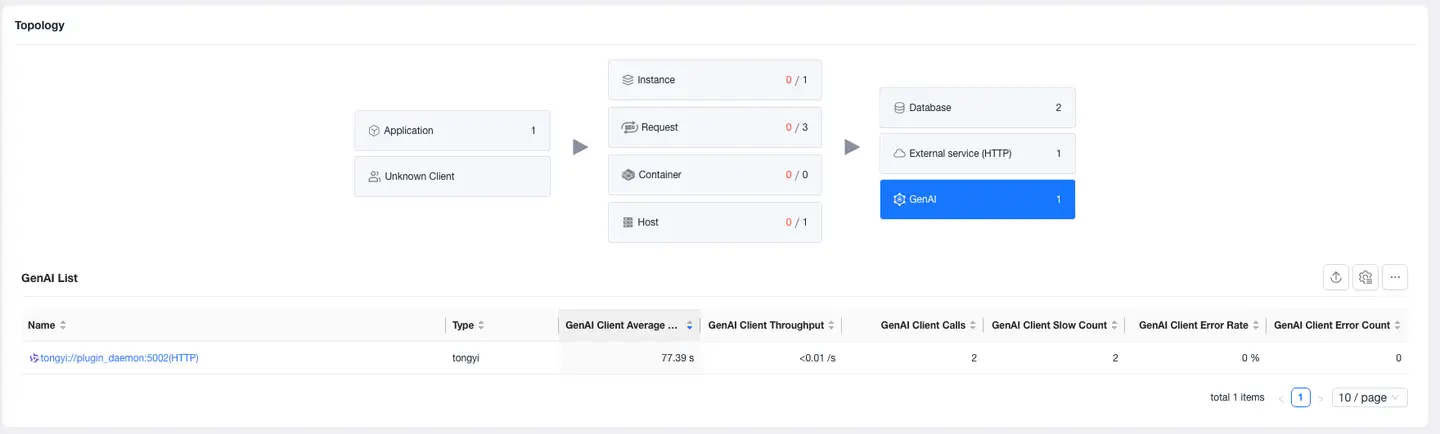
Click the name to view the metrics of the current AI model, the requests to the current model, and the Span list on the detail page.
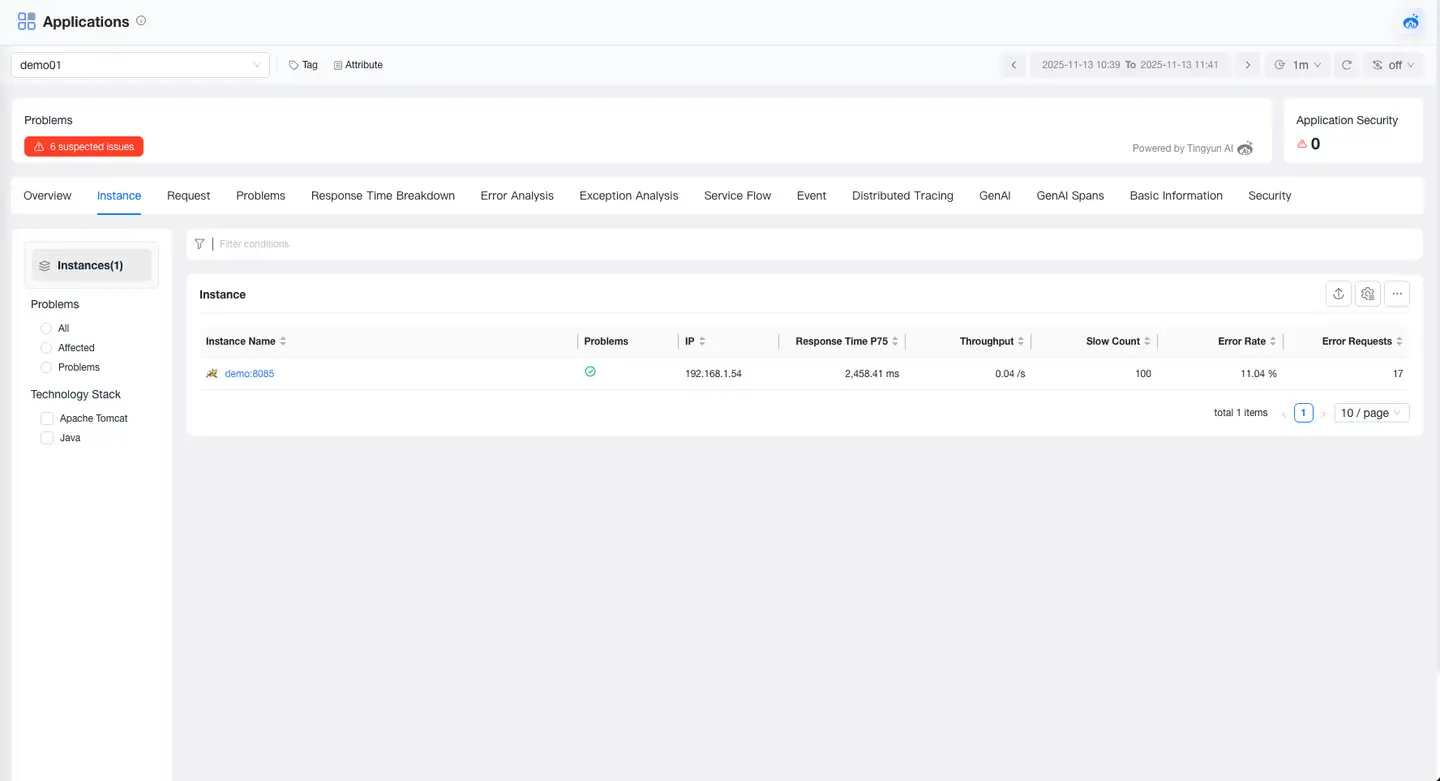
Instances
Instance List
The Instance List displays all monitored instances with heartbeats for the current application, including instances with TingYun application & microservice Agent installed, and instances monitored by integrated third-party Agents. Click Instance Name to enter the overview page of the target instance.
Instance Overview
The Instance Overview provides you with a comprehensive performance view of the instance, including tags, attributes, problems, metrics, and Topology. Through this module, you can quickly understand the performance trends of the instance and the upstream and downstream call Topology, helping you quickly locate problems and optimize instance performance.
JVM
The JVM page provides various statistics and charts of the JVM runtime environment for Java applications, including metrics such as memory, threads, Classes, CPU, and thread pools.
Environment Information
The Environment Information page displays the IP address, Agent version, last update time (the last time the Agent was initialized and started), and environment information of the application instance.
- Runtime Environment: Displays the memory, threads, operating system, JVM virtual machine, and other information of the host where the current application instance is located.
- System Environment Variables: Displays the environment variable settings of the host where the current application instance is located.
- JVM System Properties: Displays the system properties of the JVM on which the current application instance is running.
- JAR Package Information: Displays information about the JAR packages and versions in the Agent installed for the current application instance. JAR package information is not displayed when the Agent has no data.
- Instrument Detail: Displays the custom instrumentation details of the instance.
- Container: Displays information about the container in which the probe is deployed.
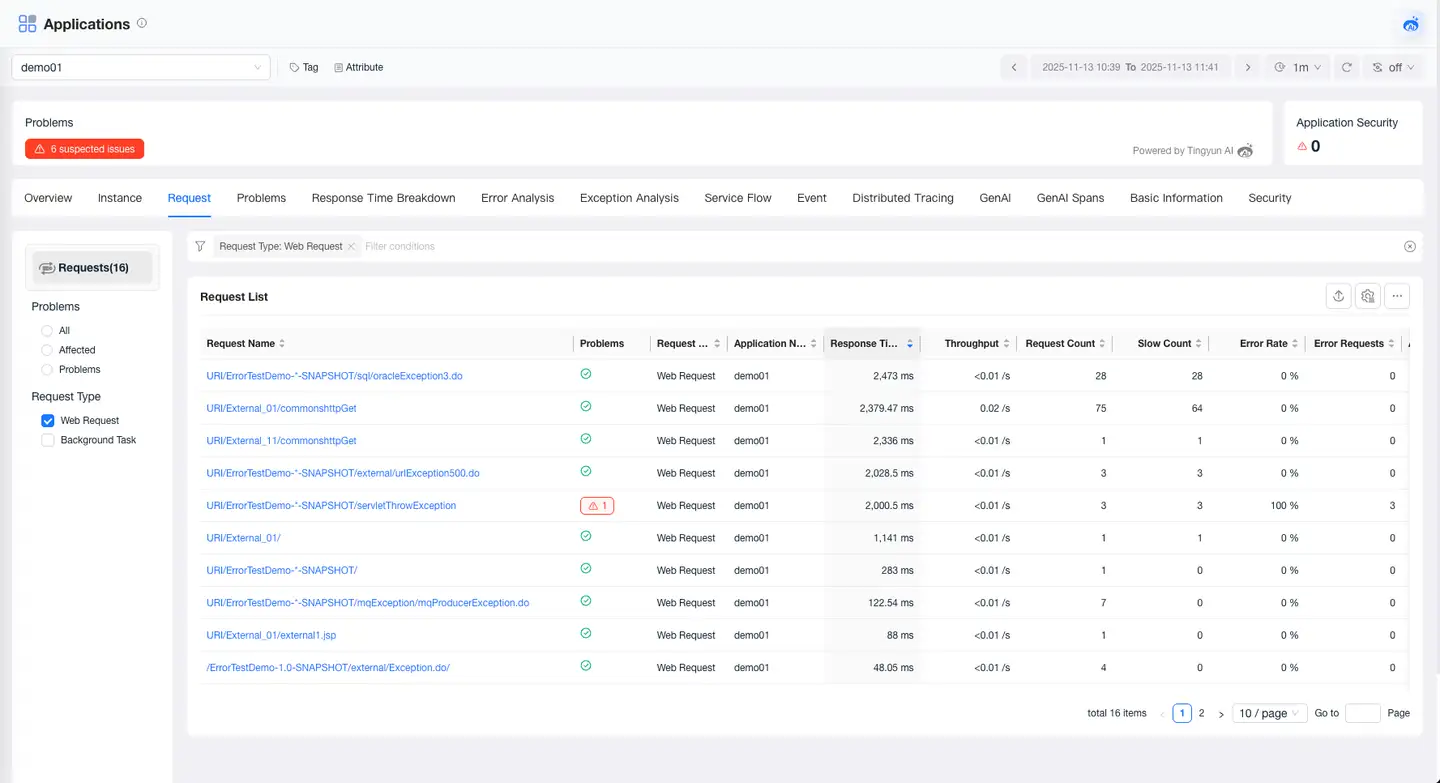
Requests
The Request page displays all requests under the application, as well as information such as the metrics, Topology, problems, tags, and attributes of these requests.
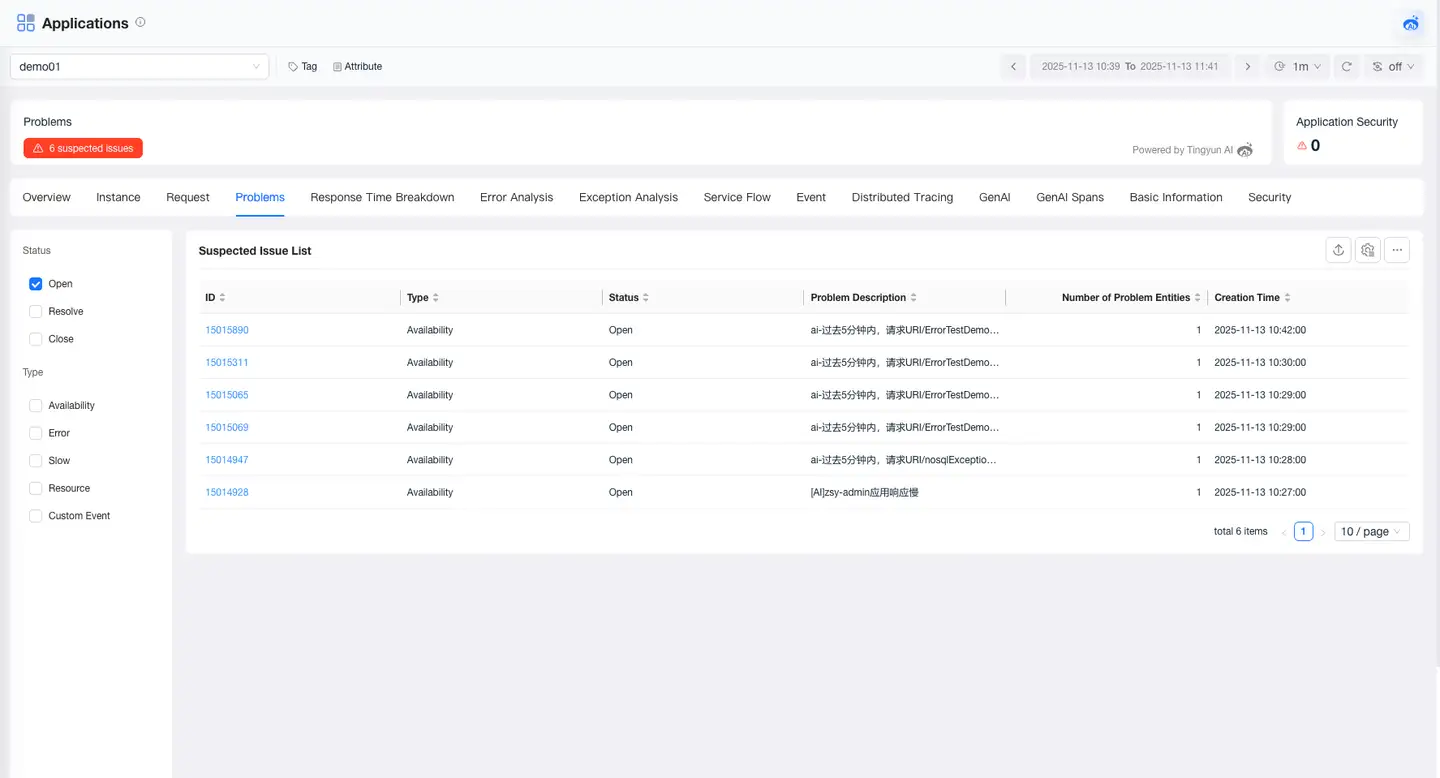
Problems
The Problems page displays the problems of the application, including problem description, impact scope, and possible causes, helping users quickly identify potential failures. Click Problem ID to view information such as the root cause and impact scope of the problem.
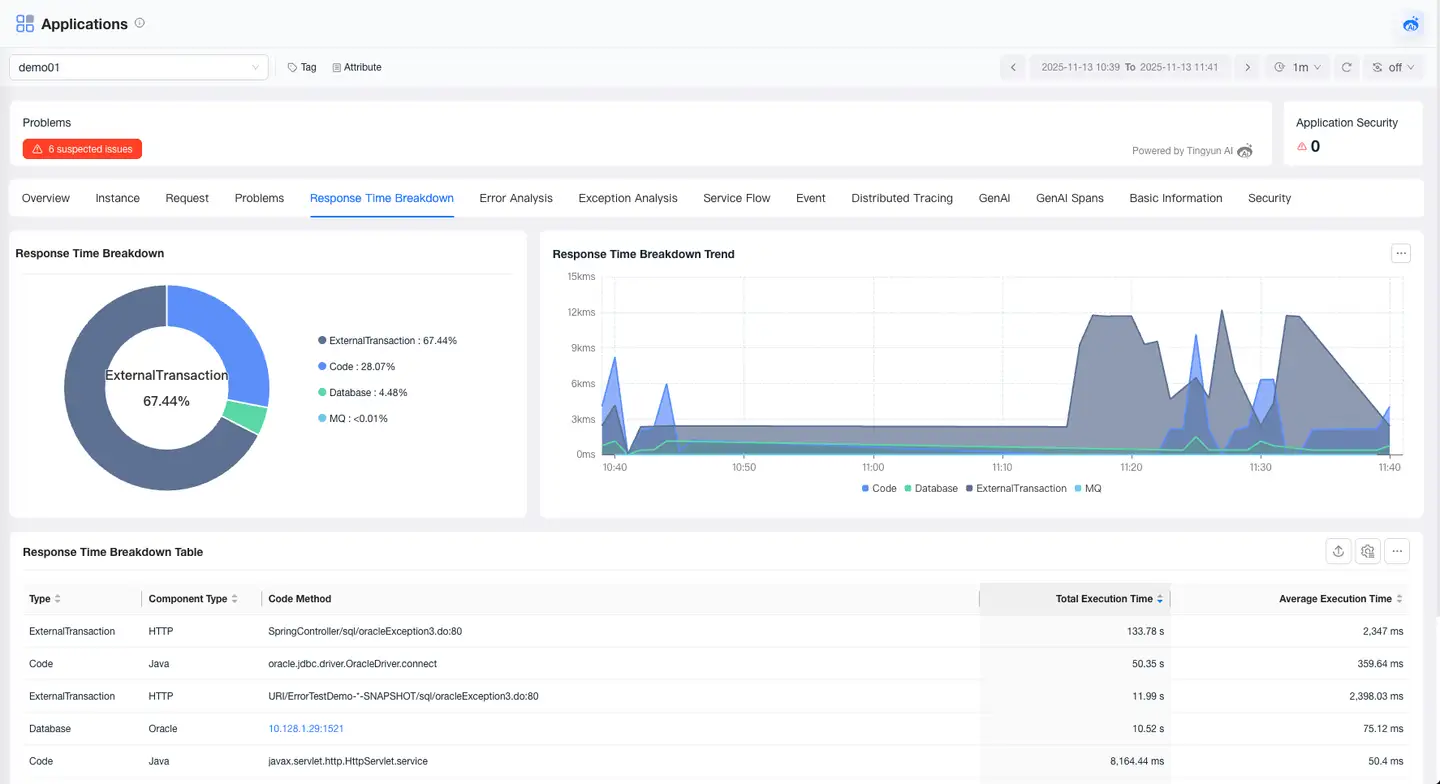
Response Time Breakdown
The Response Time Breakdown feature helps you deeply analyze the composition of your application's response time, accurately pinpointing performance bottlenecks. It supports breaking down response time from the dimensions of Code, Database, MQ, External Services, and GenAI, and provides detailed analysis capabilities to help you quickly optimize performance bottlenecks.
Error Analysis
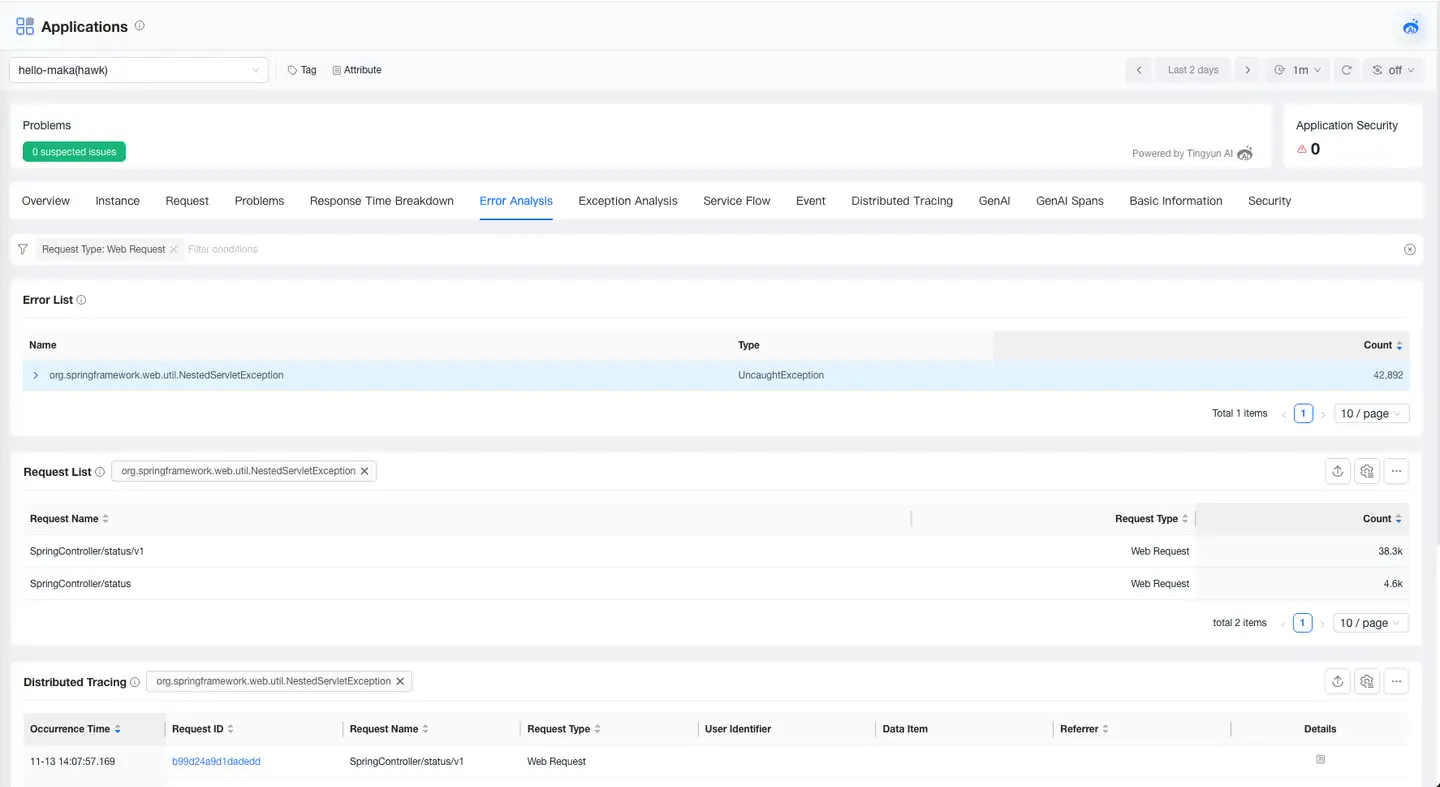
The Error Analysis page allows you to view all error information that occurs in the current application, locate the impact scope and root cause of errors, and supports viewing the trace of the error.
Exception Analysis
The Exception Analysis page allows you to view all exception information that occurs in the current application, locate the impact scope and root cause of exceptions, and supports viewing the trace of the exception.
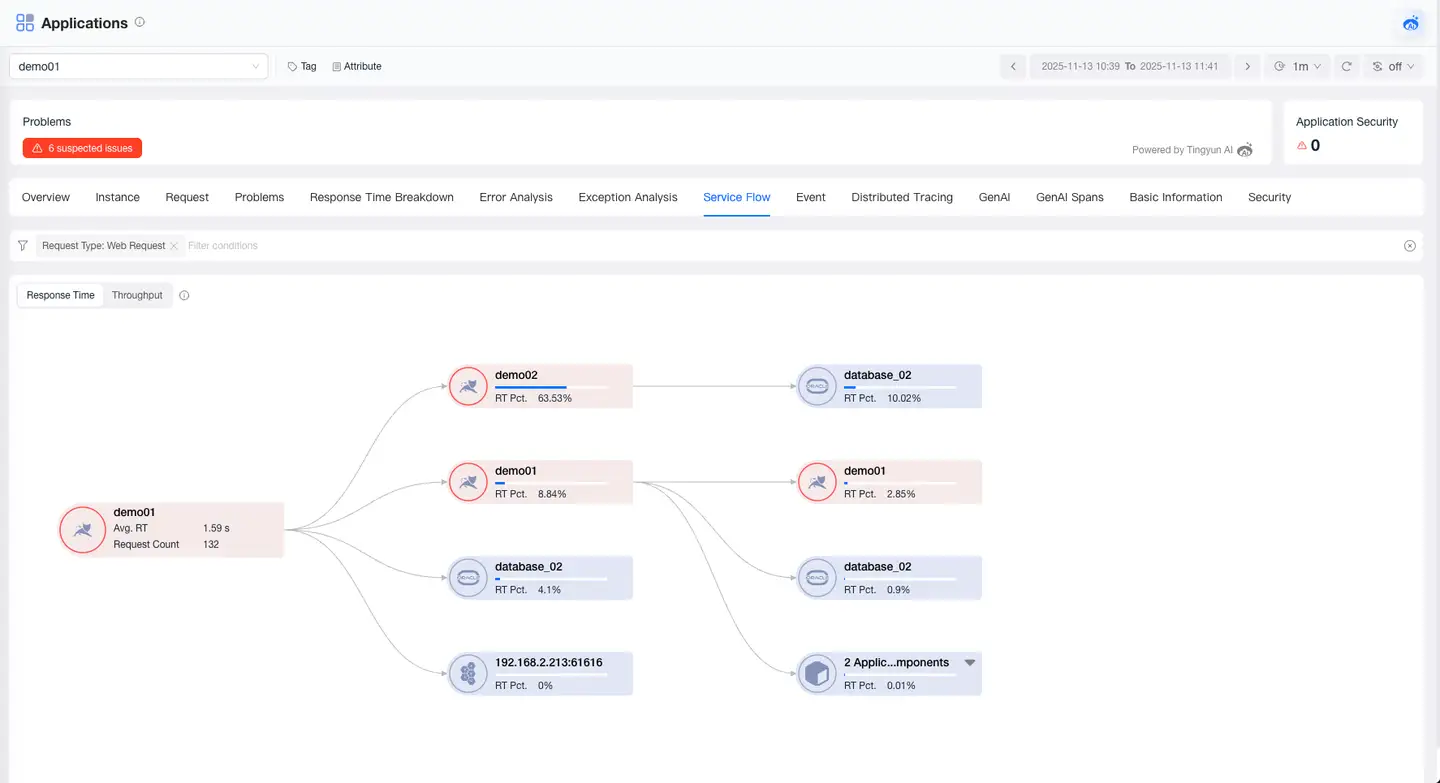
Service Flow
Service Flow displays the dependencies and performance metrics between applications and components in the application. It helps you:
- Understand the order and dependencies of application and component calls
- Locate performance bottlenecks and see which applications affect the overall response time
- Identify busy applications and components
Events
The Events page displays various events of the application, including types of events such as Agent circuit breaking, alerts, and process restarts. The event list includes information such as event start time, event classification, event level, event description, and event status.
Basic Information
The Basic Information page displays the tags and attributes of the application. The Tags module shows the key and value of tags and supports users in adding or deleting tags. The Attributes module displays the attribute information of the application, such as name, alias, and technology stack.