Session Analysis
Session Analysis integrates all operations performed by users across multiple platforms, comprehensively analyzing user transitions between mini programs, browsers, and mobile applications from a session dimension to understand user behavior patterns. If you want to analyze session data from a single source (such as mobile applications or browsers), you can filter through global filter conditions.
Terminology
A session (also called "access path") refers to a series of continuous interactive operations performed by users in an application, which occur within a limited time frame. In a single session, users may perform various operations, such as browsing different pages, initiating requests to third-party content, interacting with services, and performing various user-defined operations. Each user session contains at least one such action. Through the "User Journey > Session Analysis" functionality, you can gain in-depth understanding and analysis of various session dimension data, which helps identify user behavior patterns, optimize user experience, and further improve application performance.
Regarding session start and end, the following is explained:
-
Session Start: The first user operation after application launch serves as the session start point.
-
Session End
- App Side
- Mobile device idle for 10 minutes
- When you actively close the operating system or forcibly stop the application
- When calling the startNextSession interface to end
- Web Side
- Browser in inactive state for 35 minutes
- When you close the browser
- When session duration reaches 8 hours
- When calling the startNextSession interface to end
- App Side
Regarding other performance metrics, the following is explained:
-
User Session: Records a complete, purpose-driven series of interactive operations by a user.
-
Session Duration: Statistics from the "session start point" to the "completion of the last interactive operation in the session."
-
Interaction Count: Statistics of the total number of application launches, click operations, and page loads generated by users in the session.
-
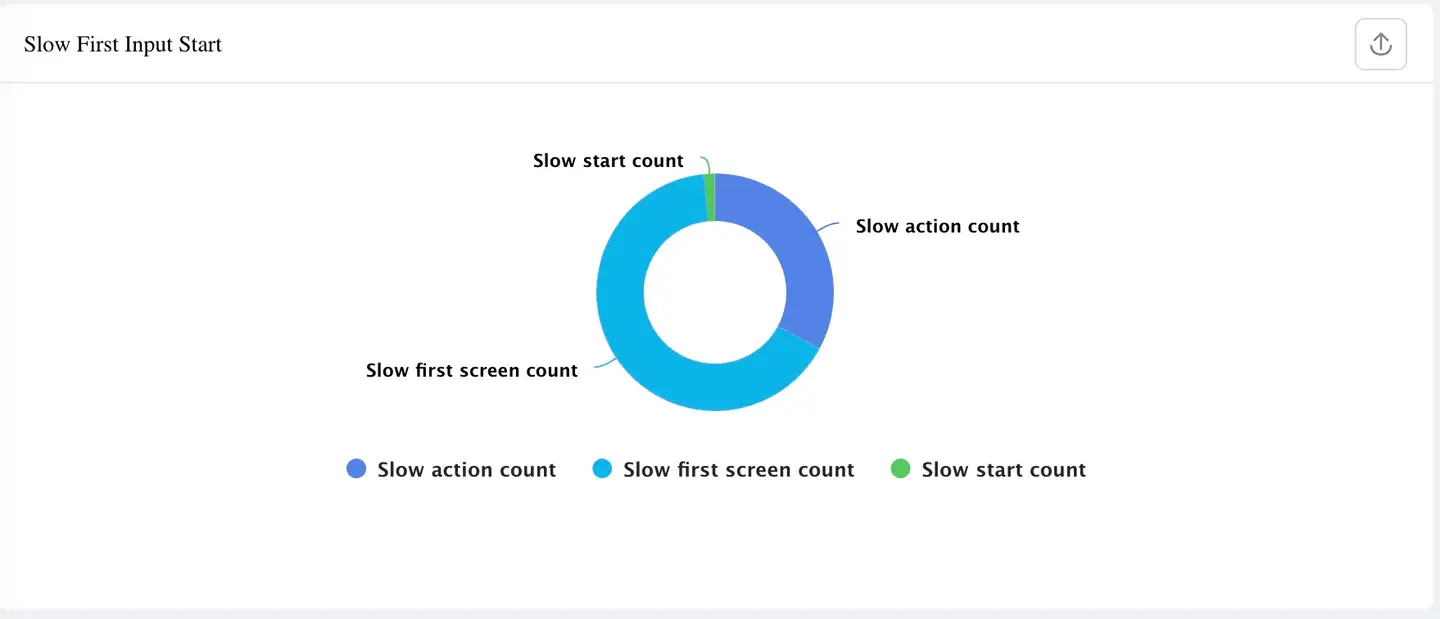
Slow Interaction: Operations with interaction time greater than the configured threshold are defined as slow interactions, including: slow startup, slow operations, and slow first screen.
-
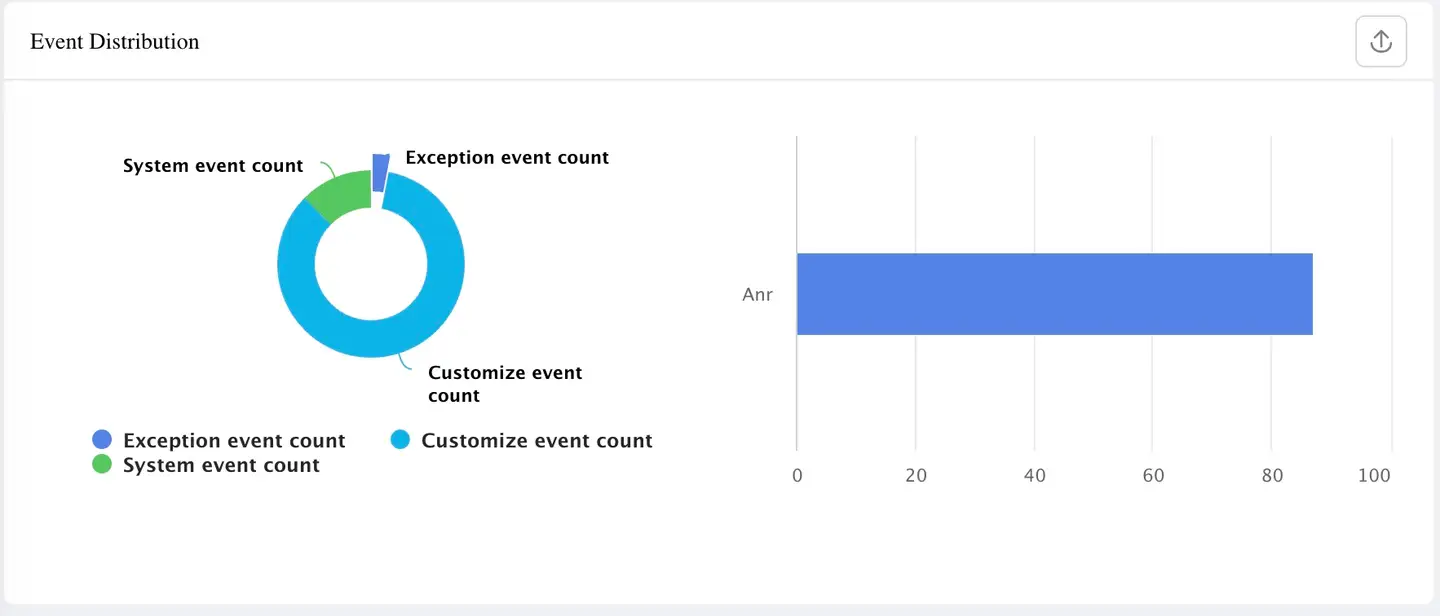
Event Count: Records the total number of "system events," "exception events," and "custom events" that occur in user sessions.
- System Events: Include foreground/background switching and network switching (5G switching to WiFi).
- Exception Events: Include crashes, lags, JS errors, and rapid clicks.
- Custom Events: Include custom business events and custom error events (custom events need to call relevant interfaces provided by the SDK for upload).
-
User Count: Statistics based on UserID configured by developers. If UserID is not configured, statistics are based on DeviceID generated by Tingyun, i.e., one device equals one user.
-
Rapid Clicking: You quickly click the screen in a short time (more than 3 clicks within a certain radius on the screen, with a maximum interval of 300ms between consecutive clicks), which to some extent reflects your "anxiety level" and is an important indicator for analyzing user experience.
-
Dwell Time: Records the natural time you spend on pages.
Session Overview
Metric Cards
-
Session Count: Shows the total number of sessions that occurred within the current selected time period.
-
Active User Count: Shows the number of users who launched at least once within the current selected time period.
-
Average Session Duration: Calculates the ratio of total session time to session count within the current time period (arithmetic mean).
-
Average Interaction Count: Shows the ratio of interaction count to session count within the current selected time period (arithmetic mean).
-
Average Event Count: Shows the ratio of event count to session count within the current selected time period (arithmetic mean).
-
Sequential Comparison with Previous Period: The platform will compare current period data with the previous period data to show the change in this metric. Example:
- Current period: 13:00~14:00, session count: 100
- Previous period: 11:00~12:00, session count: 80
- Sequential result: (Current period session count - Previous period session count) / Previous period session count * 100 = (100 - 80)/80*100 = 25%

Statistical Charts
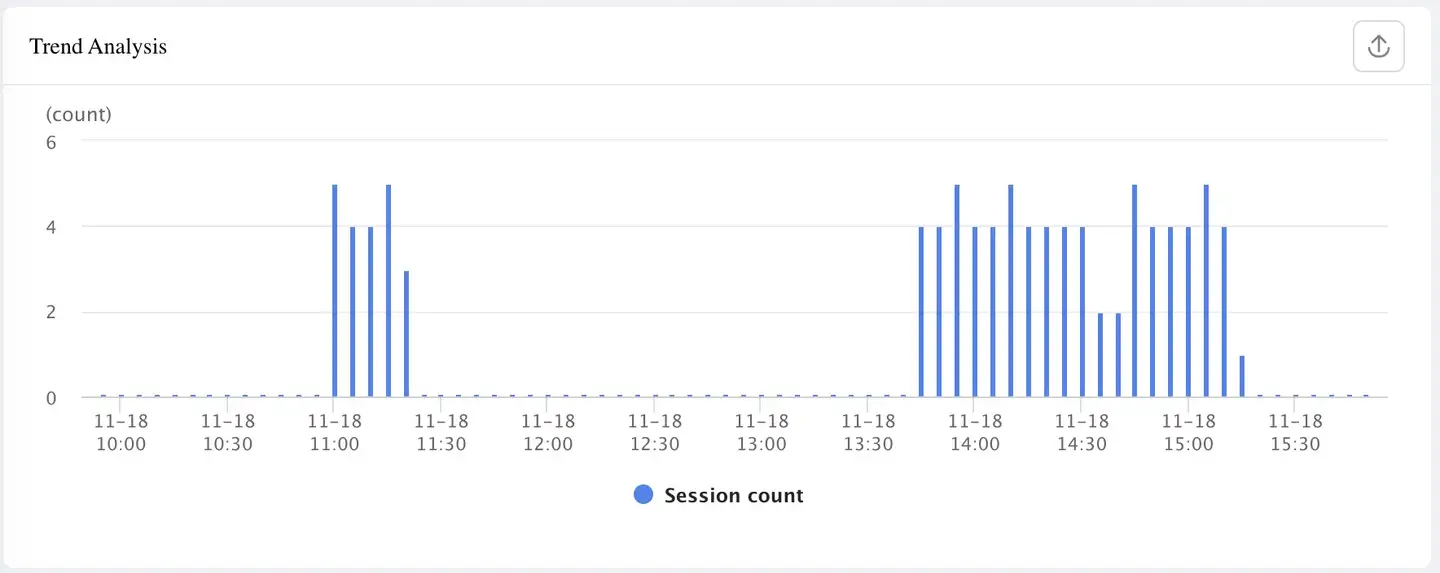
Trend Analysis Chart: Shows the relationship between this metric and time changes, supporting multi-dimensional filtering and download.
Source Distribution/User Distribution Chart: Shows the channel source distribution and user distribution of this metric, supporting multi-dimensional filtering and download.
-
Source Distribution: The platform identifies the source based on the first operation in the session and calculates its proportion.
-
User Distribution: The platform will count unique users by different sources and calculate their proportions.


Peak Hour Distribution Chart: Shows the distribution of this metric across 24 hours of a day, supporting multi-dimensional filtering and download.

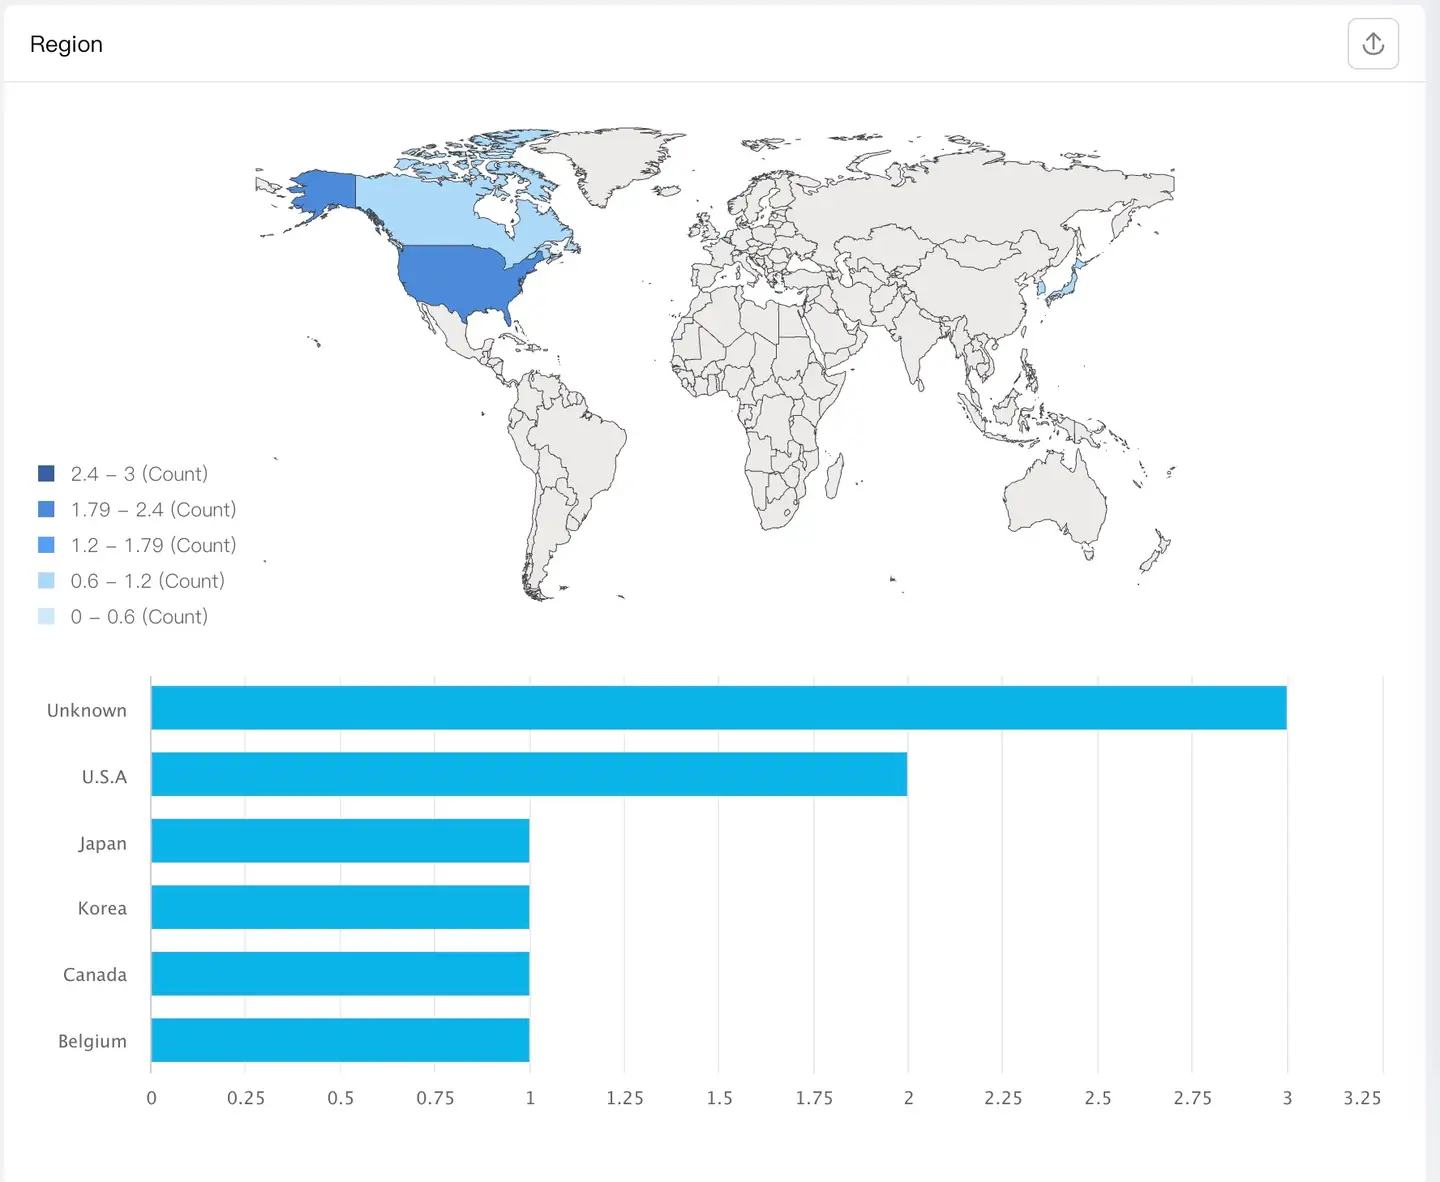
Geographic Distribution Chart: Shows the distribution of this metric across geographic dimensions, supporting multi-dimensional filtering and download.
Slow Interaction Distribution Chart: Shows the distribution of slow interaction types, supporting multi-dimensional filtering and download.
Event Distribution Chart: Shows the distribution of various events, supporting multi-dimensional filtering and download.
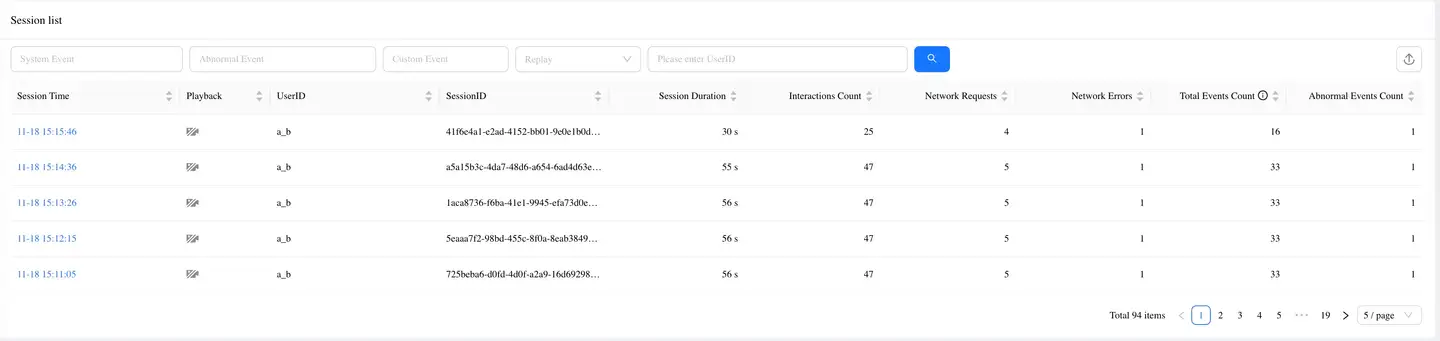
Session List
-
Filter Rules
- System Events: Supports filtering the list based on system events, exception events, and custom events.
- Exception Events: Supports filtering the list based on crashes, OOM, lags, JS errors, rapid clicks, and power consumption anomalies.
- Custom Events: Supports filtering the list based on custom events and custom errors.
-
Video Playback: Supports filtering the list based on whether sessions contain video data.
- UserID: Supports querying user sessions by UserID.
-
Download Rules: The platform supports downloading up to 10,000 user session data to local (CSV format by default).
Session Playback Details
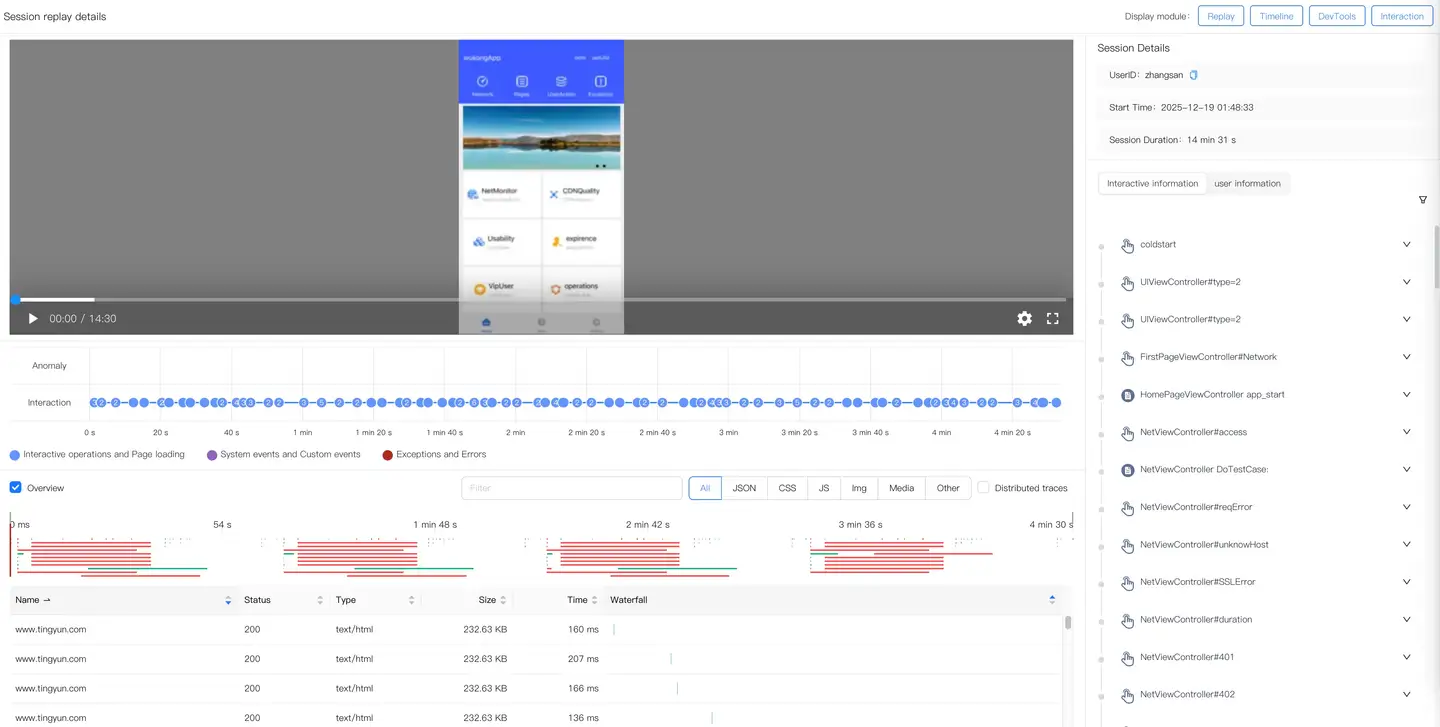
Page Playback (requires enabling Journey Playback switch): Shows the image playback content and interaction thumbnails of the current session, supports filtering by event type and variable speed playback.
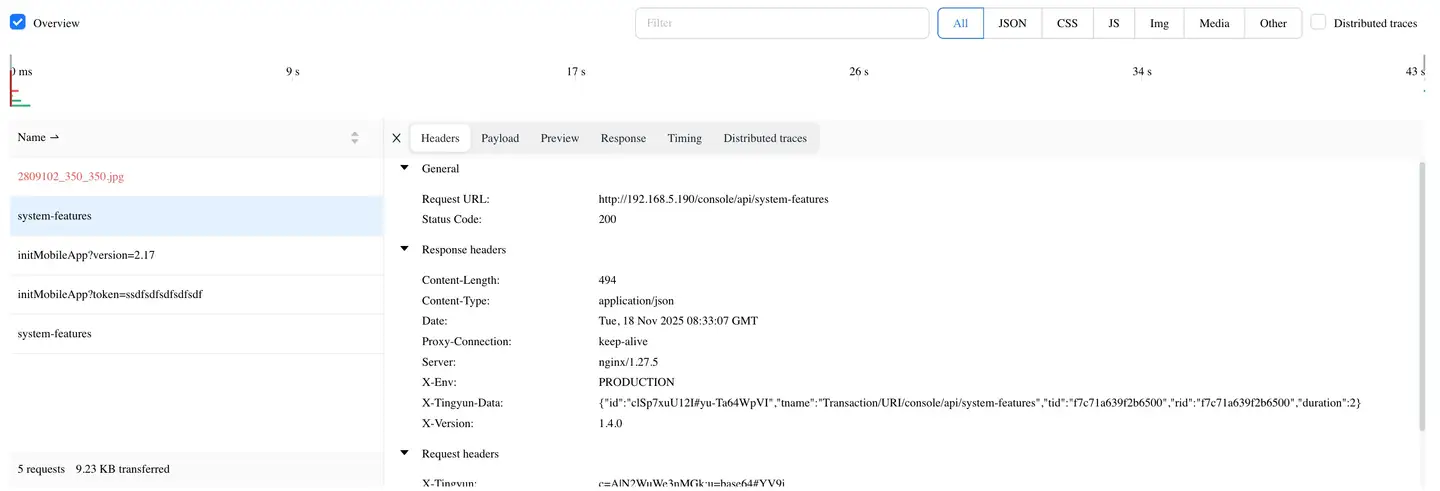
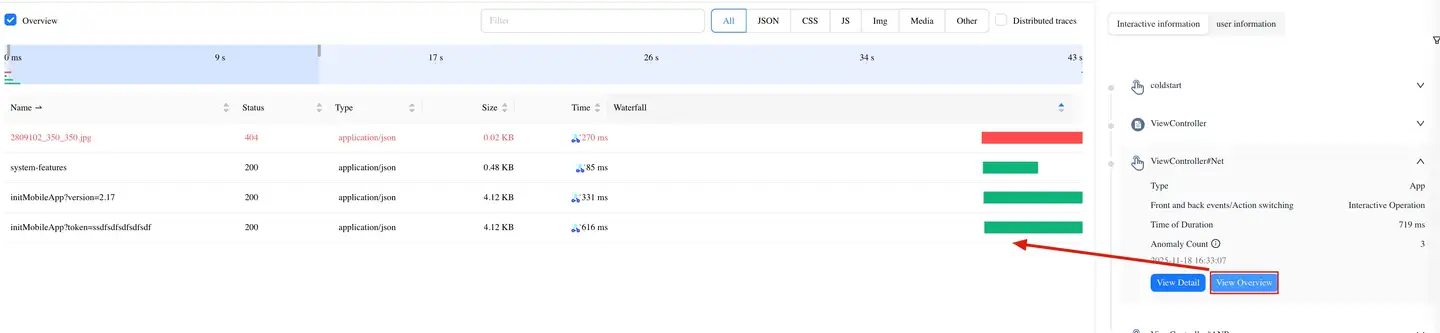
Request Playback: Shows all network request data accessed by users in the current session.
- Request Type Filtering: Supports filtering for JSON, CSS, JS, Img, Media, and Other.
- Distributed Traces: After checking, supports filtering for full-link analysis requests. Click the
 icon to view corresponding Traces details (supports third-party APM platform redirection).
 - Request Details: Supports displaying network request URL, Headers, PayLoad, Preview, Timing, and Distributed traces.
Session Details: Shows the current session's UserID, start time, and session duration.
-
Interaction Information: Shows all events/actions of the current user in this session. You can view the duration and number of exceptions for each event/action. You can also filter by system events, exception events, and interaction types.
-
View Details: Click an event/action to view the time breakdown waterfall chart of the current event/action.
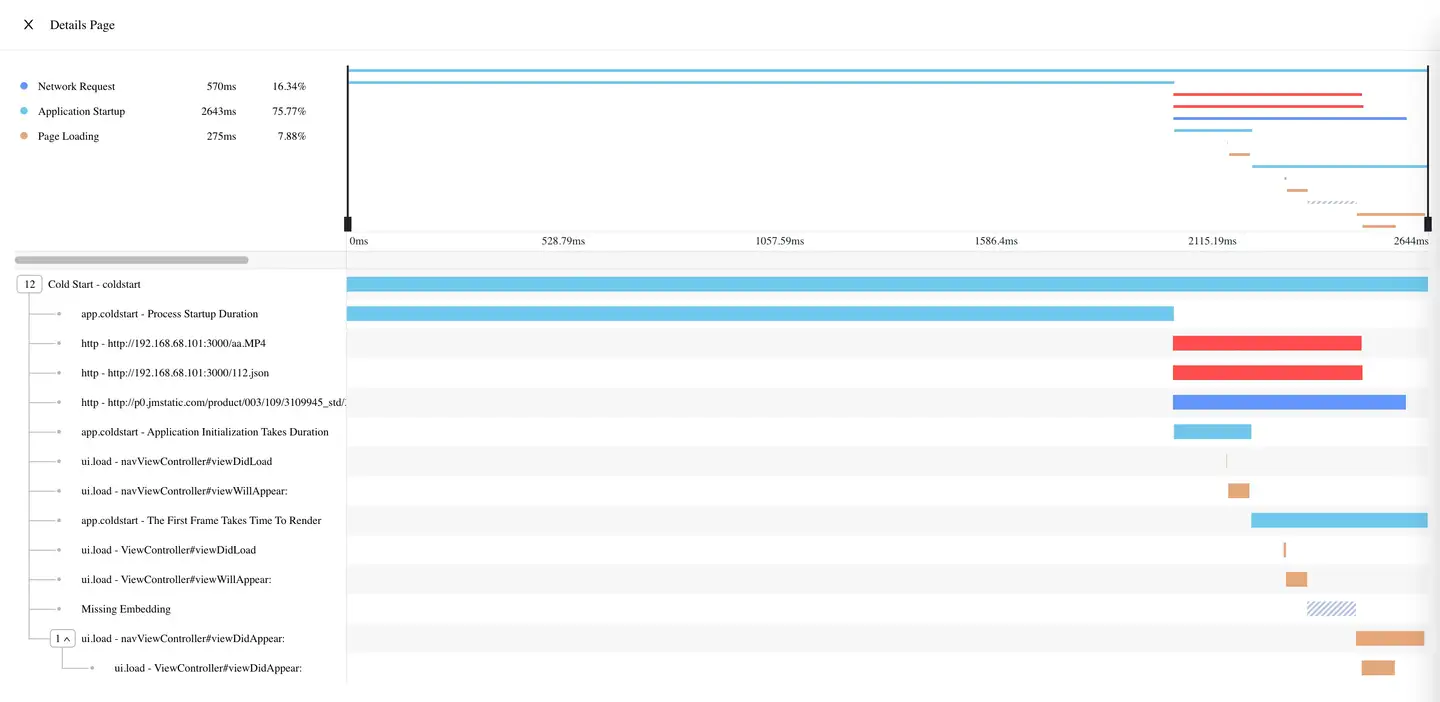
Top-left Area
-
Interaction Types: Network requests, application startup, page loading, and other time-consuming parts.
-
Duration: The projection duration of the current type in this session.
-
Percentage: The percentage of the current type's projection duration in the cumulative duration of all types.
Note: Different types of time spans can overlap, but the total duration should be based on the contribution of each type's exclusive time (non-overlapping) to the overall duration (sum of percentages can be greater than 100%).
Top-right Area shows session thumbnails, completely displaying the entire session duration. You can drag the cursor to zoom in or out the visible area.
Bottom-left Area shows the call tree, where you can view all application relationships in the current event/action, including lifecycle methods and network requests.
Bottom-right Area
-
Waterfall Chart: Draws a waterfall chart based on the duration of each lifecycle method and network request.
-
Missing Code: When there are gaps between lifecycle methods, the platform will automatically supplement a dashed line to indicate that data cannot be automatically collected during that period. You can manually call the
Custom Traceinterface to complete it.
View Overview: Click to view the network requests triggered by this operation/page on the left side.
User Information: Shows the user attribute information for this session, including: application name, session type, exception event count, geographic location, carrier, access method, client public IP address, operating system, resolution, browser, and device model.
User Experience Profile
In the navigation bar, select Real User Monitoring > User Journey > User Analysis to enter the User Analysis page, where you can view all user dimension data.
-
User List: Displays user names, last session time, and geographic location with user as the primary dimension. Supports searching by UserID.
-
User Profile: Shows all information about the current user, including: average session duration, session count, average interaction count, launch count, crash count, lag count, JS error count, rapid click count, and custom event count.
-
User Details section records detailed information uploaded from the last session, including: UserID, commonly used devices, operating system, application version, carrier, access method, and geographic location.
-
Session List: Displays all session data for the current user within the selected time period.
-
Problem List: Shows all problems that occurred for the current user within the selected time period, including: crashes, lags, JS errors, and rapid clicks.
Client-side Issues

Problem List: Shows all frontend problems for the current user in the selected time period, including: crashes, lags, OOM, custom errors, JS errors, and power consumption anomalies.
Server-side Issues

Problem List: Shows all backend problems for the current user in the selected time period, including backend error types, error messages, root causes, and applications.