Request
Request analysis is primarily used to analyze network request performance and errors within applications. It can analyze the following two types of requests:
- Ajax requests
- Static resource requests
Feature Overview
Filter Conditions
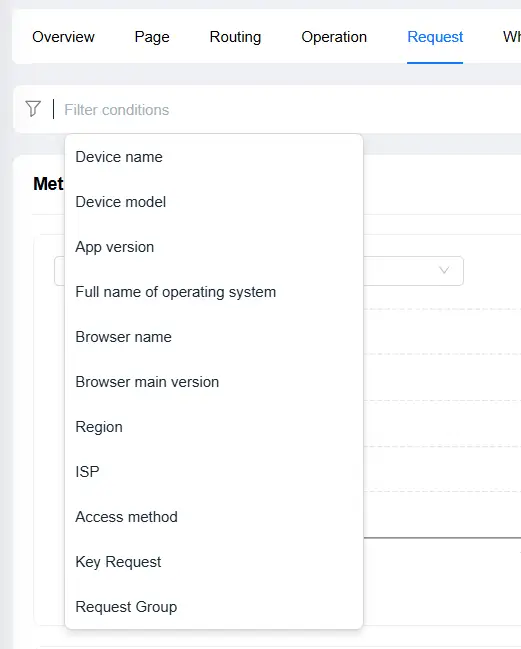
You can filter by the following dimensions:
- Device name
- Device model
- App version
- Operating system
- Operating system major version
- Browser name
- Browser major version
- Region
- Carrier
- Access method
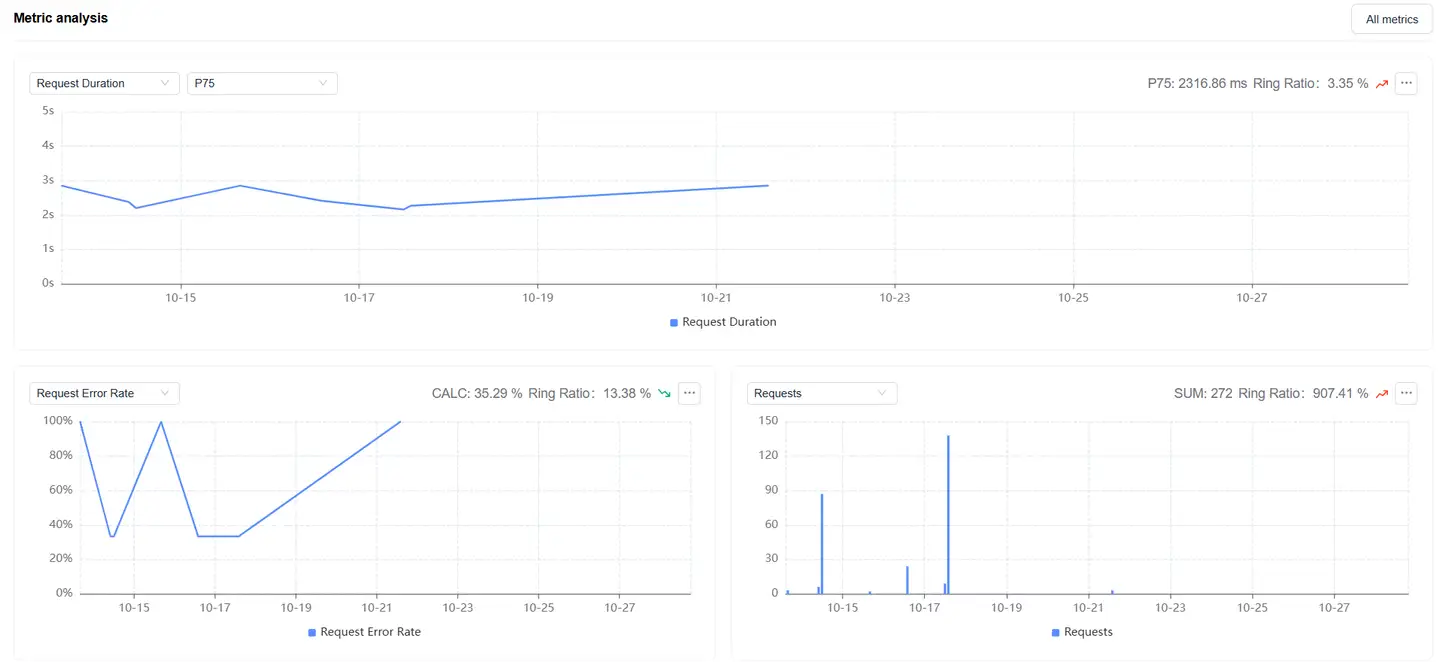
Metric Analysis
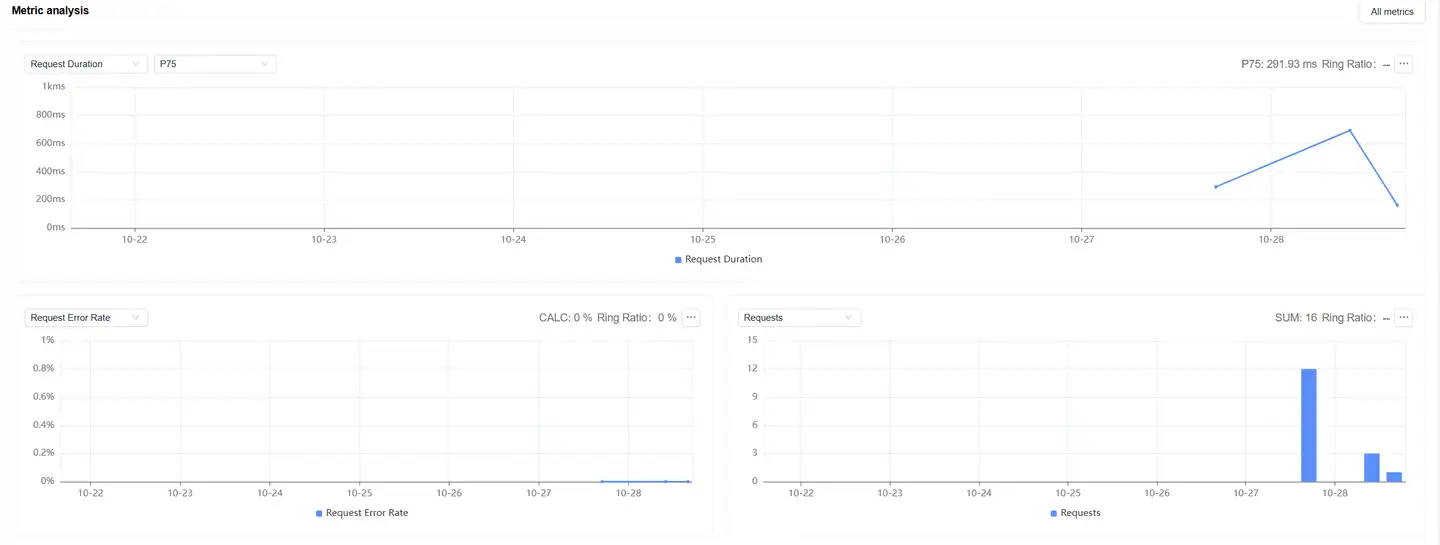
Displays trend charts of network request performance metrics under the filter conditions:
- Supports filtering and analysis of performance metrics as needed
- Time-based performance metrics support multiple statistical methods:
- Average
- P50
- P75 (default)
- P95
- P99
Dimension Analysis

Analyzes network request performance through the following 4 dimensions:
- URL domain
- Region
- Carrier
- Access method
Analysis features:
- When selecting any dimension detail data, the Filter Conditions will add a filter item for the selected dimension detail
- All modules on the page display performance data after filtering
- The region dimension map can be drilled down to province/state level
- You can select network request performance metrics on the left to analyze their performance across different regions
- The list supports customizable headers
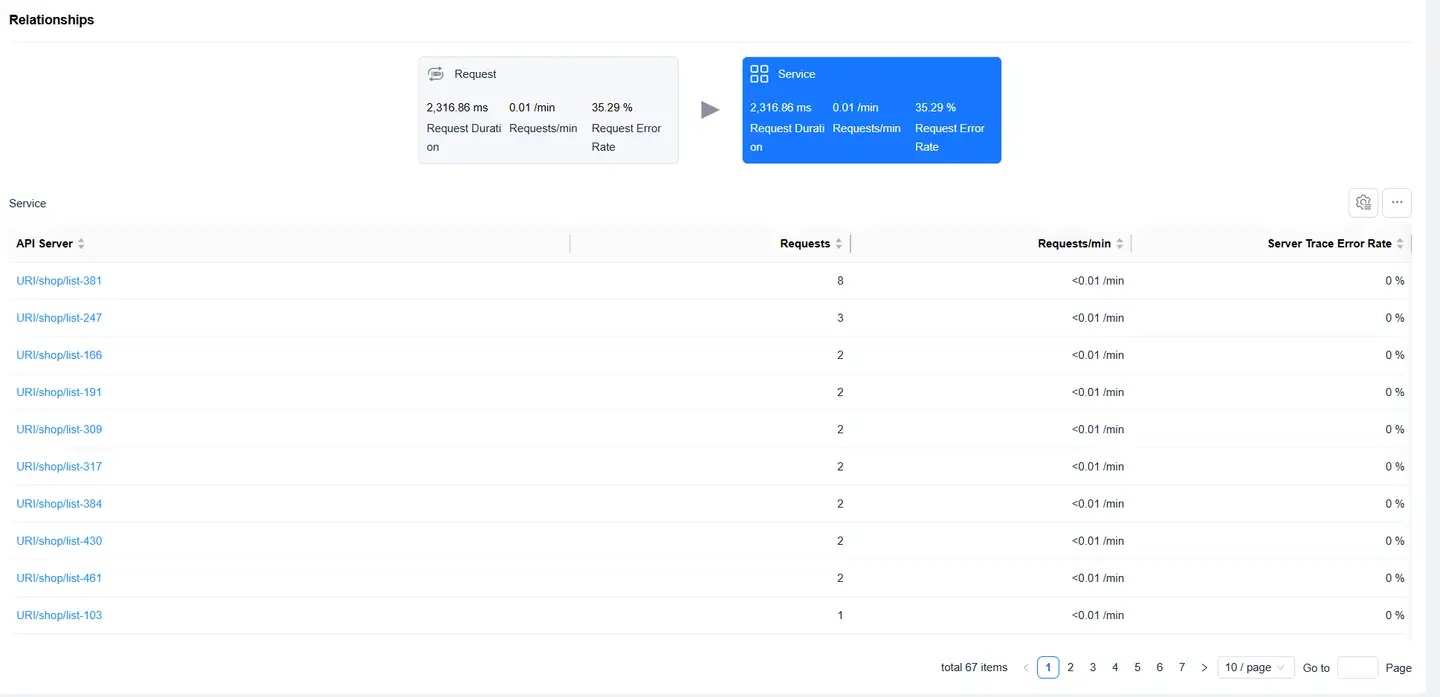
Relationship Topology
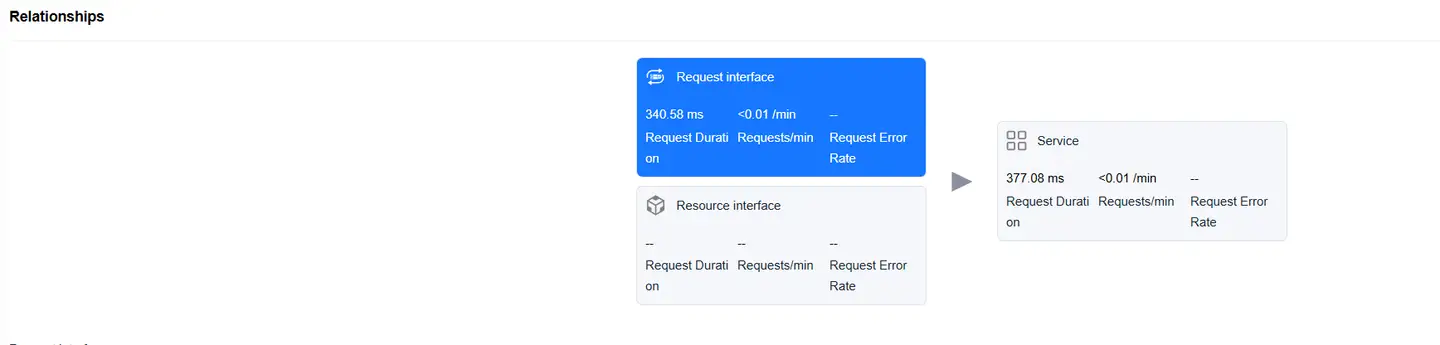
Displays the complete link between application network requests and backend services, helping to analyze performance bottlenecks.
Data Views
Request Interface View
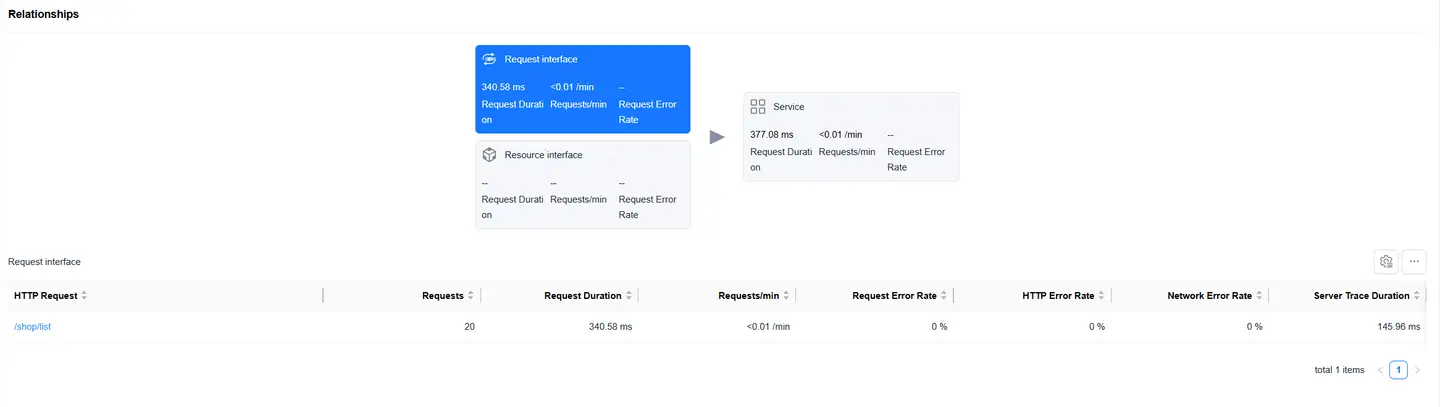
The Request Interface card is selected by default, displaying the list of requests with "mime-type as text or json". The list includes:
- HTTP request
- Request count
- Request time
- Requests per minute
- Request error rate
- HTTP error rate
- Network error rate
- Server-side trace time
- Slow request count
- Slow request percentage
- Server-side trace error rate
- Upstream traffic consumption
- Downstream traffic consumption
- Availability
Click on an HTTP request to enter Request Detail Analysis, which displays detailed data for that HTTP request.
Resource Interface View
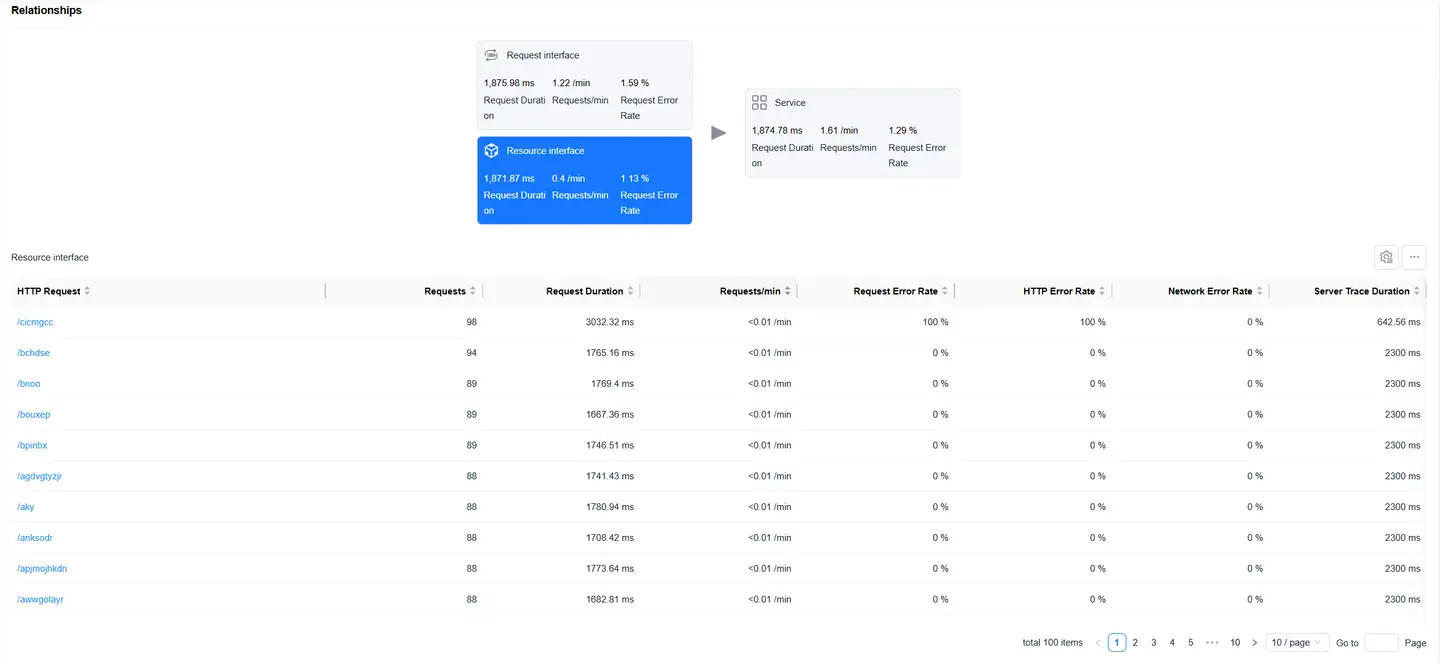
Select the Resource Interface card to display the resource request data list. The list includes:
- HTTP request
- Request count
- Request time
- Requests per minute
- Request error rate
- HTTP error rate
- Network error rate
- Server-side trace time
- Slow request count
- Slow request percentage
- Server-side trace error rate
- Upstream traffic consumption
- Downstream traffic consumption
- Availability
Click on an HTTP request to enter Request Detail Analysis, which displays detailed data for that HTTP request.
Service View
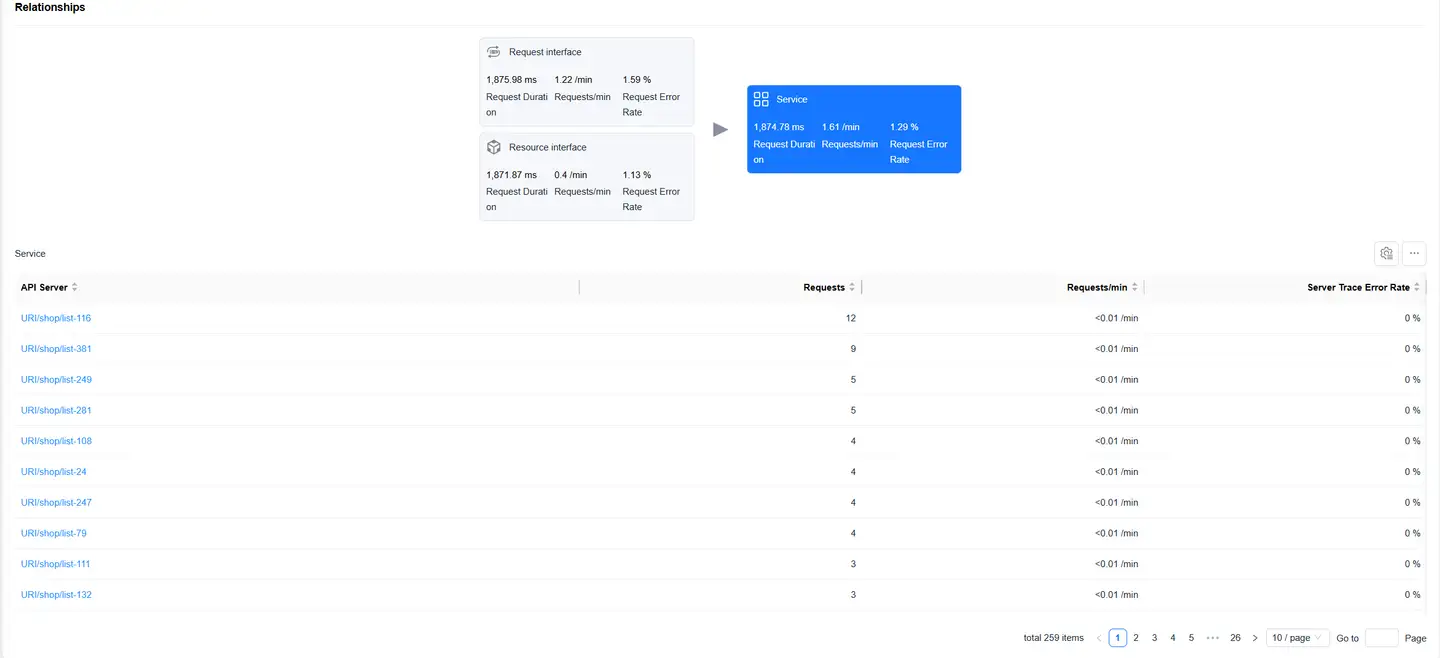
Select the Service card to display the backend service list (requires backend integration with Tingyun APM agent). The list includes:
- Backend service
- Request count
- Requests per minute
- Server-side trace error rate
Request Detail Analysis
Filter Conditions

You can filter by the following dimensions:
- Device name
- Device model
- App version
- Operating system
- Operating system major version
- Region
- Carrier
- Access method
Metric Analysis
Displays trend charts of network request performance metrics under the filter conditions:
- Supports filtering and analysis of performance metrics as needed
- Time-based performance metrics support multiple statistical methods:
- Average
- P50
- P75 (default)
- P95
- P99
Dimension Analysis

Analyzes network request performance through the following 4 dimensions:
- URL domain
- Region
- Carrier
- Access method
Analysis features:
- When selecting any dimension detail data, the Filter Conditions will add a filter item for the selected dimension detail
- All modules on the page display performance data after filtering
- The region dimension map can be drilled down to province/state level
- You can select network request performance metrics on the left to analyze their performance across different regions
- The list supports customizable headers
Relationship Topology
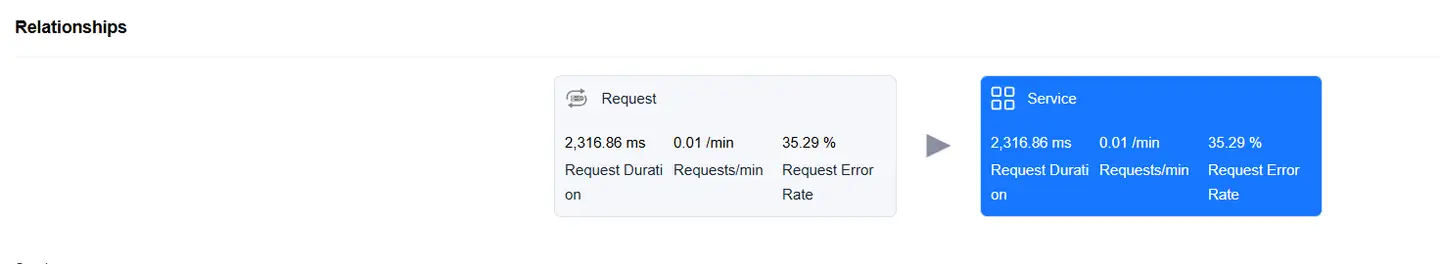
Displays the complete link between a single interface request and backend services, helping to analyze performance bottlenecks.
Service Analysis
Select the Service card to display the backend service list (requires backend integration with Tingyun APM agent). The list includes:
- Backend service
- Request count
- Requests per minute
- Server-side trace error rate
Sample Details
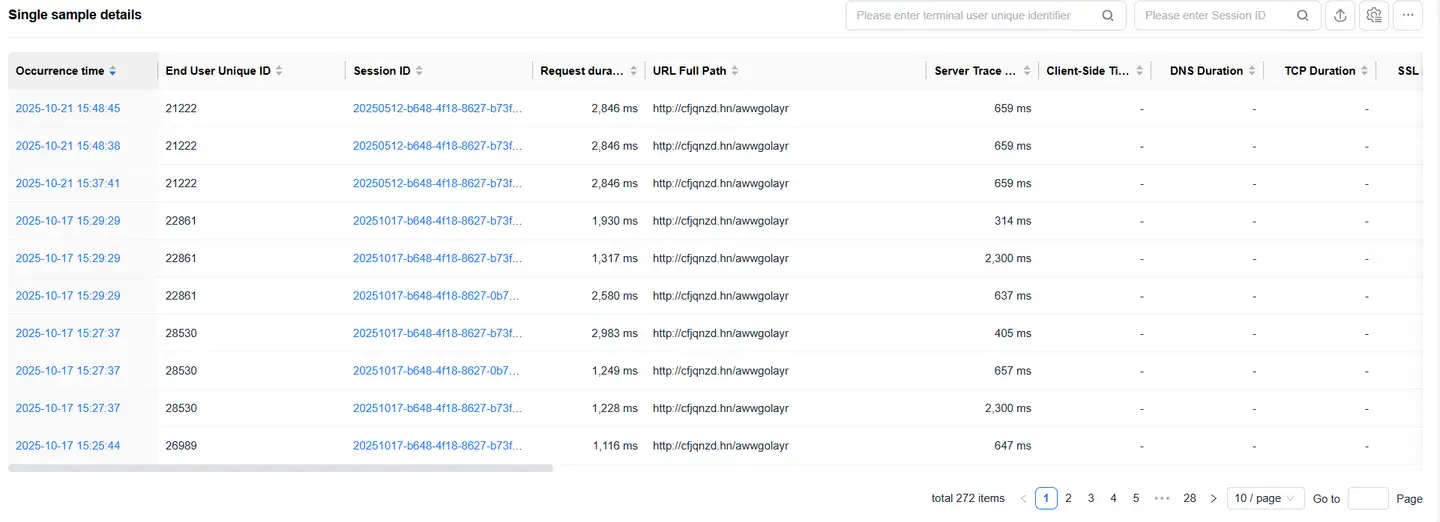
The details list displays all sample details data under the selected interface request. The list includes:
- Timestamp (occurrence time)
- Unique end-user identifier
- Session ID
- Full URL path
- Server-side trace time
- Client local time
- DNS time
- TCP time
- SSL time
- TTFB
- And more
List features:
- Supports filtering by user ID and session ID
- Supports export
- Supports customizable headers
Click on the Session ID to jump to the session details.
URL Detail Tracking
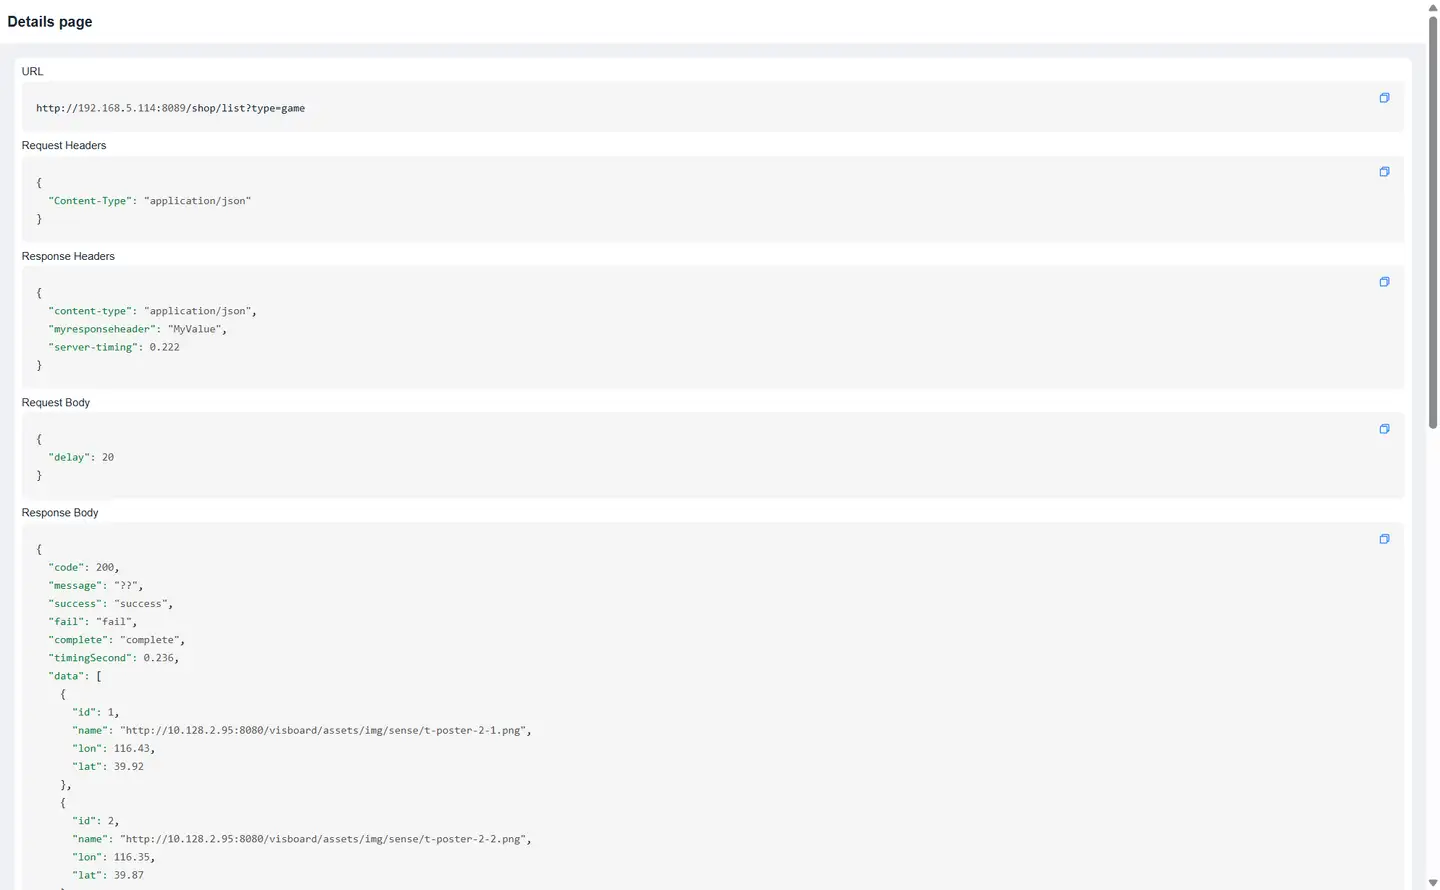
Click on the timeStamp in the details list to enter the URL detail tracking page, which displays URL information.
If Request Content Collection is enabled, it will also display:
- Request headers
- Response headers
- Request body
- Response body information