Page
Page Analysis provides performance analysis data for all pages in the application, and allows for performance evaluation, trend and percentile analysis, geographical analysis, summary waterfall analysis, and page detail tracking for each page.
Feature Overview
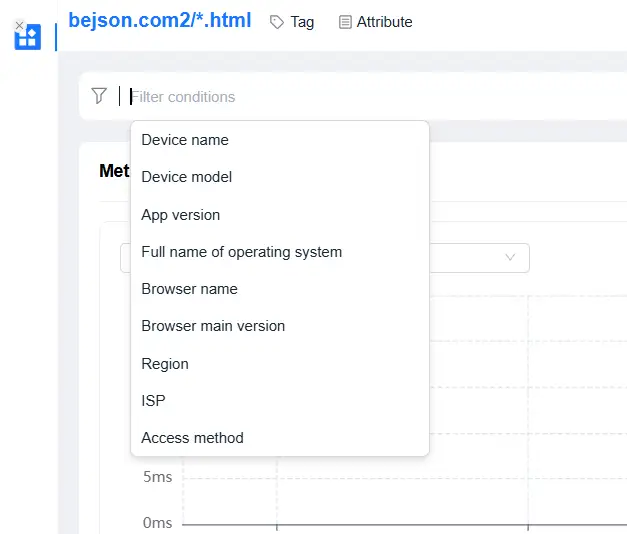
Filter Conditions

You can filter by the following dimensions:
- Device Name
- Device Model
- App Version
- Operating System
- Operating System Major Version
- Browser Name
- Browser Major Version
- Region
- Carrier
- Access Method
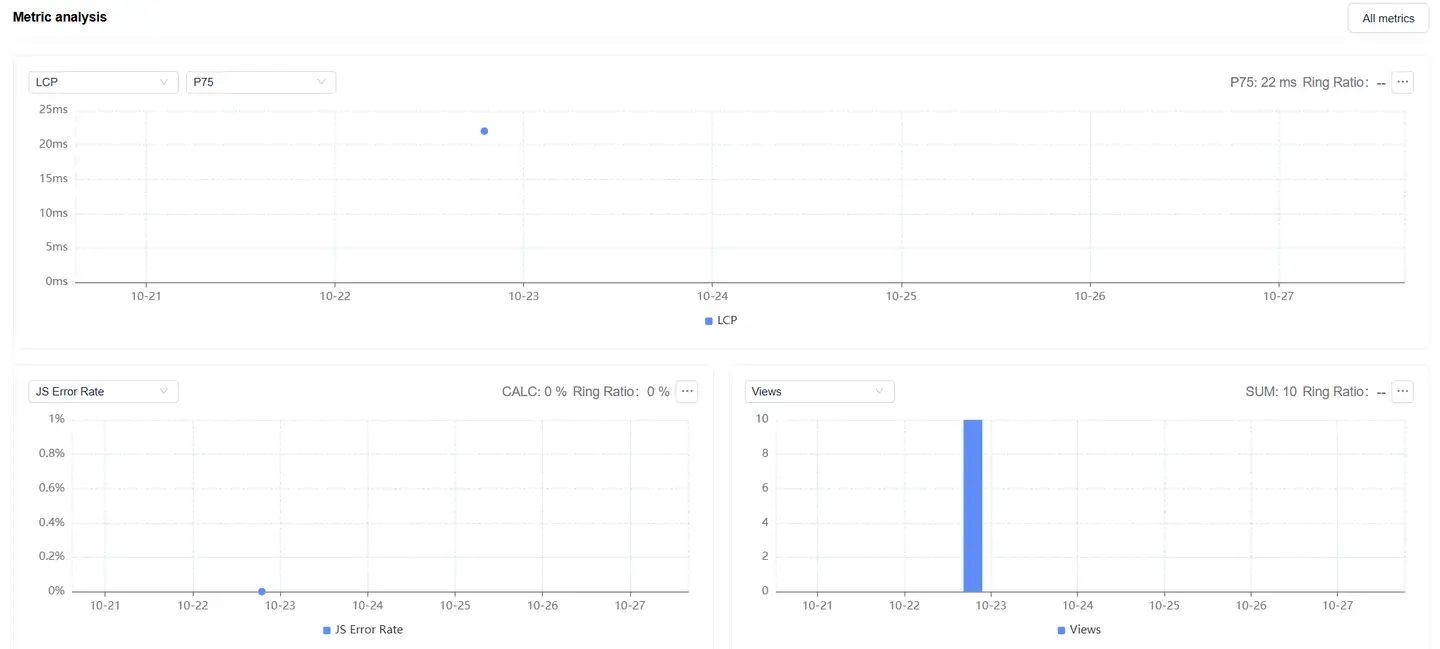
Metrics Analysis
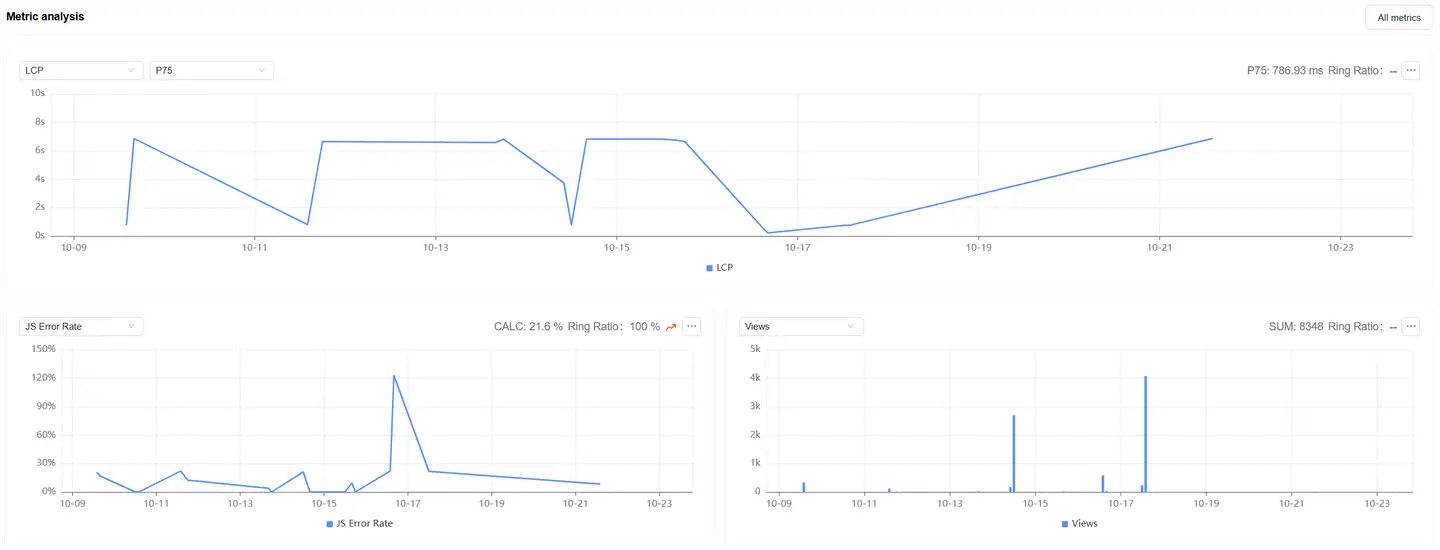
Displays trend charts of page loading performance metrics under the filter conditions:
- Supports filtering and analysis of performance metrics as needed
- Time-based performance metrics support multiple statistical methods:
- Average
- P50
- P75 (Default)
- P95
- P99
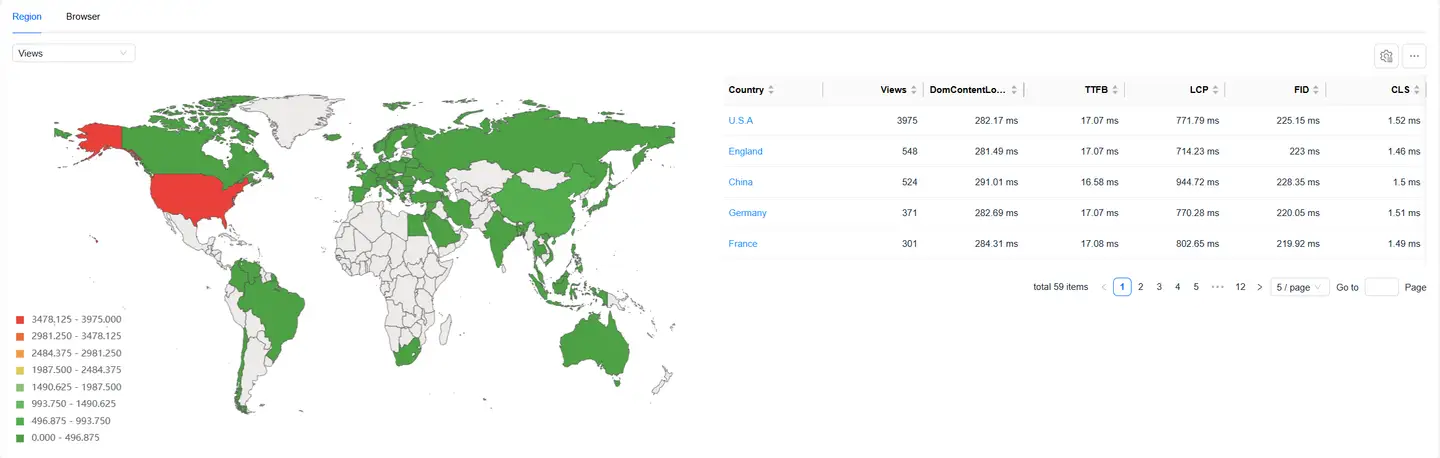
Dimension Analysis
Displays the distribution of page loading performance by region:
- The map can be drilled down, supporting drill-down to province/state level
- After map drill-down, the corresponding region is added to the filter conditions
- All modules on the page display performance data after filtering
- You can filter page loading performance metrics on the left to analyze their performance across different regions
- The list supports custom headers
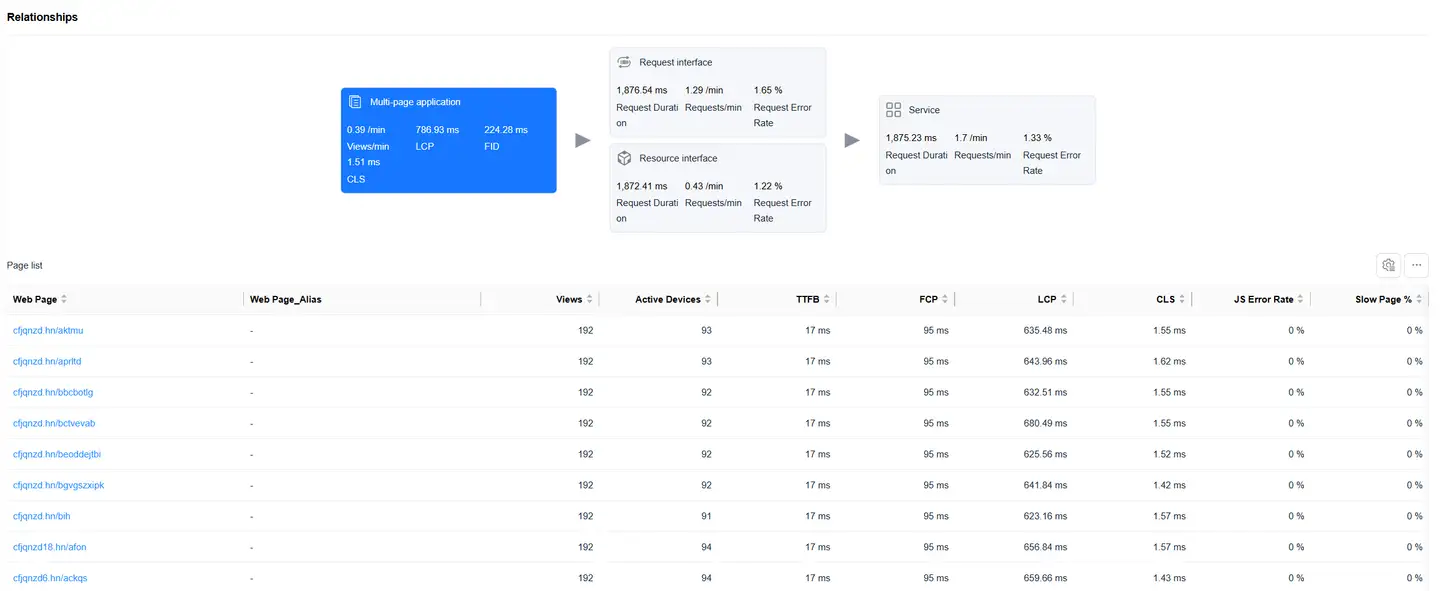
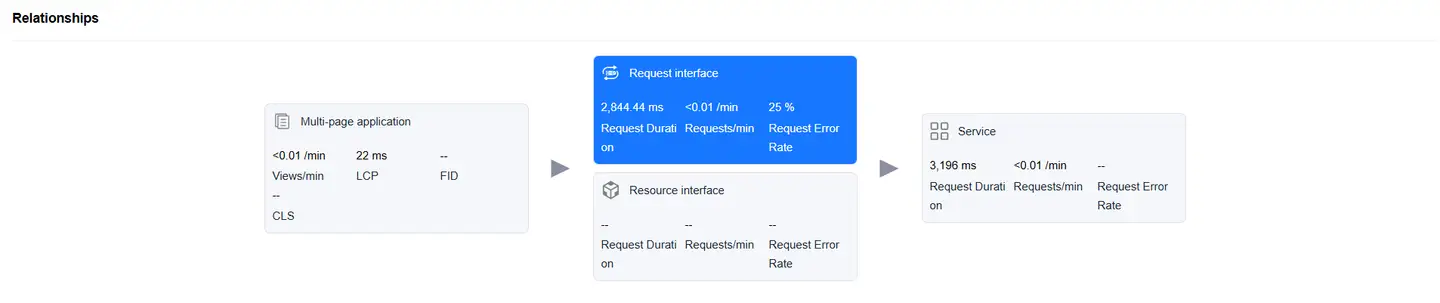
Relationship Topology
Displays the complete chain from Web page loading to backend services, helping to analyze performance bottlenecks.
Data Views
Page View
The Page card is selected by default, displaying a list of page performance data at the bottom, including:
- Web Page
- Visit Count
- Active Device Count
- TTFB (Time to First Byte)
- FCP (First Contentful Paint)
- LCP (Largest Contentful Paint)
- FID (First Input Delay)
- CLS (Cumulative Layout Shift)
- Complete Load
- TTI (Time to Interactive)
- TBT (Total Blocking Time)
- DomContentLoaded
- LoadEventEnd
- JS Error Rate
- Slow Page Count
- Slow Page Percentage
- Page_Alias(You can add aliases for pages in entity management)
Click on a page in the list to enter the page details, which displays detailed data for that page.
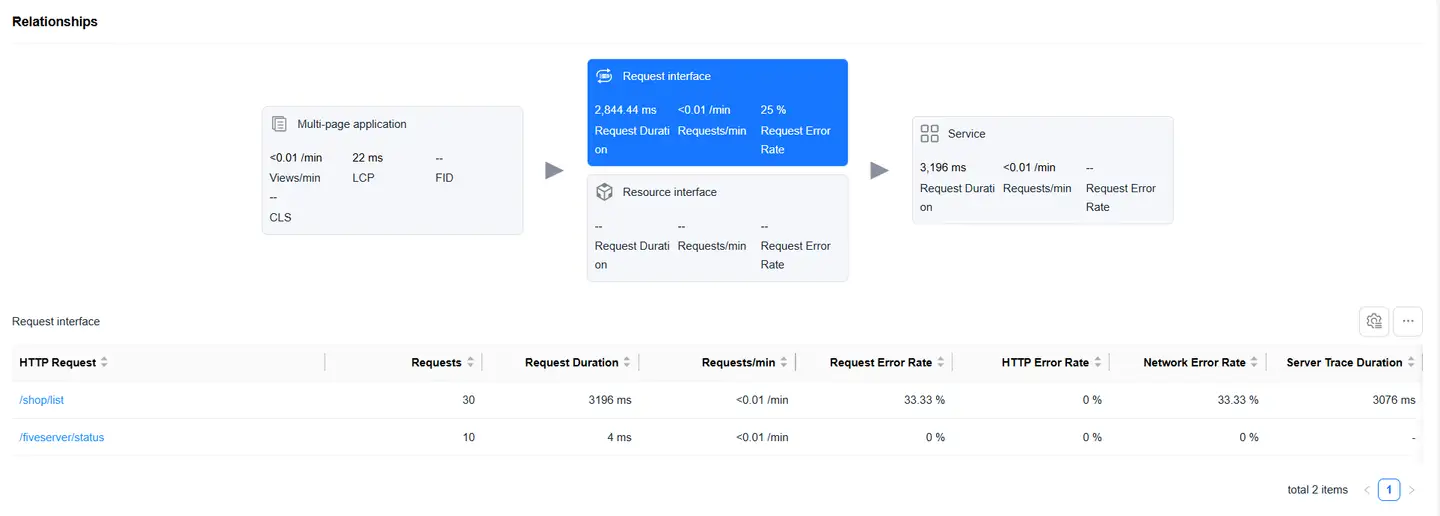
Request Interface View
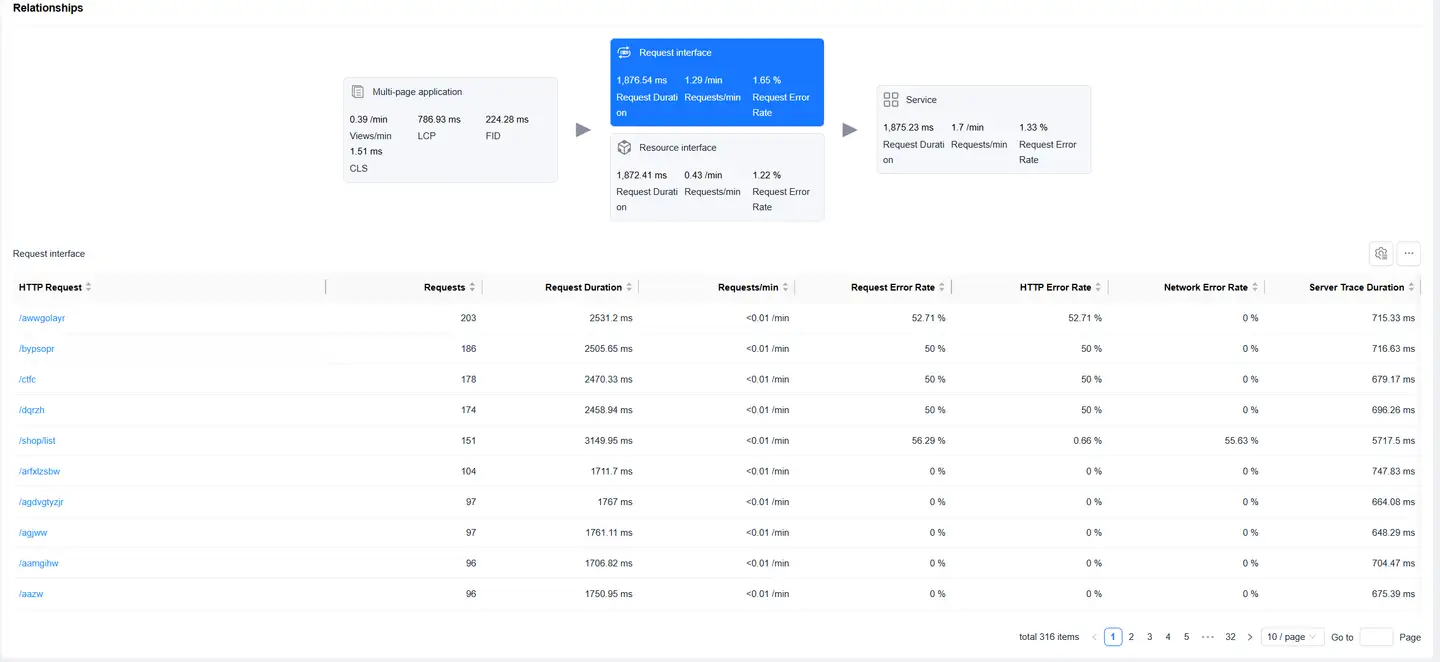
Select the Request Interface card to display a list of requests (with mime-type of text or json), including:
- HTTP Request
- Request Count
- Request Time
- Requests Per Minute
- Request Error Rate
- HTTP Error Rate
- Network Error Rate
- Backend Trace Time
- Slow Request Count
- Slow Request Percentage
- Backend Trace Error Rate
- Upstream Traffic Consumption
- Downstream Traffic Consumption
- Availability
Click on an HTTP request to enter Request Detail Analysis, which displays detailed data for that HTTP request.
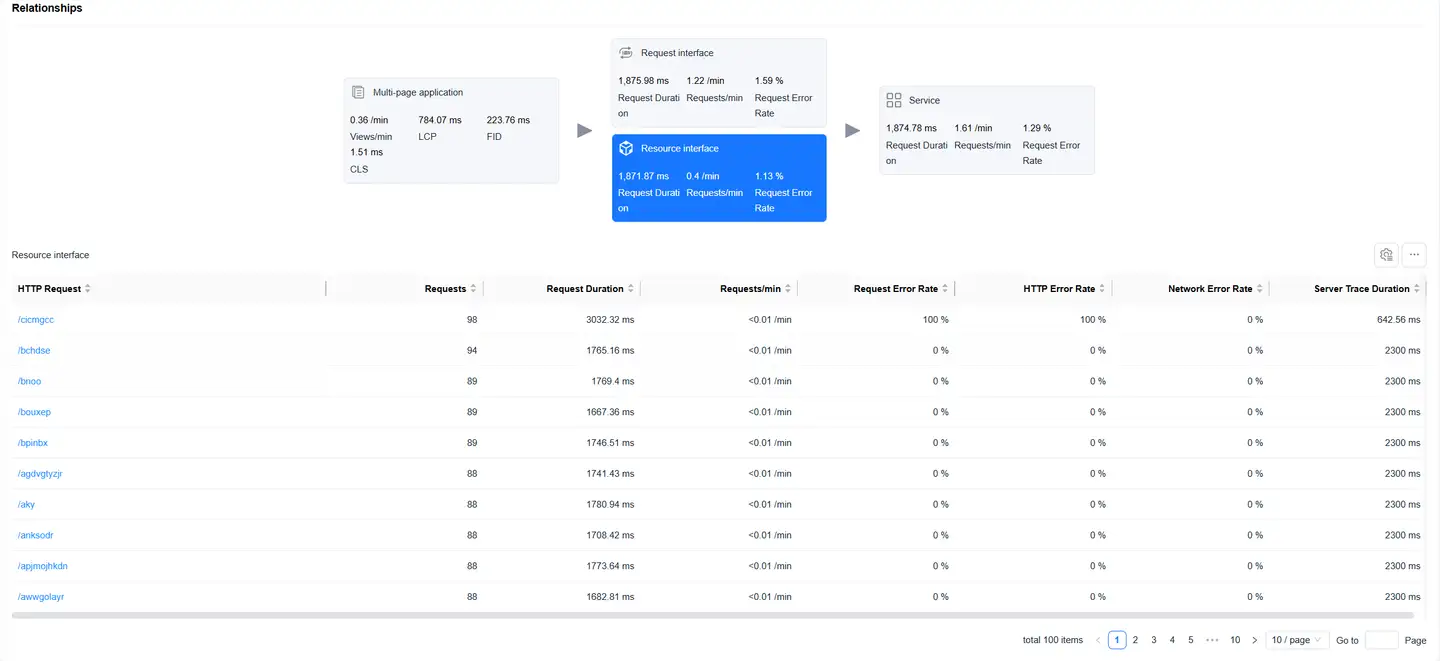
Resource Interface View
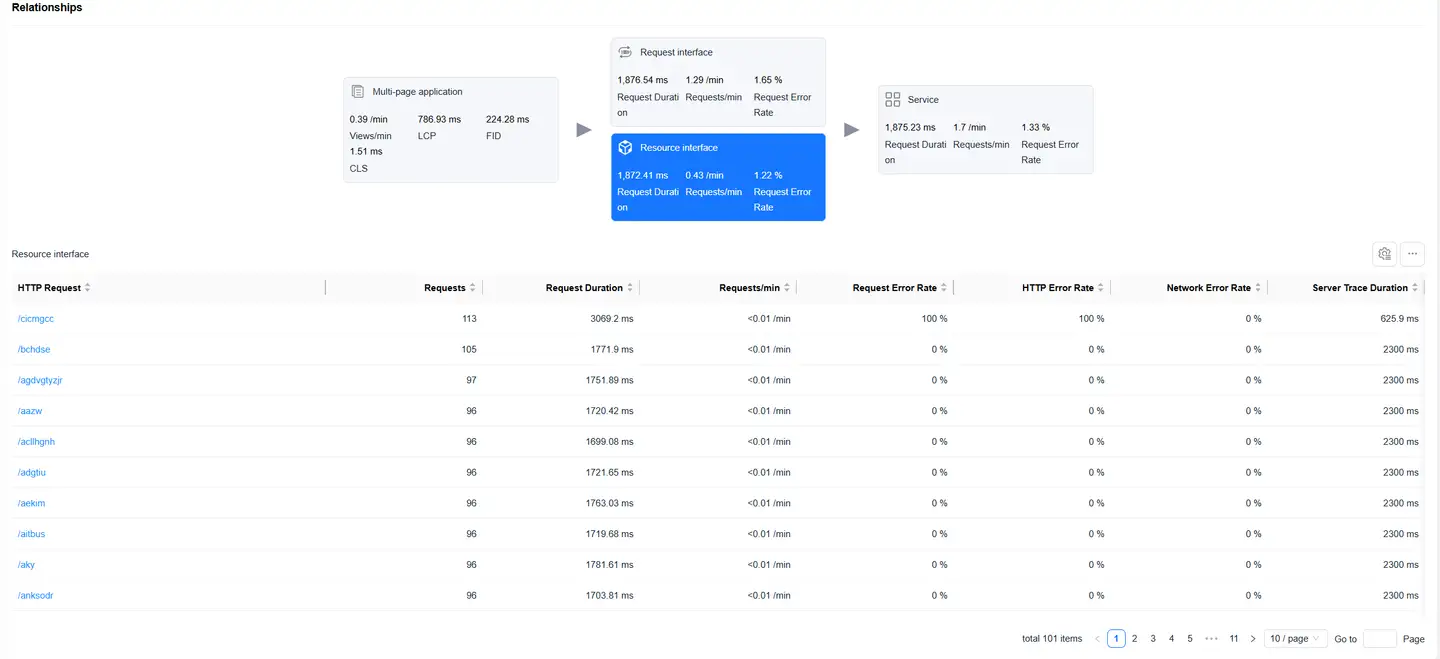
Select the Resource Interface card to display a list of resource requests, including:
- HTTP Request
- Request Count
- Request Time
- Requests Per Minute
- Request Error Rate
- HTTP Error Rate
- Network Error Rate
- Backend Trace Time
- Slow Request Count
- Slow Request Percentage
- Backend Trace Error Rate
- Upstream Traffic Consumption
- Downstream Traffic Consumption
- Availability
Click on an HTTP request to enter Request Detail Analysis, which displays detailed data for that HTTP request.
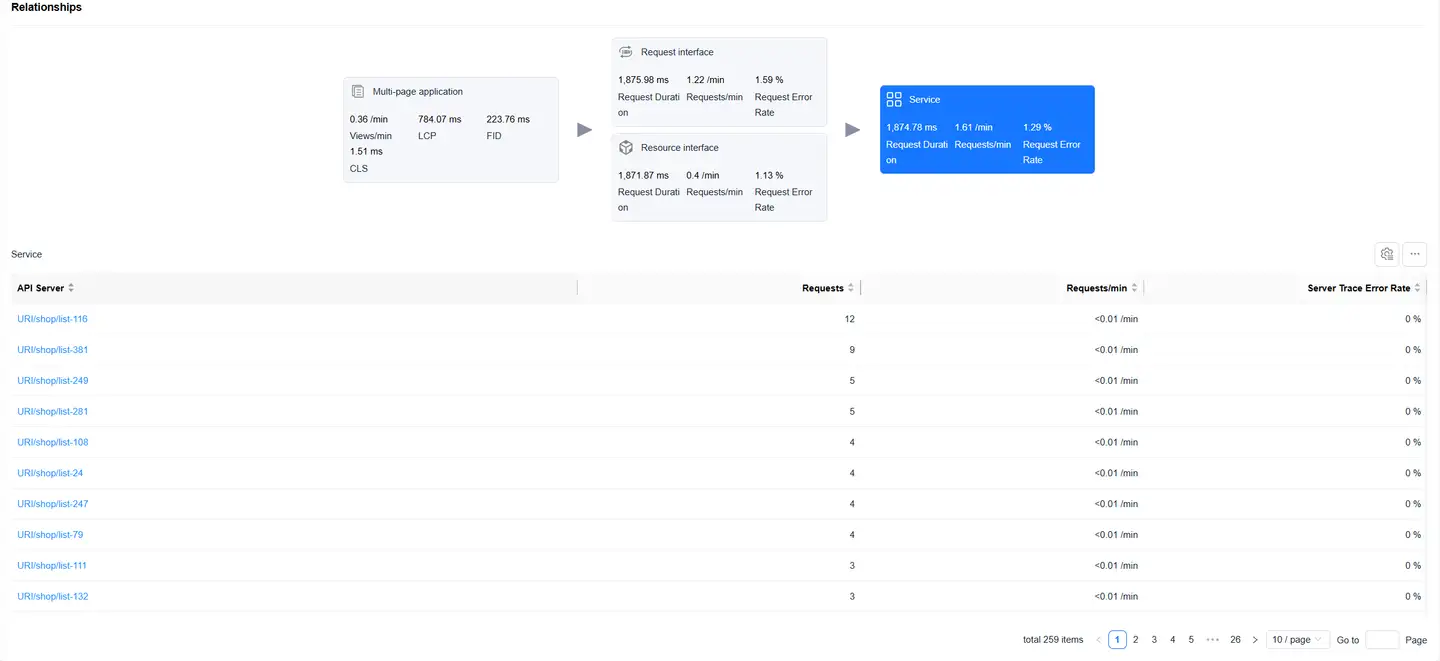
Service View
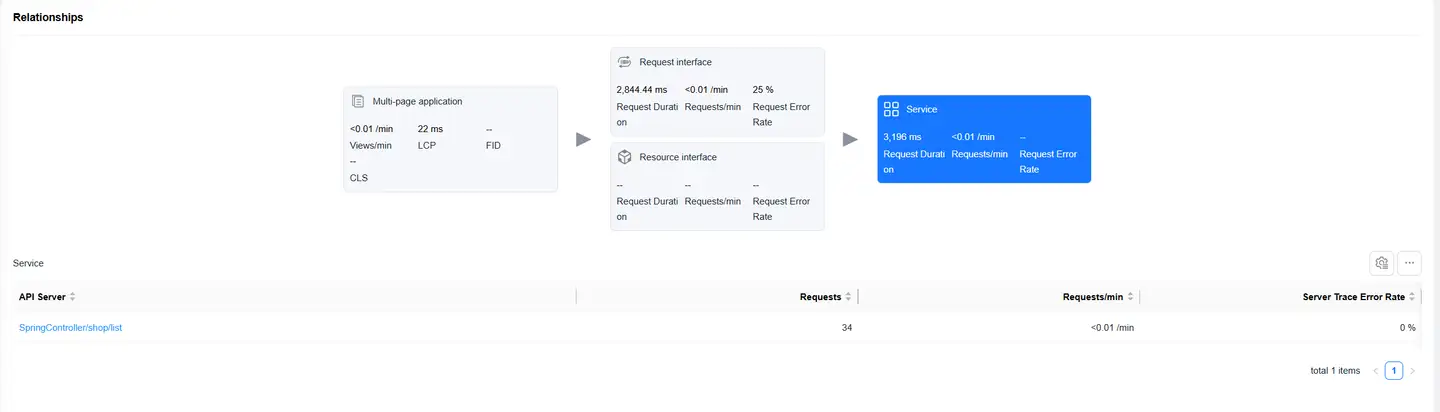
Select the Service card to display a list of backend services (requires backend integration with Tingyun APM agent), including:
- Backend Service
- Request Count
- Requests Per Minute
- Backend Trace Error Rate
Page Detail Analysis
Filter Conditions
You can filter by the following dimensions:
- Device Name
- Device Model
- App Version
- Operating System
- Operating System Major Version
- Region
- Carrier
- Access Method
Metrics Analysis
Displays trend charts of page performance loading metrics under the filter conditions:
- Supports filtering and analysis of performance metrics as needed
- Time-based performance metrics support multiple statistical methods:
- Average
- P50
- P75 (Default)
- P95
- P99
Dimension Analysis
Displays the distribution of page loading performance by region:
- The map can be drilled down, supporting drill-down to province/state level
- After map drill-down, the corresponding region is added to the filter conditions
- All modules on the page display performance data after filtering
- You can filter page loading performance metrics on the left to analyze their performance across different regions
- The list supports custom headers
Relationship Topology
Displays the complete chain from a single application page load to backend services, helping to analyze performance bottlenecks.
Request Interface Analysis
Select the Request Interface card to display a list of requests (with mime-type of text or json), including:
- HTTP Request
- Request Count
- Request Time
- Requests Per Minute
- Request Error Rate
- HTTP Error Rate
- Network Error Rate
- Backend Trace Time
- Slow Request Count
- Slow Request Percentage
- Backend Trace Error Rate
- Upstream Traffic Consumption
- Downstream Traffic Consumption
- Availability
Click on an HTTP request to enter Request Detail Analysis, which displays detailed data for that HTTP request.
Resource Interface Analysis
Select the Resource Interface card to display a list of resource requests, including:
- HTTP Request
- Request Count
- Request Time
- Requests Per Minute
- Request Error Rate
- HTTP Error Rate
- Network Error Rate
- Backend Trace Time
- Slow Request Count
- Slow Request Percentage
- Backend Trace Error Rate
- Upstream Traffic Consumption
- Downstream Traffic Consumption
- Availability
Click on an HTTP request to enter Request Detail Analysis, which displays detailed data for that HTTP request.
Service Analysis
Select the Service card to display a list of backend services (requires backend integration with Tingyun APM agent), including:
- Backend Service
- Request Count
- Requests Per Minute
- Backend Trace Error Rate
Sample Details
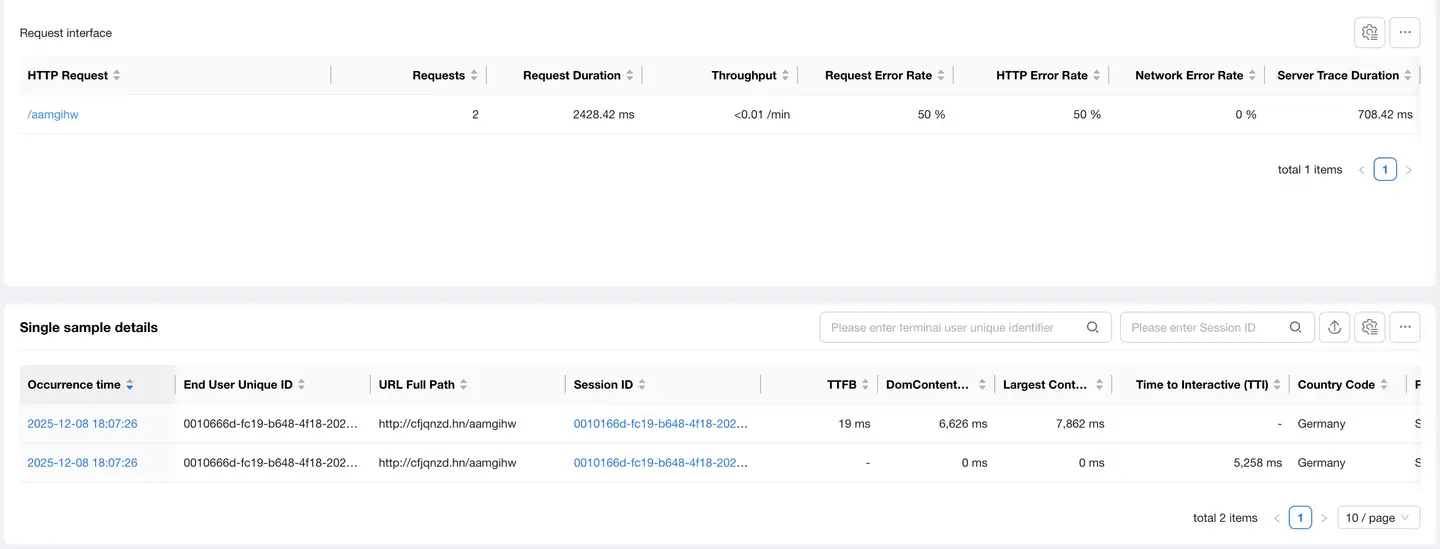
The details list displays all sample detail data for the selected page, including:
- timestamp (Occurrence Time)
- End User Unique Identifier
- URL Full Path
- Session ID
- TTFB
- DomContentLoaded
- LCP
- TTI
- Country
- Province/State
- City
- etc.
List features:
- Supports filtering by User ID, Session ID
- Supports export
- Supports custom headers
Click on Session ID to jump to session details.
Trace Detail Tracking
Click on timeStamp in the details list to enter the Trace Detail Tracking page, which displays request information during page loading.
Request Waterfall
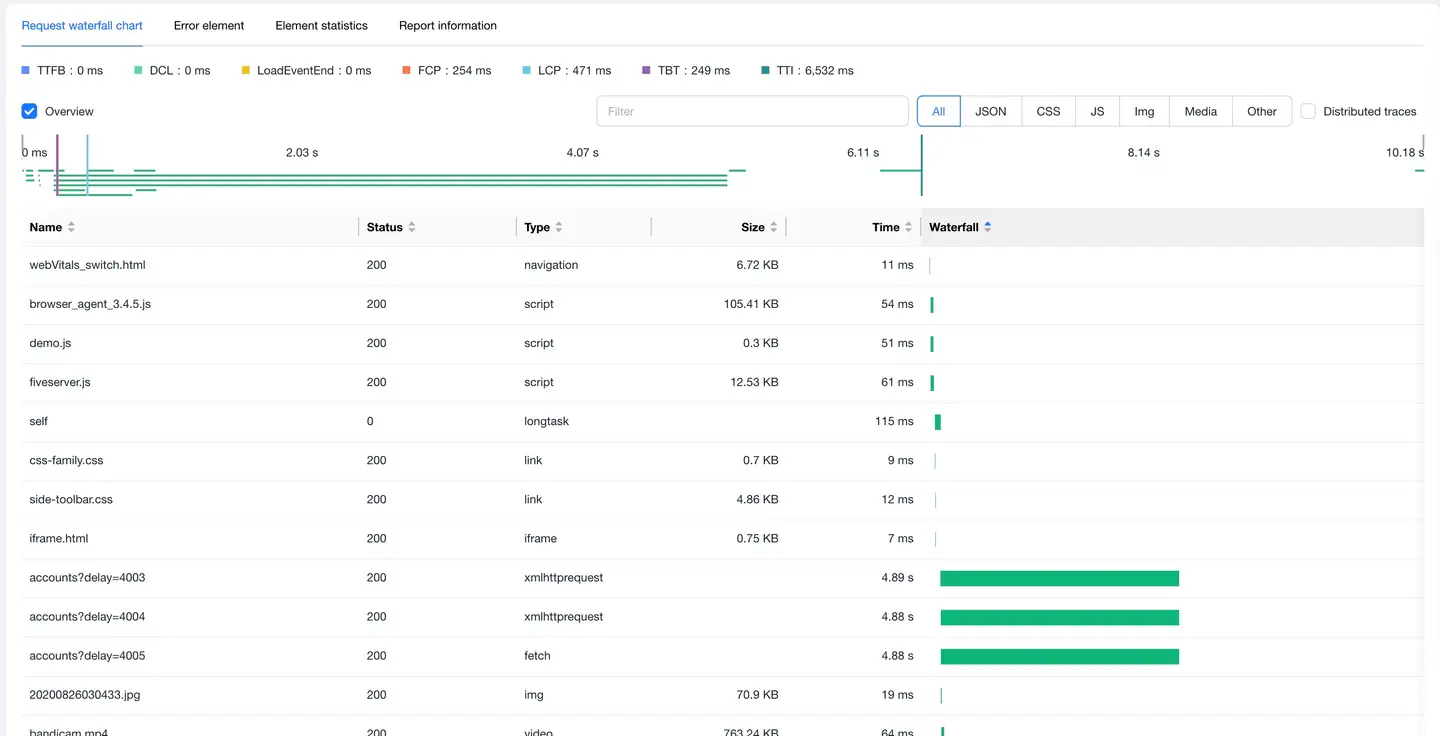
Displays request information during page loading in a waterfall format:
-
Longtask 「Tasks that take longer than 50ms to execute on the browser's main thread will block page rendering and user interactions (such as clicking and scrolling), causing page stuttering and slow response」
-
Supports filtering by request type
-
Supports searching request URLs
Error Elements
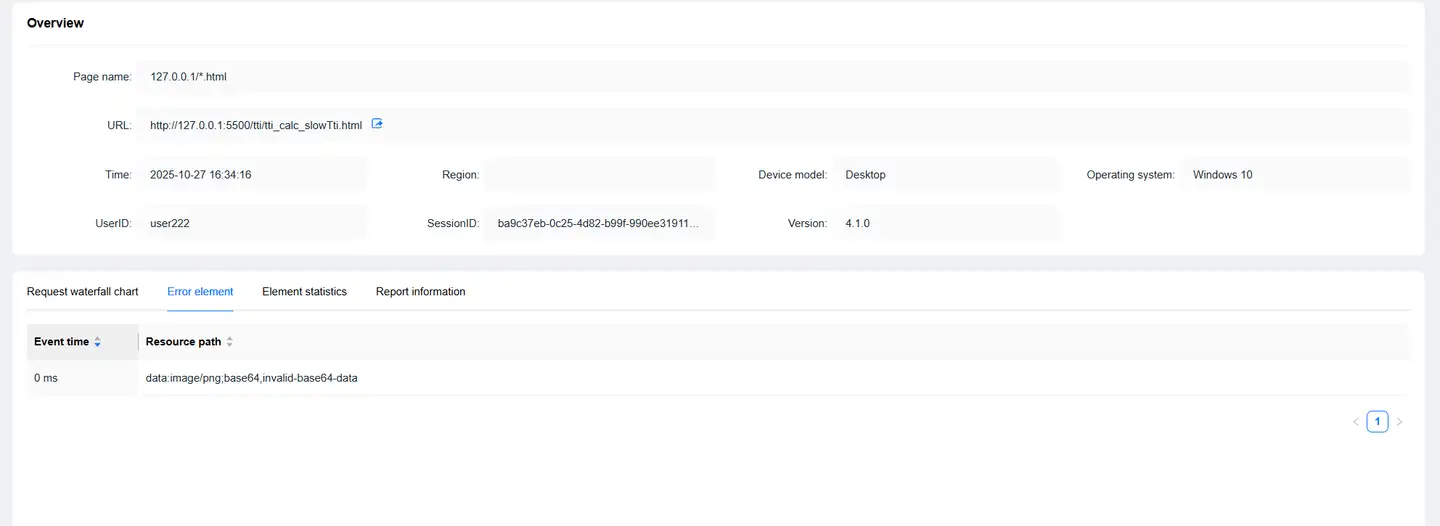
Displays information about resources that encountered errors, including:
- Occurrence Time
- Resource Path
Element Statistics
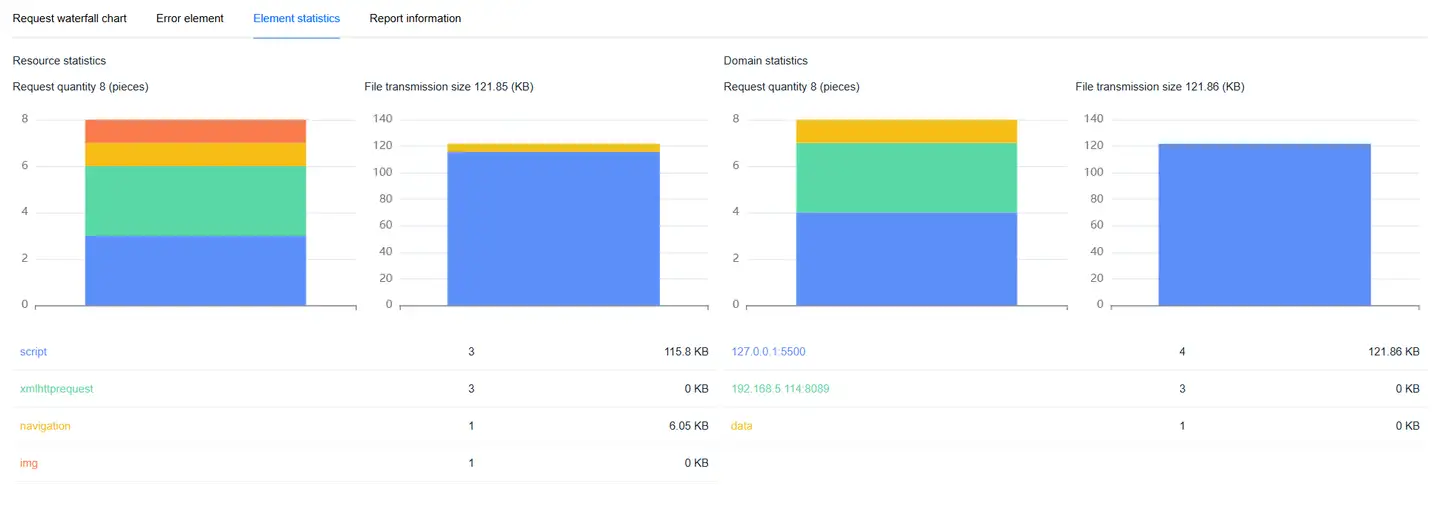
Statistics by request type and domain name:
- Request Count
- File Transfer Size
Report Information
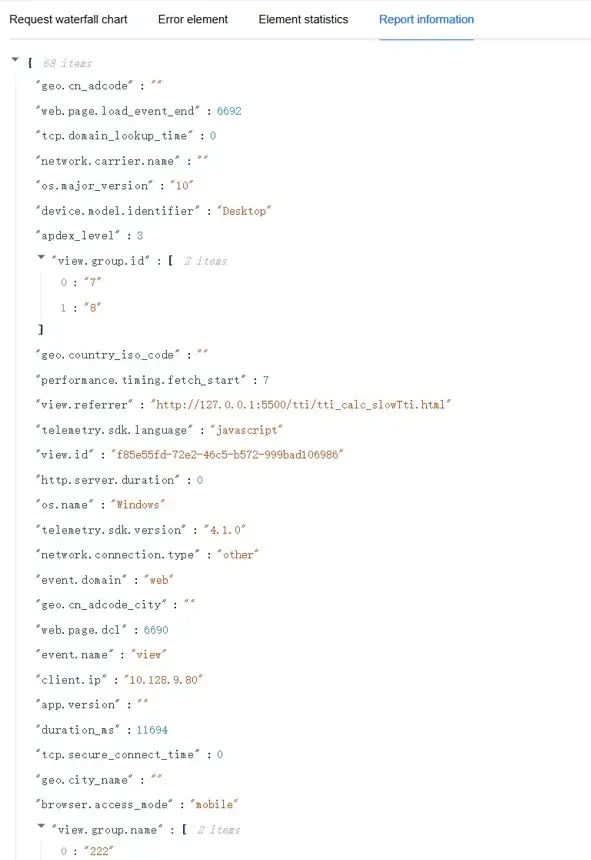
Displays the original information for this Trace Detail Tracking.