Operation
Operation user experience analysis is primarily used to monitor and analyze the response time and availability of user click operations on pages. Optimizing operation user experience helps improve user conversion rates at key steps.
Feature Overview
Filter Conditions

You can filter by the following dimensions:
- Device name
- Device model
- App version
- Operating system
- Operating system major version
- Browser name
- Browser major version
- Region
- Carrier
- Access method
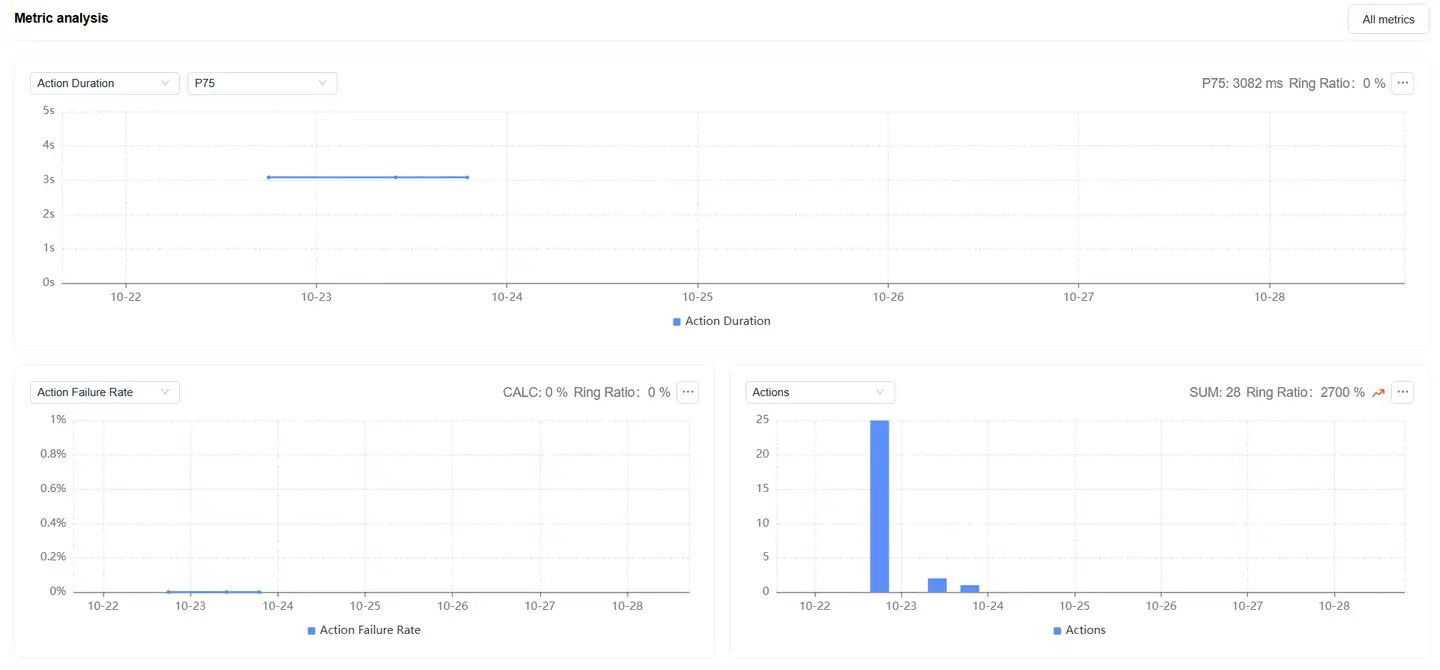
Metric Analysis
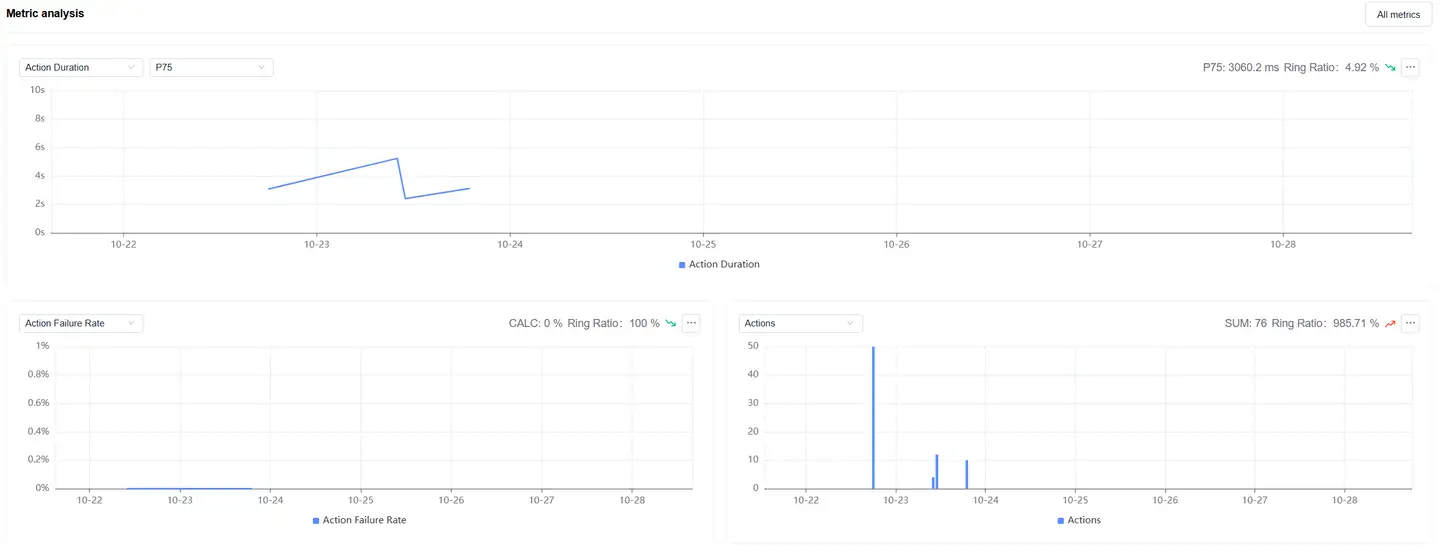
Displays trend charts of operation performance metrics under the filter conditions:
- Supports filtering and analysis of performance metrics as needed
- Time-based performance metrics support multiple statistical methods:
- Average
- P50
- P75 (default)
- P95
- P99
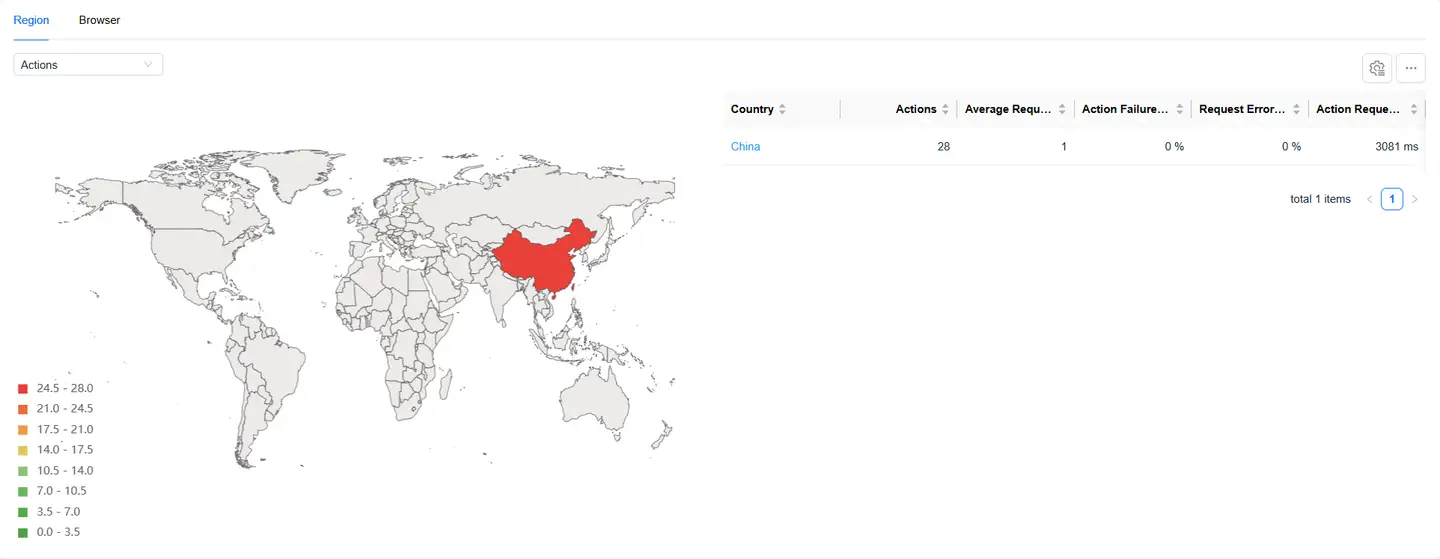
Dimension Analysis
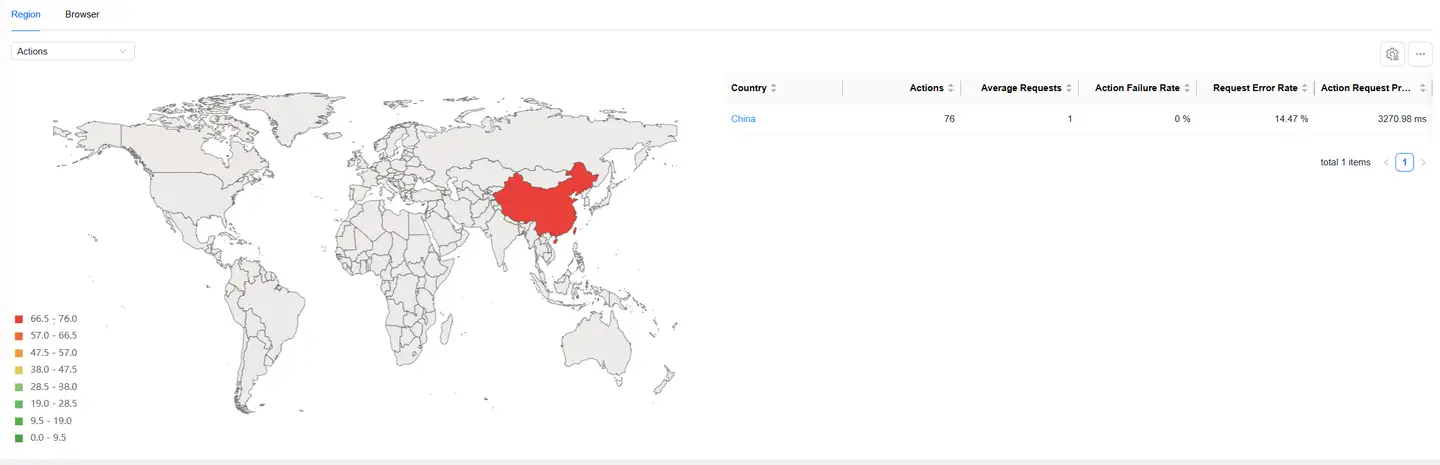
Shows the distribution of operation performance by region:
- The map can be drilled down to province/state level
- After map drill-down, the corresponding region is added to the filter conditions
- All modules on the page display performance data after filtering
- You can select operation performance metrics on the left to analyze their performance across different regions
- The list supports customizable headers
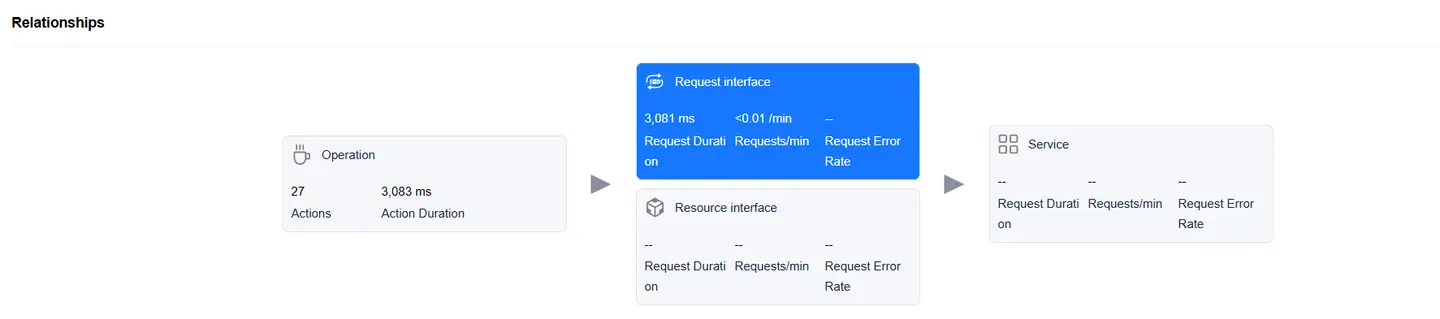
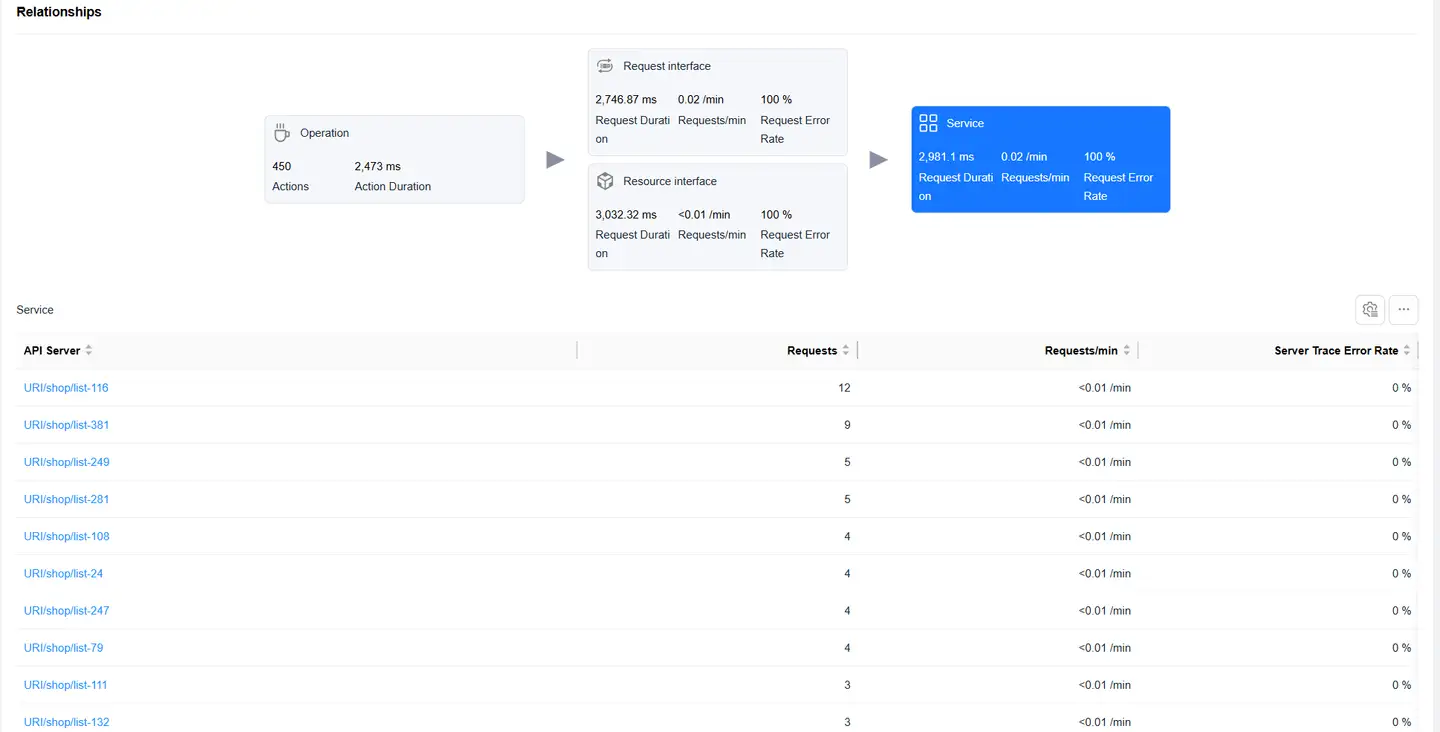
Relationship Topology
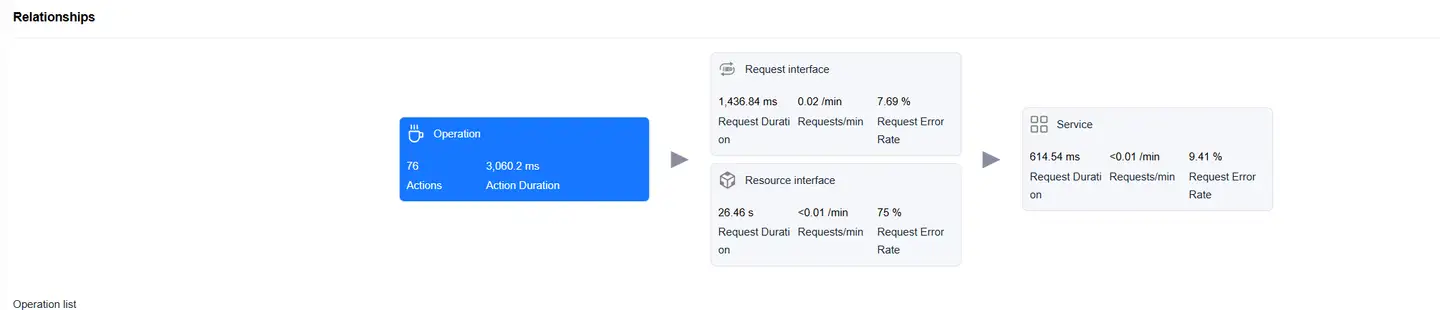
Displays the complete link between user operations and backend services, helping to analyze performance bottlenecks.
Data Views
Operation View
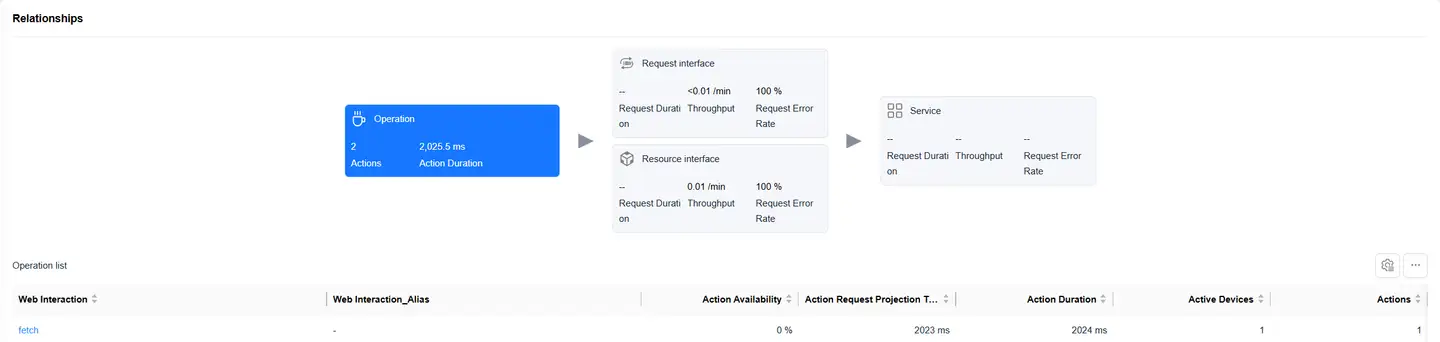
The Operation card is selected by default, with the operation performance data list displayed at the bottom. The list includes:
- Web operation
- Operation availability
- Operation count
- Request count
- Operation request projection time
- Average request count
- Operation time
- Active device count
- Request error rate
- Operations per minute
- Failed operation count
- Failed operation user count
- Operation failure rate
Click on an operation in the list to enter Operation Detail Analysis, which displays detailed data for that operation.
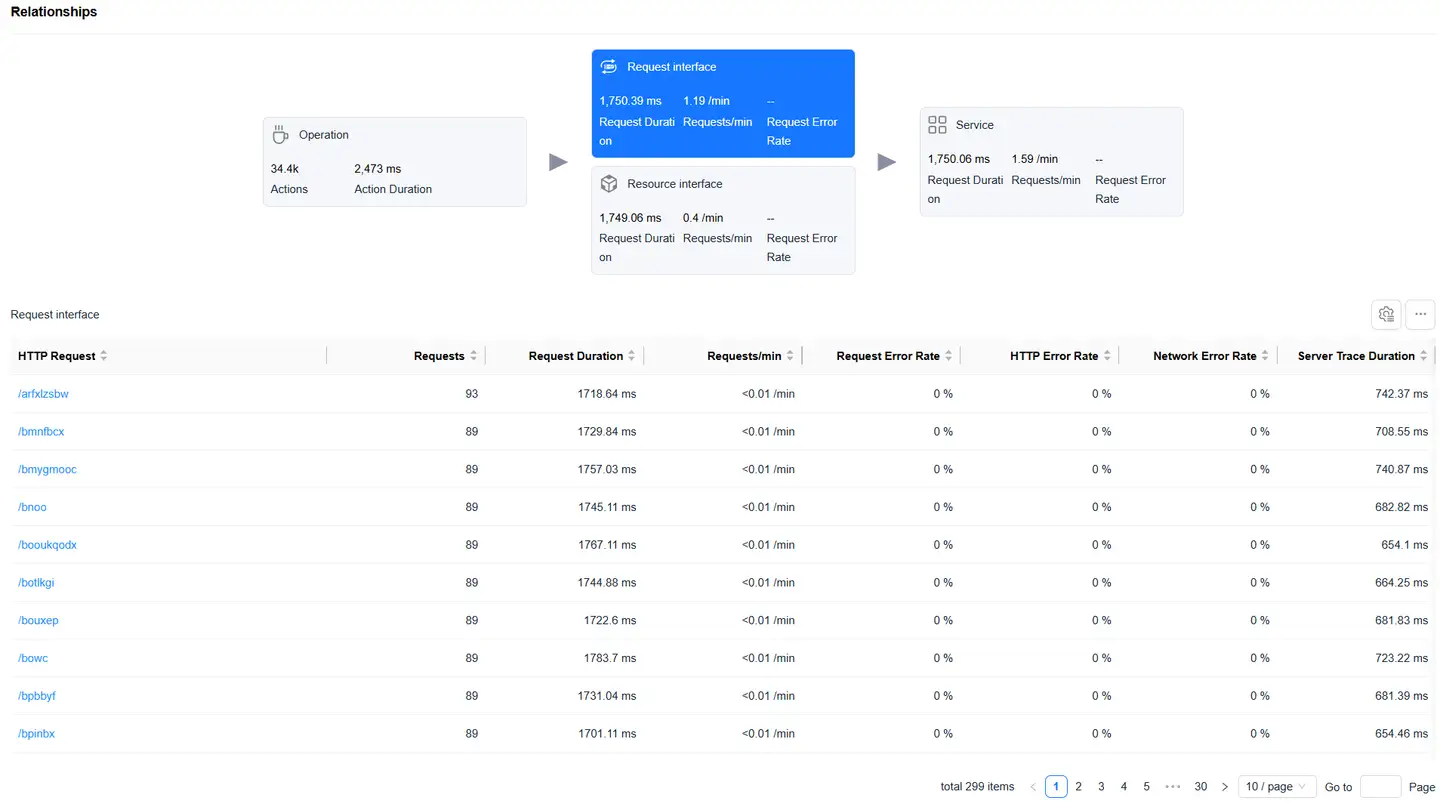
Request Interface View
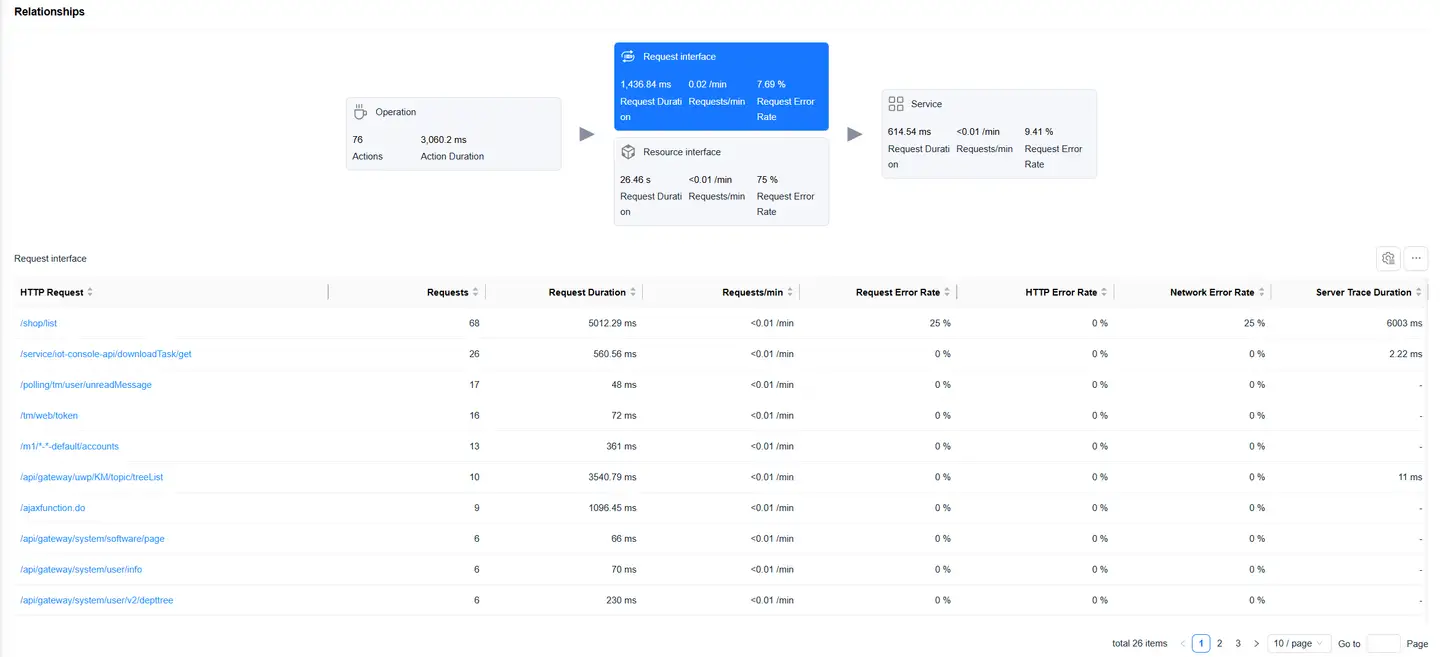
Select the Request Interface card to display the list of requests with "mime-type as text or json". The list includes:
- HTTP request
- Request count
- Request time
- Requests per minute
- Request error rate
- HTTP error rate
- Network error rate
- Server-side trace time
- Slow request count
- Slow request percentage
- Server-side trace error rate
- Upstream traffic consumption
- Downstream traffic consumption
- Availability
Click on an HTTP request to enter Request Detail Analysis, which displays detailed data for that HTTP request.
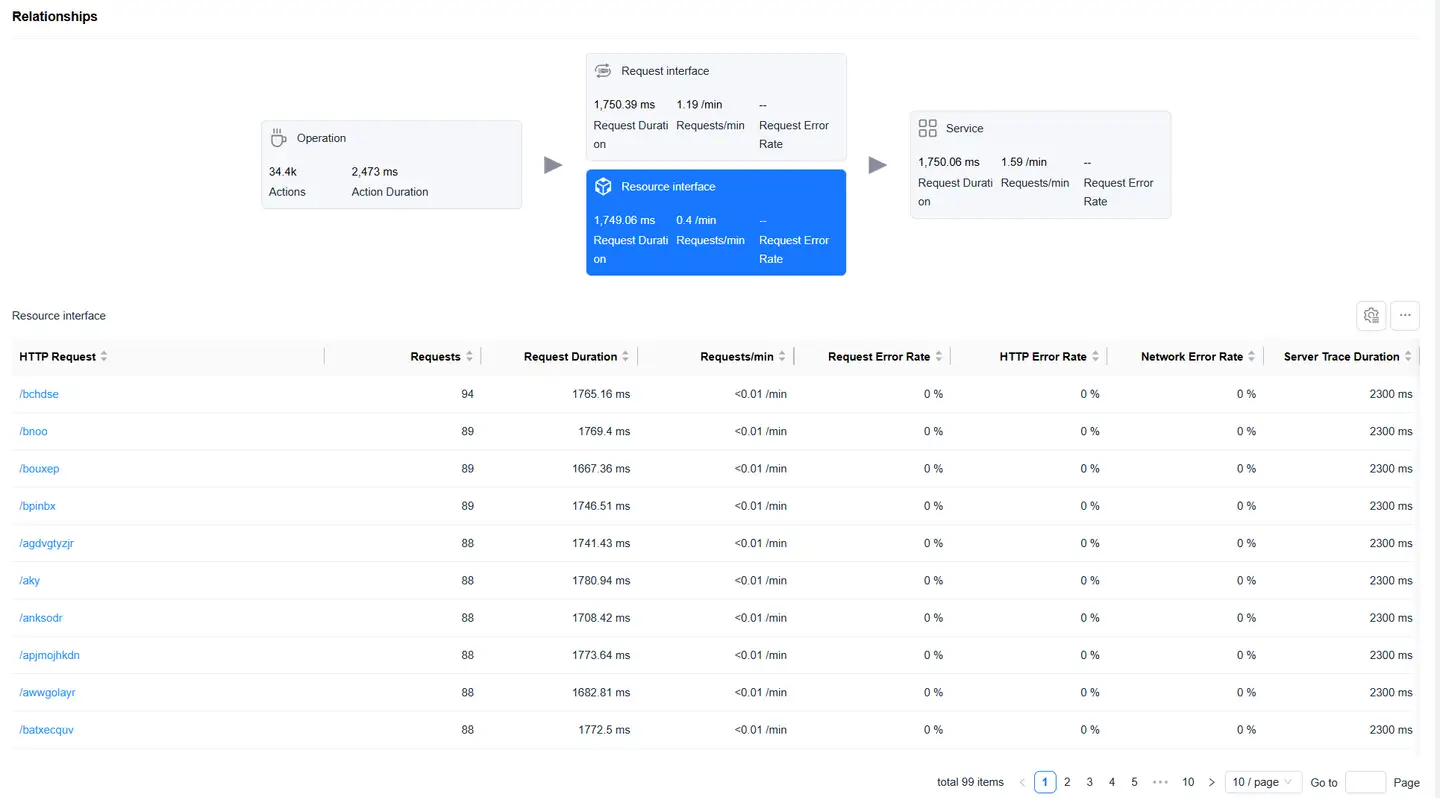
Resource Interface View
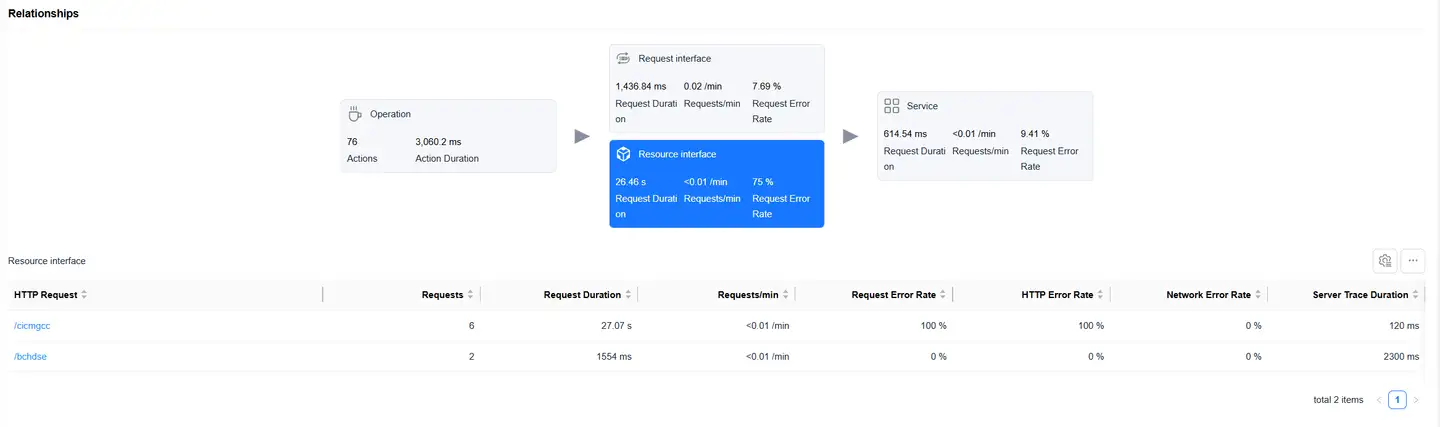
Select the Resource Interface card to display the resource request data list. The list includes:
- HTTP request
- Request count
- Request time
- Requests per minute
- Request error rate
- HTTP error rate
- Network error rate
- Server-side trace time
- Slow request count
- Slow request percentage
- Server-side trace error rate
- Upstream traffic consumption
- Downstream traffic consumption
- Availability
Click on an HTTP request to enter Request Detail Analysis, which displays detailed data for that HTTP request.
Service View
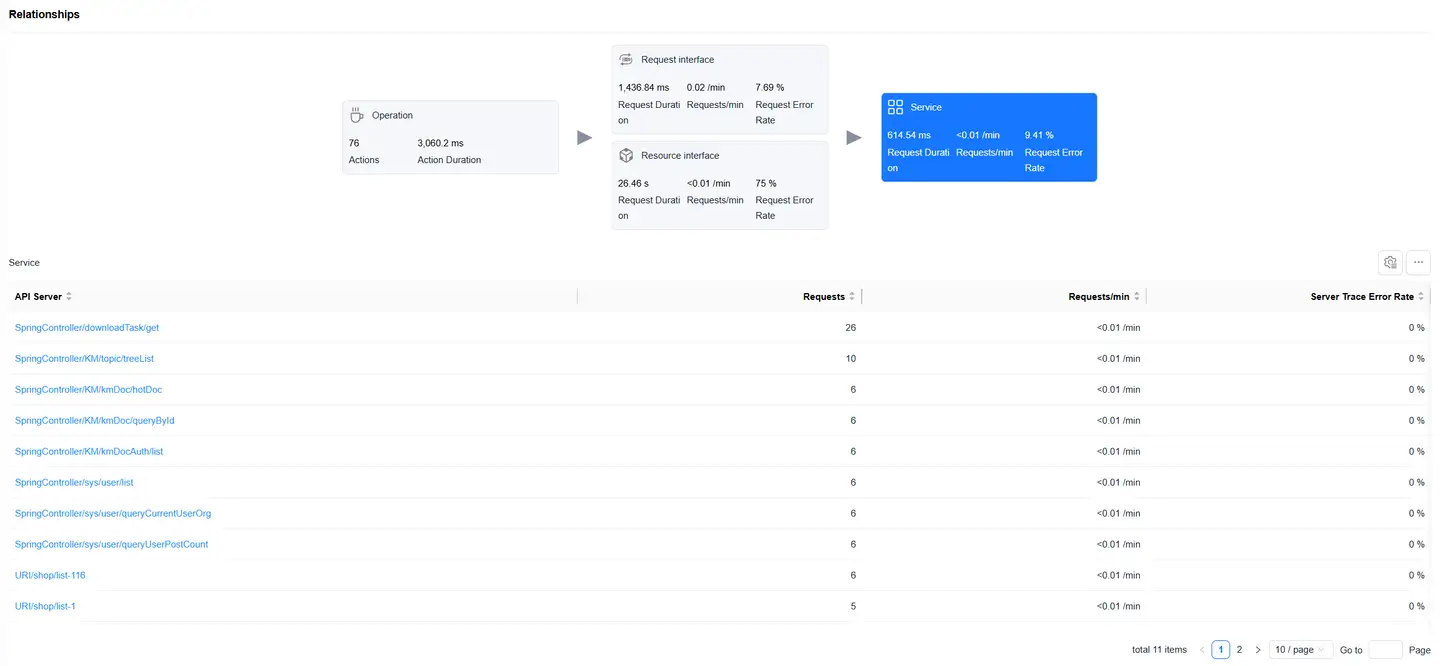
Select the Service card to display the backend service list (requires backend integration with Tingyun APM agent). The list includes:
- Backend service
- Request count
- Requests per minute
- Server-side trace error rate
Operation Detail Analysis
Filter Conditions

You can filter by the following dimensions:
- Device name
- Device model
- App version
- Operating system
- Operating system major version
- Region
- Carrier
- Access method
Metric Analysis
Displays trend charts of operation performance metrics under the filter conditions:
- Supports filtering and analysis of performance metrics as needed
- Time-based performance metrics support multiple statistical methods:
- Average
- P50
- P75 (default)
- P95
- P99
Dimension Analysis
Shows the distribution of operation performance by region:
- The map can be drilled down to province/state level
- After map drill-down, the corresponding region is added to the filter conditions
- All modules on the page display performance data after filtering
- You can select operation performance metrics on the left to analyze their performance across different regions
- The list supports customizable headers
Relationship Topology
Displays the complete link between a single user operation and backend services, helping to analyze performance bottlenecks.
Request Interface Analysis
Select the Request Interface card to display the list of requests with "mime-type as text or json". The list includes:
- HTTP request
- Request count
- Request time
- Requests per minute
- Request error rate
- HTTP error rate
- Network error rate
- Server-side trace time
- Slow request count
- Slow request percentage
- Server-side trace error rate
- Upstream traffic consumption
- Downstream traffic consumption
- Availability
Click on an HTTP request to enter Request Detail Analysis, which displays detailed data for that HTTP request.
Resource Interface Analysis
Select the Resource Interface card to display the resource request data list. The list includes:
- HTTP request
- Request count
- Request time
- Requests per minute
- Request error rate
- HTTP error rate
- Network error rate
- Server-side trace time
- Slow request count
- Slow request percentage
- Server-side trace error rate
- Upstream traffic consumption
- Downstream traffic consumption
- Availability
Click on an HTTP request to enter Request Detail Analysis, which displays detailed data for that HTTP request.
Service Analysis
Select the Service card to display the backend service list (requires backend integration with Tingyun APM agent). The list includes:
- Backend service
- Request count
- Requests per minute
- Server-side trace error rate
Sample Details

The details list displays all sample data for the selected operation. The list includes:
- Timestamp (occurrence time)
- Unique end-user identifier
- Session ID
- Operation time
- Request count
- Request projection time
- App version
- Country
- Province/State
- City
- And more
List features:
- Supports filtering by user ID and session ID
- Supports export
- Supports customizable headers
Click on the Session ID to jump to the session details.
Trace Detail Tracking
Click on the timeStamp in the details list to enter the Trace Detail Tracking page, which displays request information during the user operation.
Request Waterfall
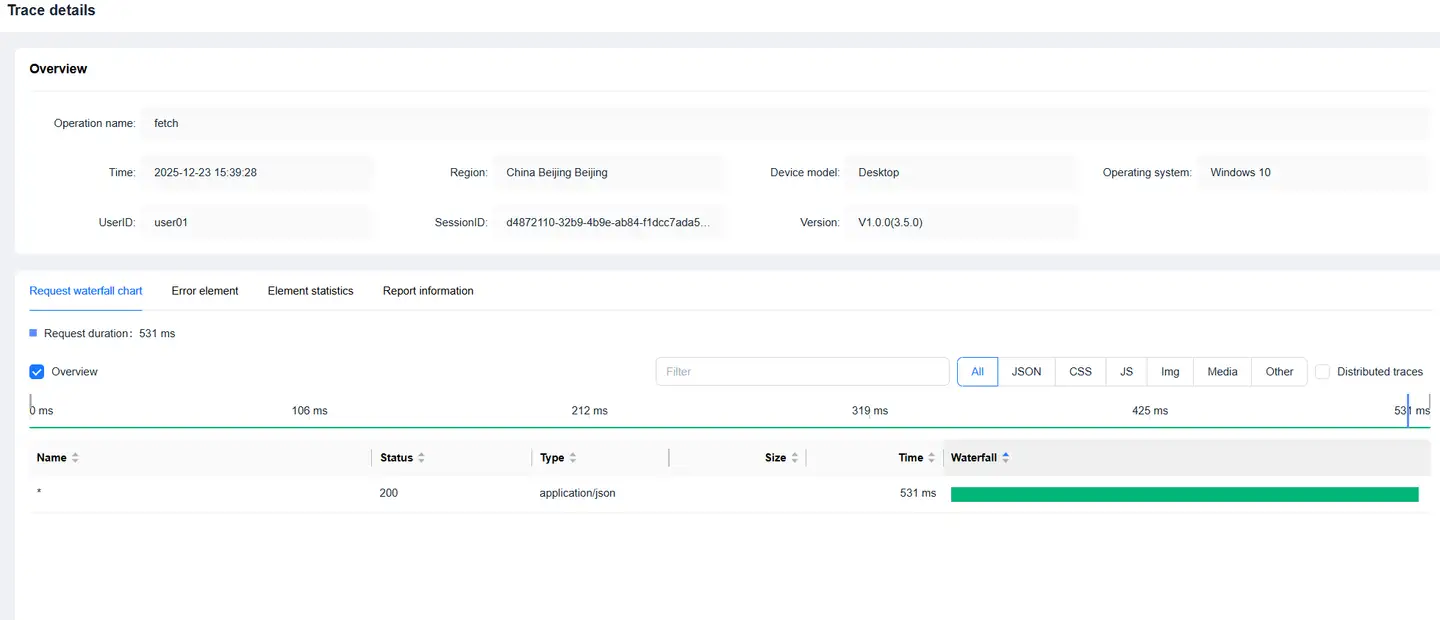
Displays request information triggered during the user operation in a waterfall format:
- Supports filtering by request type
- Supports searching request URLs
Report Information
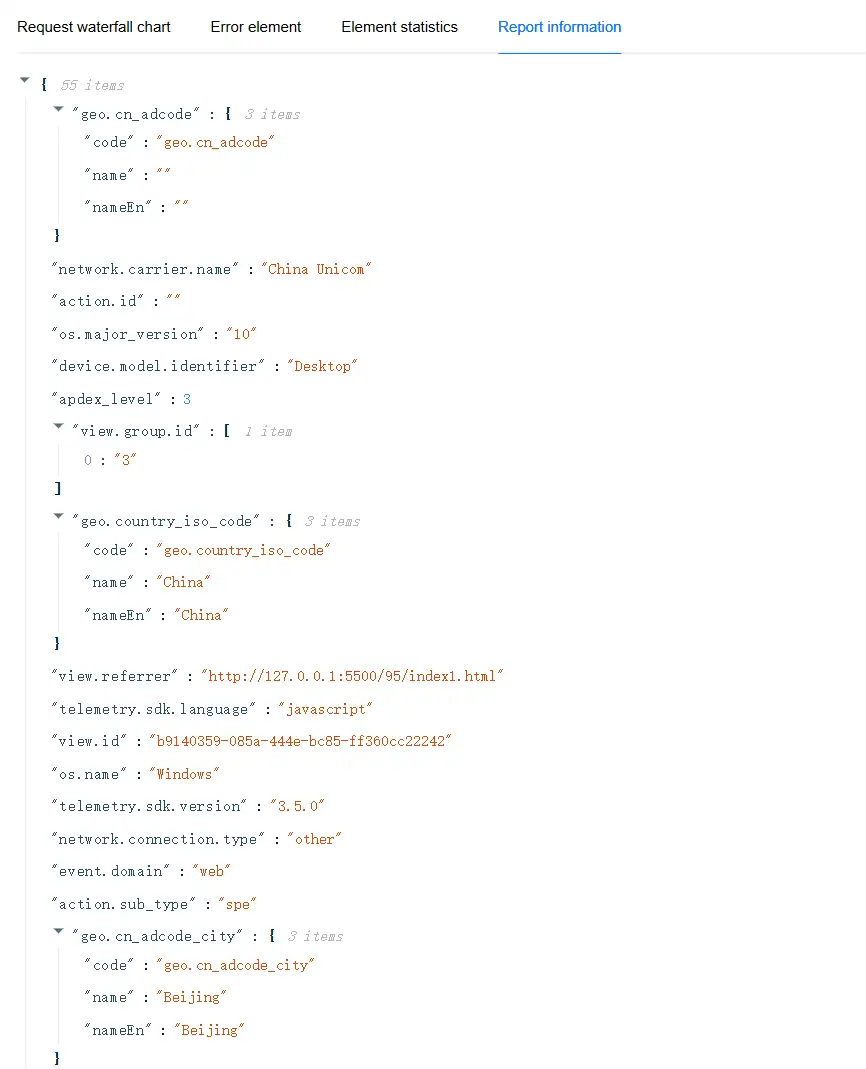
Displays the original information for this Trace Detail Tracking.