JS Error
JS error analysis is primarily used to analyze JavaScript errors that occur when pages are accessed, and to statistically analyze the causes of these JS errors.
Metric Analysis

Error Analysis Dimensions

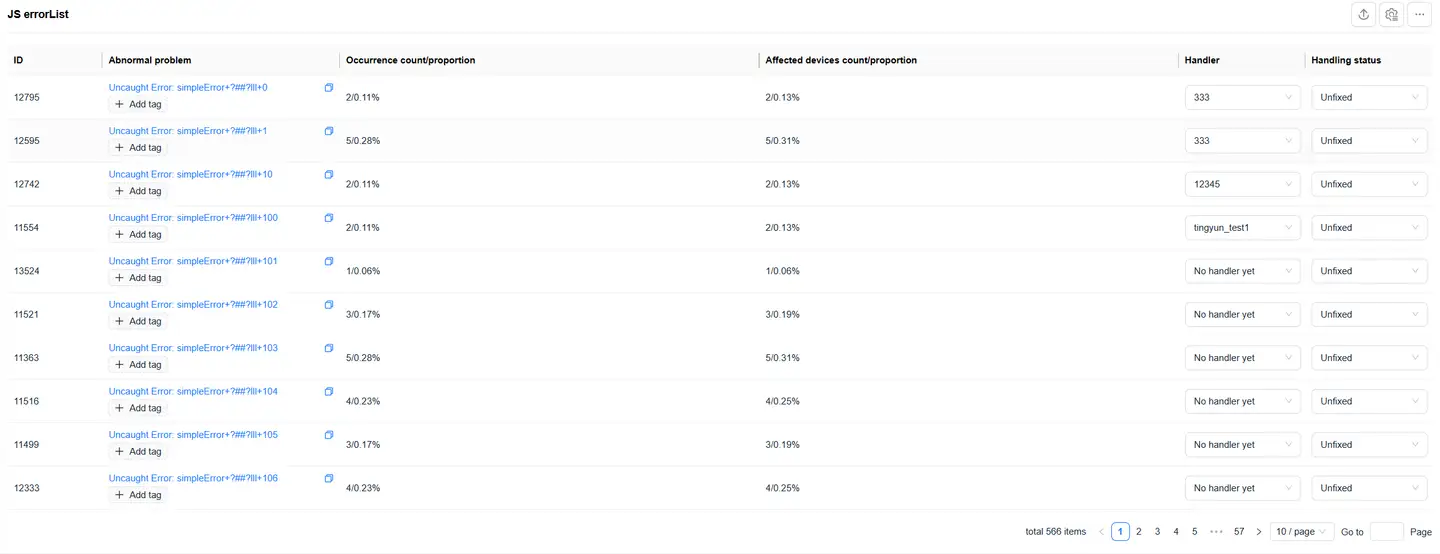
- Analysis by Error Message:
- Error message
- Error percentage
- Error count
- Affected user count
- Handler (assignable)
- Status (configurable)
JS Error List
Error Tracking Analysis
Error Tracking Records
- Click on the JS file name or error message to view detailed error records
- Supports custom dimension filtering:
- First upload custom information (see Custom Additional Attributes)
- Configure custom dimension fields in Application Settings > Custom Dimensions > General Configuration
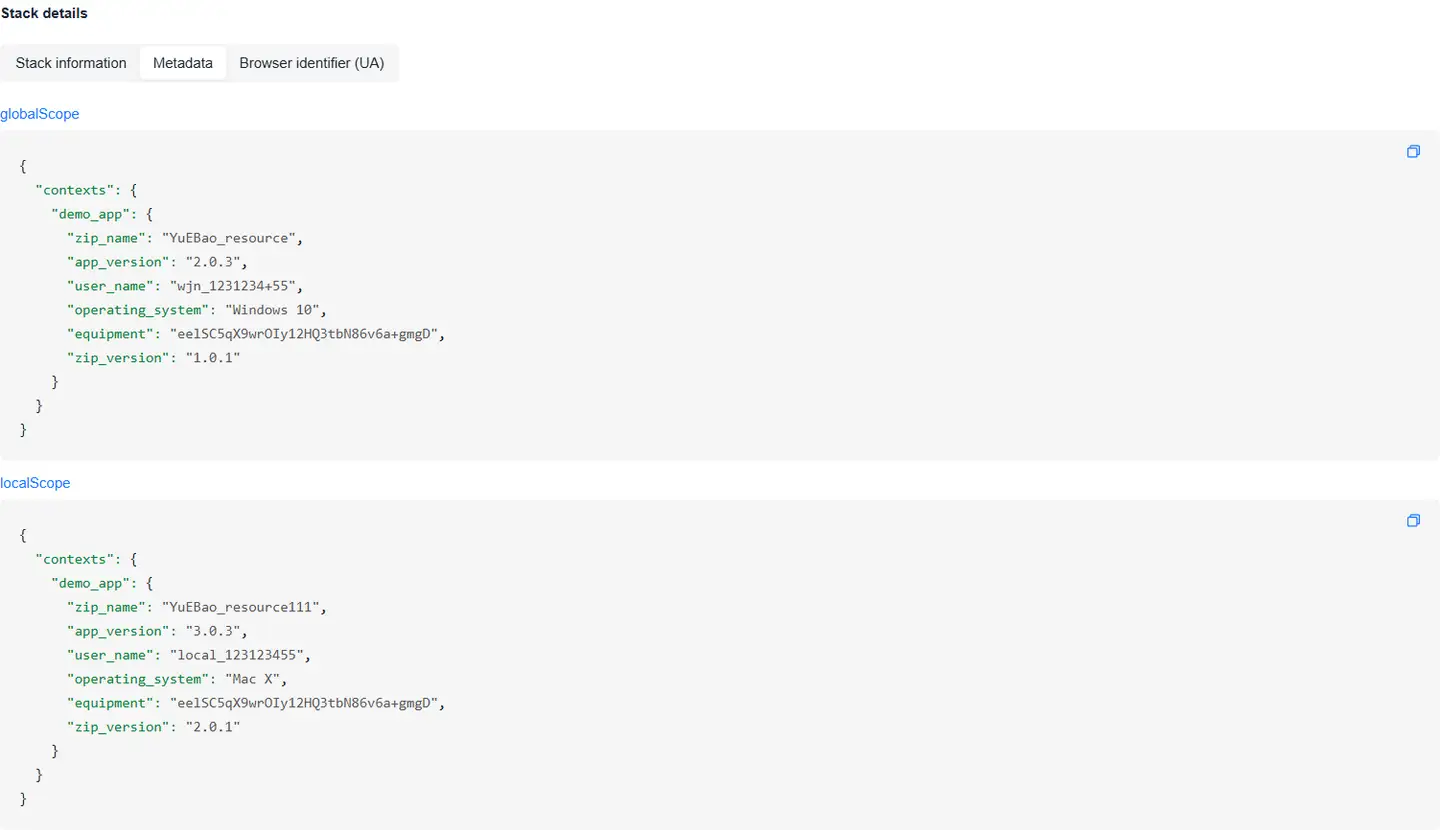
Error Details View
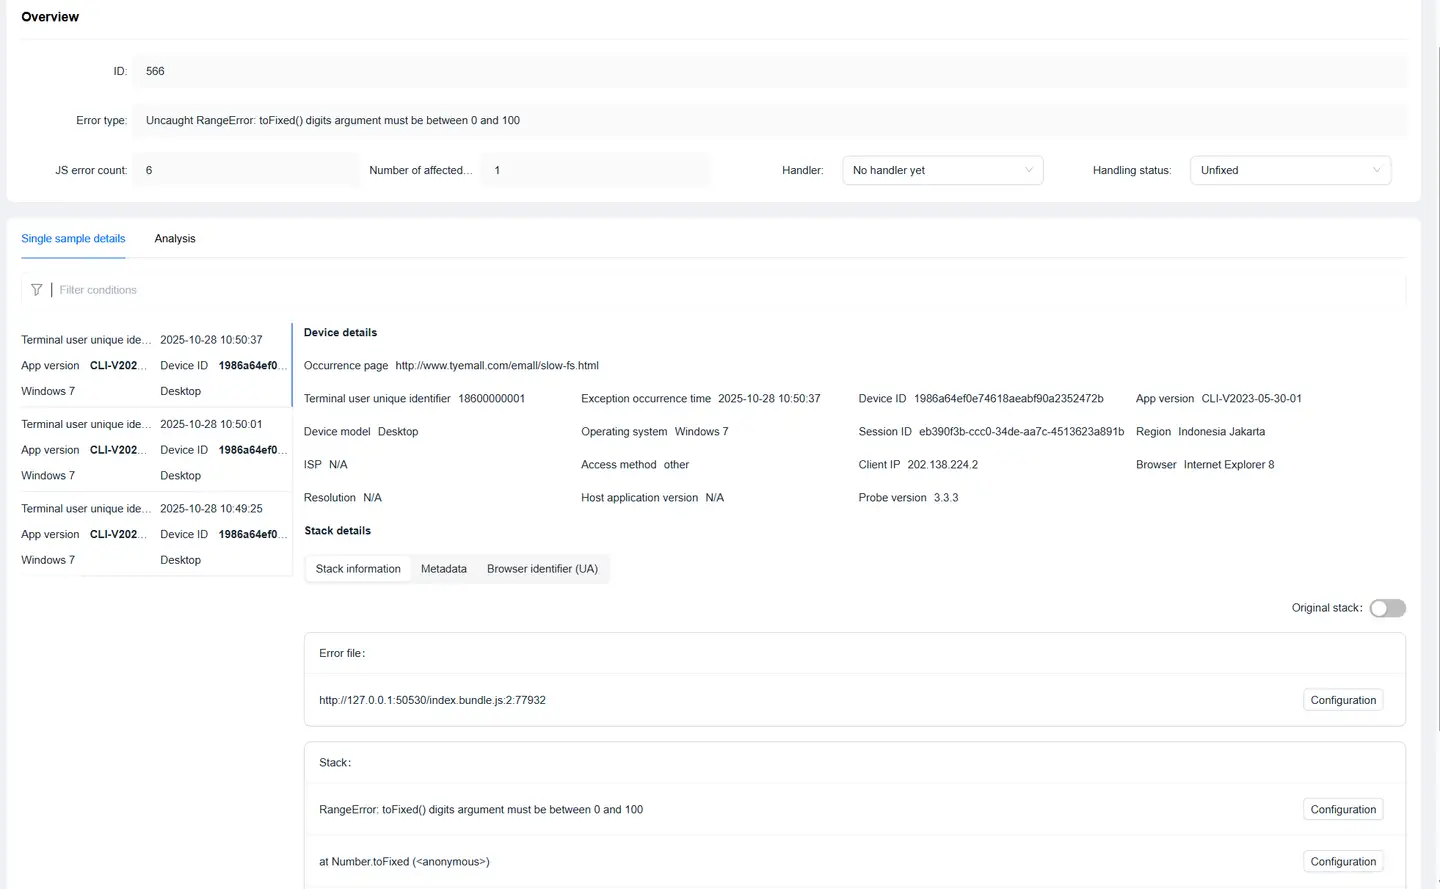
Click on an error record to enter the Error Details page, where you can view:
- JS error file name
- Error page URL
- Error file
- Stack information
- User information:
- UserID
- IP address
- SessionID
- Device ID
- Environment information:
- Browser
- Operating system
- Region
- Carrier
- Application version
- SDK version
- UA (User-Agent)
- JS error metadata information
Source Map Configuration
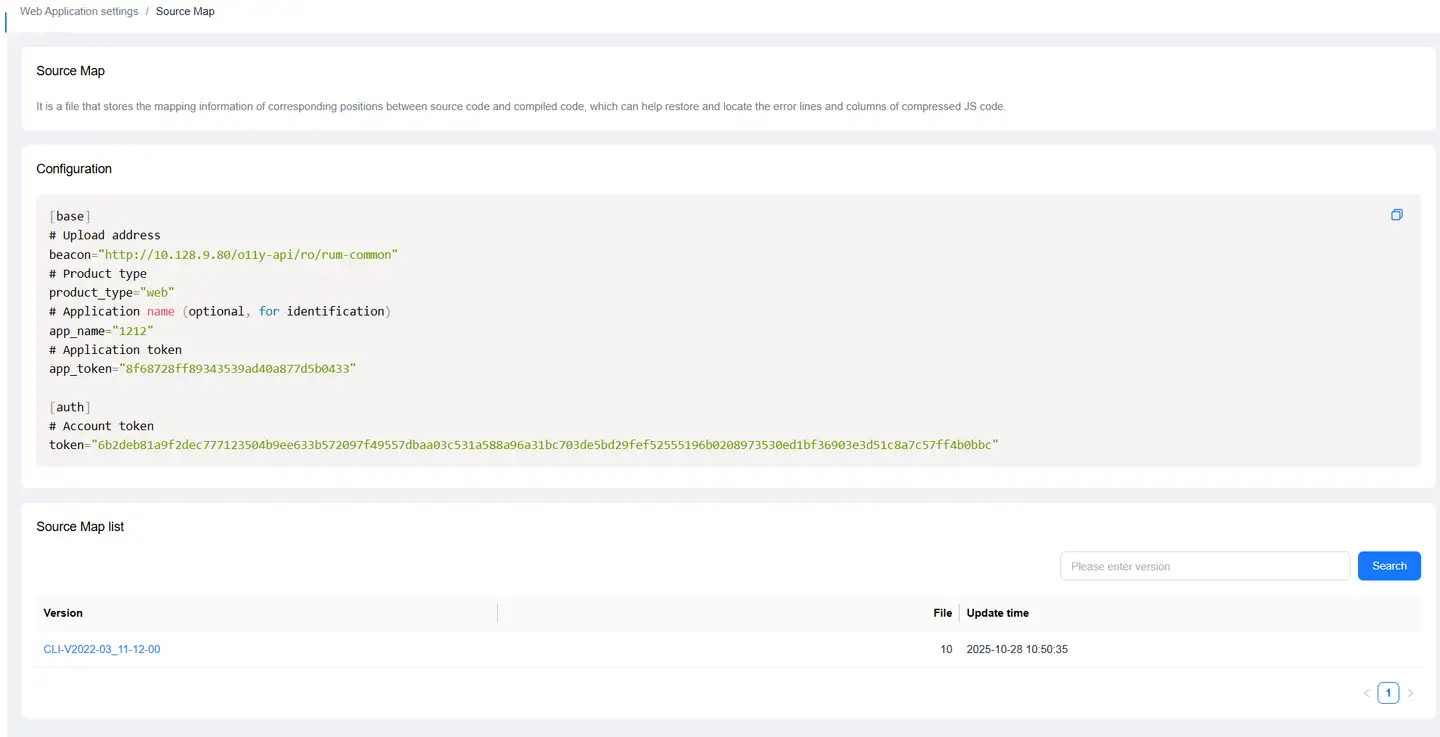
- Supports Source Map configuration for the entire JS file
- Supports separate Source Map configuration for specific stacks
- Source Map is used to restore and locate compressed JS code error lines and columns
- For configuration methods, see Source Map
Related Configuration
Breadcrumb Configuration
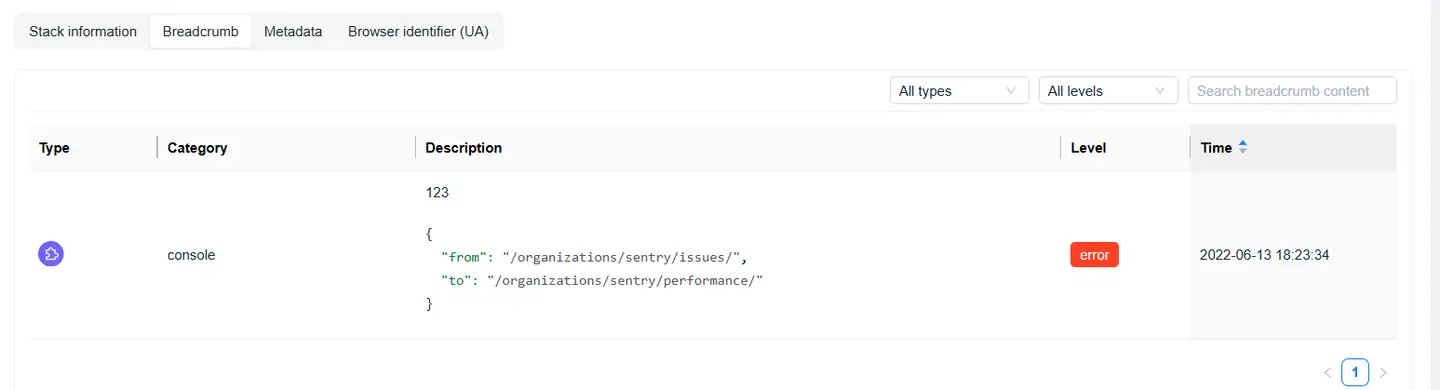
Refer to Report JS Errors and Add Breadcrumbs
Metadata Configuration
Refer to Custom Additional Attributes