setData
The analysis of setData metrics allows for convenient collection and segmentation of setData performance.
Metric Collection
-
Collects data throughout the entire App runtime lifecycle.
-
setData is differentiated by page dimension.
-
Single-point collection, update time exceeding 1 second is collected as a single sample, with content limitations (taking the top 10 data points per page sorted by rendering time).
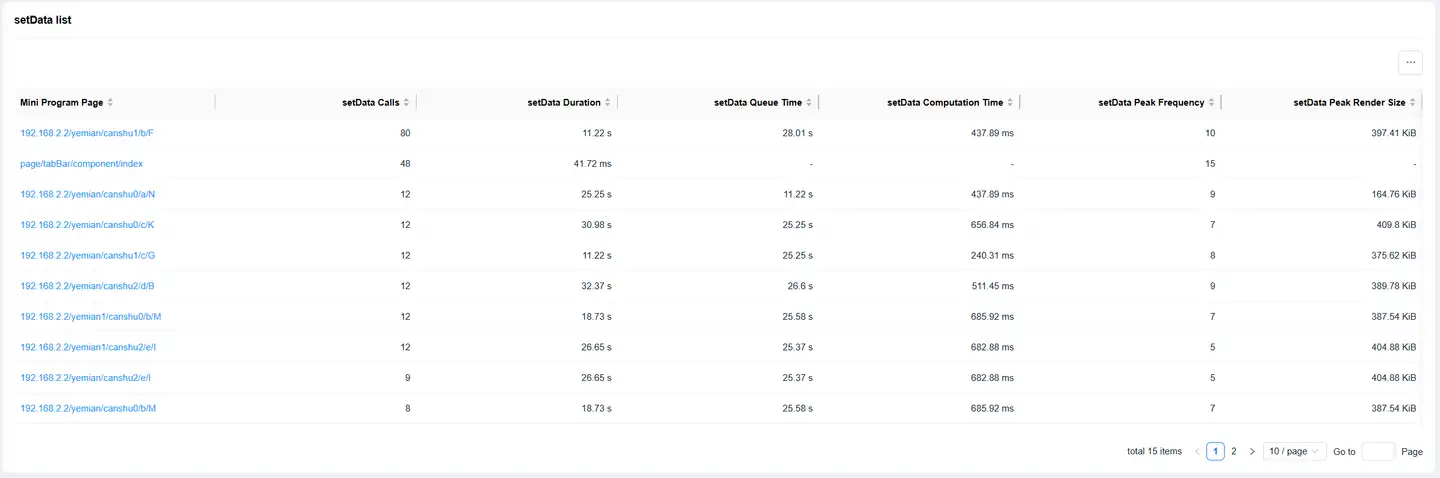
setData List
The list displays relevant information about metrics for the corresponding page.
-
Page: Displays the path of the current page.
-
Alias: Supports alias configuration, for detailed description refer to Page Analysis.
-
Time Consumption: The sum of setData time consumption for each page during the upload period.
-
Queue Time: The sum of setData queue time for each page during the upload period.
-
Calculation Time: The sum of setData calculation time for each page during the upload period.
-
Peak Frequency: Calculates the peak number of calls per second within the currently selected time period.
Note: When selecting the "10:00~11:00" time period, the peak frequency displays the value of the second with the most visits within that hour.
-
Peak Rendering Size: Maximum rendering content byte size.
-
Enter the page path in the search box, then click the search icon to view information for a specific page. Supports fuzzy search and is not case-sensitive.
-
Pages can be added to dashboards and smart reports.
setData Analysis
Click on the page path in the setData list to jump to the setData analysis details.
The page supports adding filter conditions. Click the Filter Conditions prompt box to display filter conditions: network type, carrier, region, SDK version, application version, DataPath, and WeChat version. Click on the corresponding condition to query page data for the specified condition.
Metric Analysis

setData analysis conducts trend analysis and dimension analysis from four aspects: time consumption, queue time, calculation time, and call count.
Trend analysis displays the chart corresponding to the current metric. Time consumption, queue time, and calculation time default to trend charts, while call count defaults to a vertical bar chart.
Dimension Analysis

Dimension analysis supports selecting filter conditions, including: WeChat SDK version, application version, and DataPath.
SDK Version and Application Version:
-
Chart Type: Time consumption, queue time, and calculation time default to trend charts, while call count defaults to a vertical bar chart. Supports selecting horizontal bar chart.
-
Function Options: Supports download, displays Top5 data by default, can display up to Top20.
DataPath:
-
Chart Type: All metrics default to horizontal bar charts, supports table display.
-
Function Options: Supports download, displays Top5 data by default, can display up to Top20.
Slow Time Consumption Details List
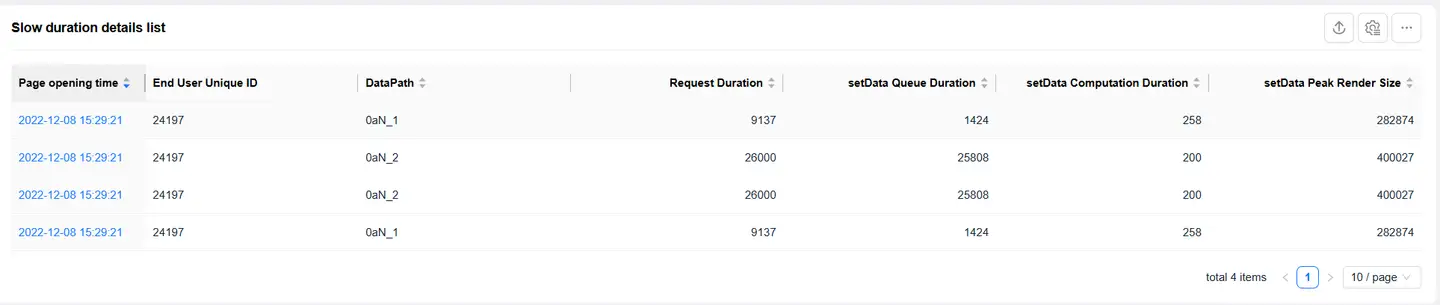
The slow time consumption details list only displays single sample details with time consumption greater than 500ms.
-
DataPath: Current data address information.
-
Time Offset: Displays the offset of the current DataPath relative to the page start time.
-
Time Consumption: The sum of setData time consumption for each page during the upload period.
-
Queue Time: The sum of setData queue time for each page during the upload period.
-
Calculation Time: The sum of setData calculation time for each page during the upload period.
-
Size: The sum of the parameter size of the setData function for each page during the upload period.
-
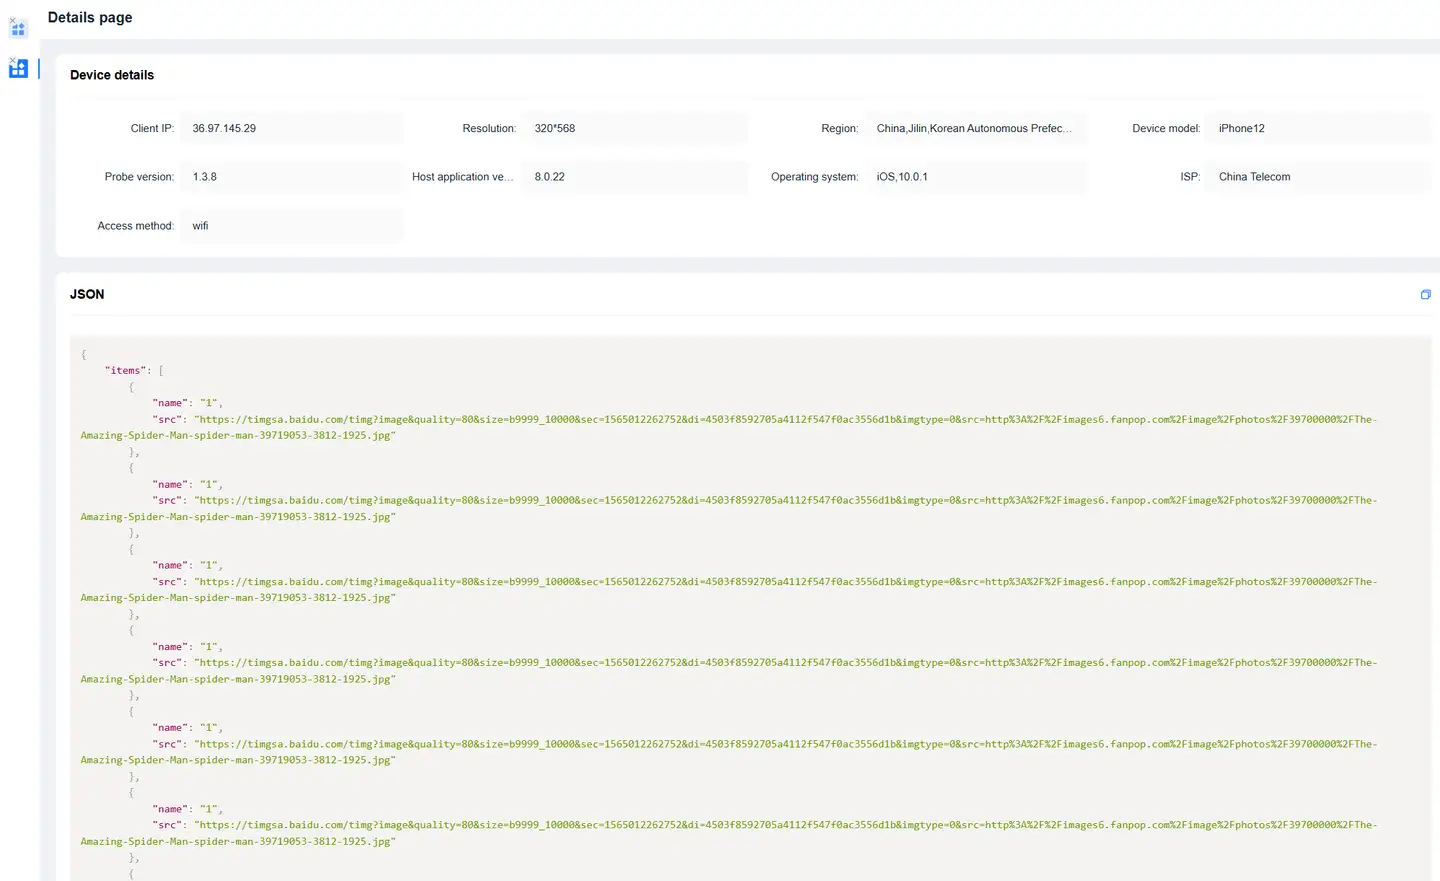
Click Details to open the details page, including: device details and JSON string.