Overview
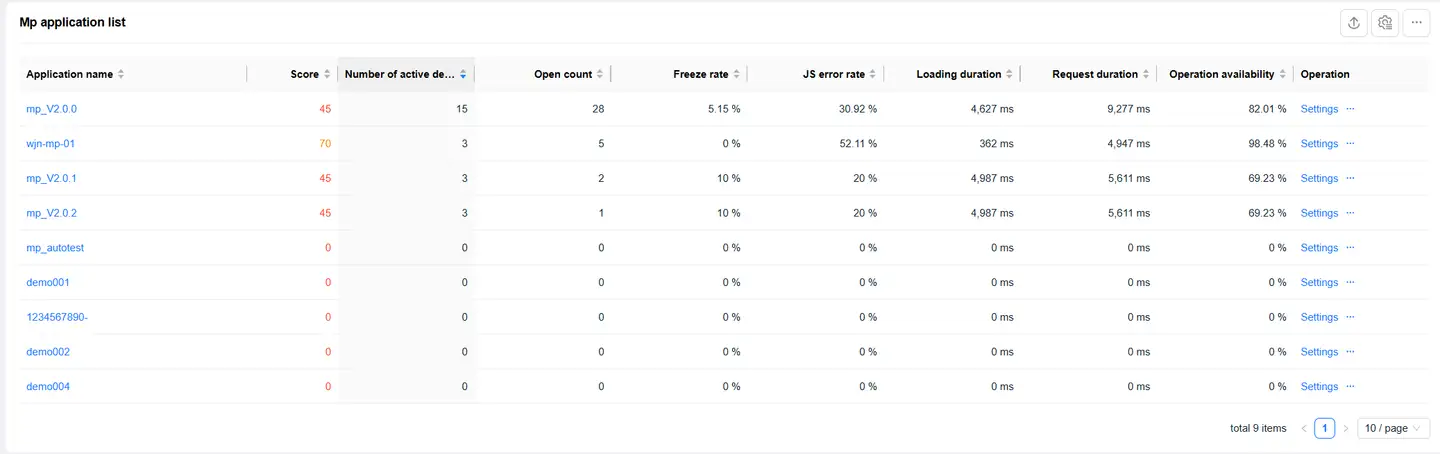
Click on an application in the Application List page to enter the Overview page, which displays the application's score and performance metric values for the selected time period.
Application Score Analysis
Score Display
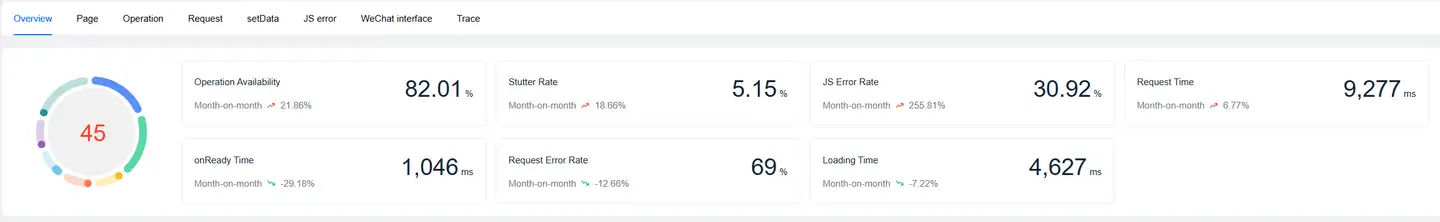
The left side displays the application's score in a pie chart, while the right side shows the performance metrics that participate in the score calculation and their period-over-period comparison.
Performance metrics that participate in the score calculation include:
- Operation Availability
- Freeze Rate
- JS Error Rate
- Request Duration
- onReady
- Request Error Rate
- Loading Duration
Score Details

You can move your mouse over the pie chart to view detailed information for each performance metric:
- Performance metric name
- Score contribution of the performance metric to the application score
- Performance metric's own score
- Performance metric value
Performance Metrics Analysis
Trend Analysis
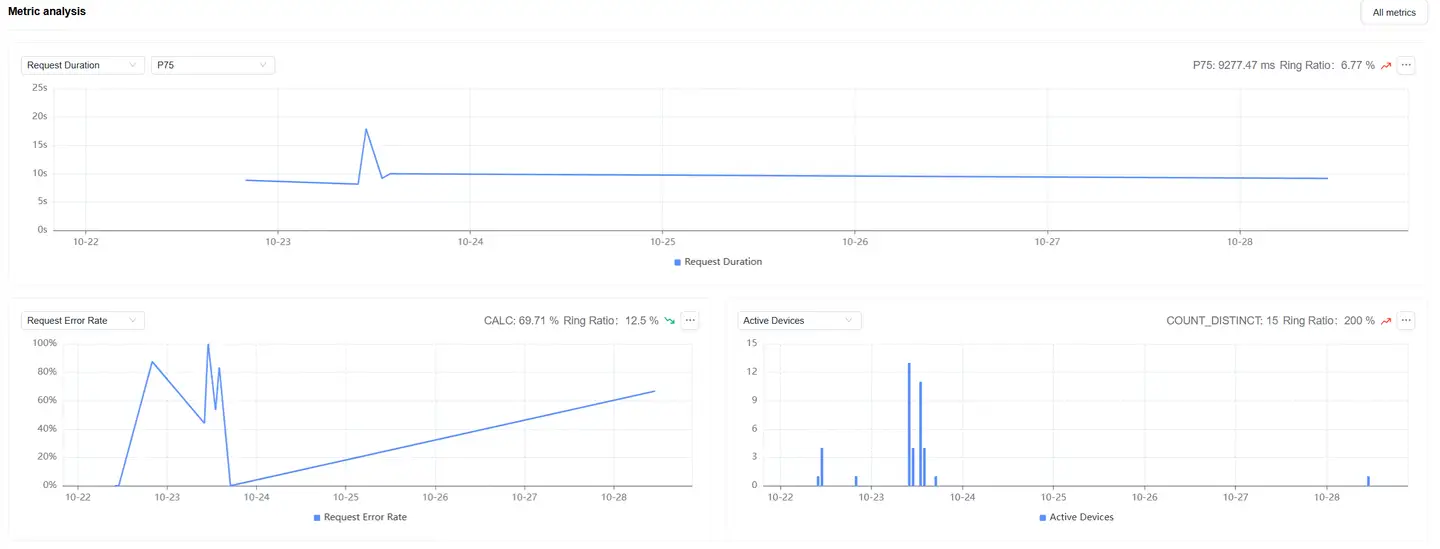
Displays trend charts of performance metrics. You can filter and analyze performance metrics as needed:
- Time-based performance metrics support multiple statistical methods:
- Average
- P50
- P75 (default)
- P95
- P99
- Supports analysis of the following metrics:
- Active Device Count
- Mini Program Open Count
Metrics System
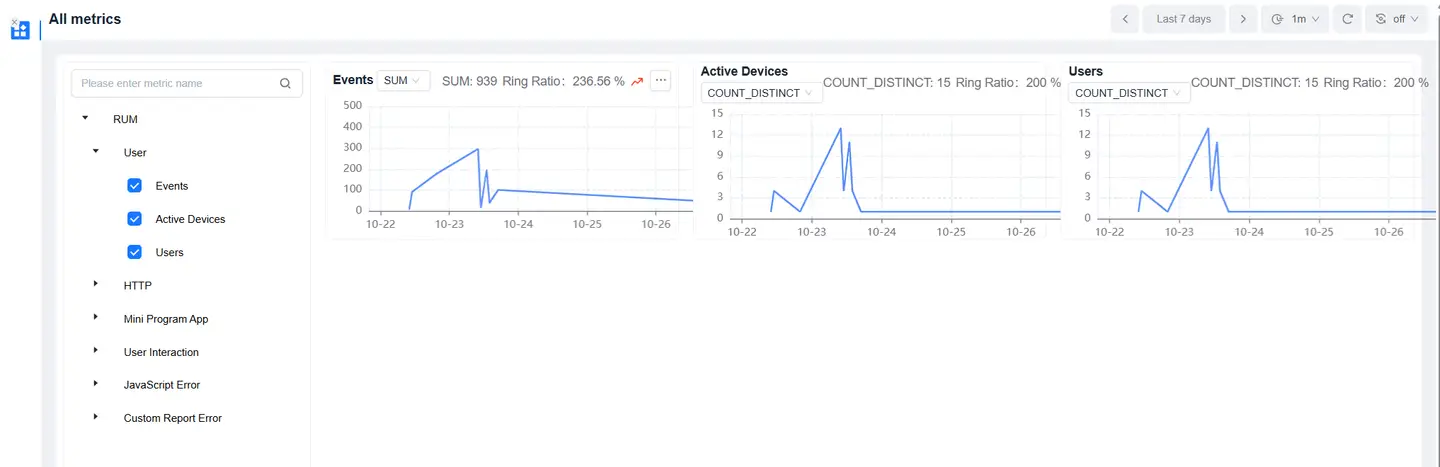
Click on All Metrics on the right to enter the Metrics System page:
- Displays attribute information for each metric
- Supports metric search
Relationship Topology Analysis
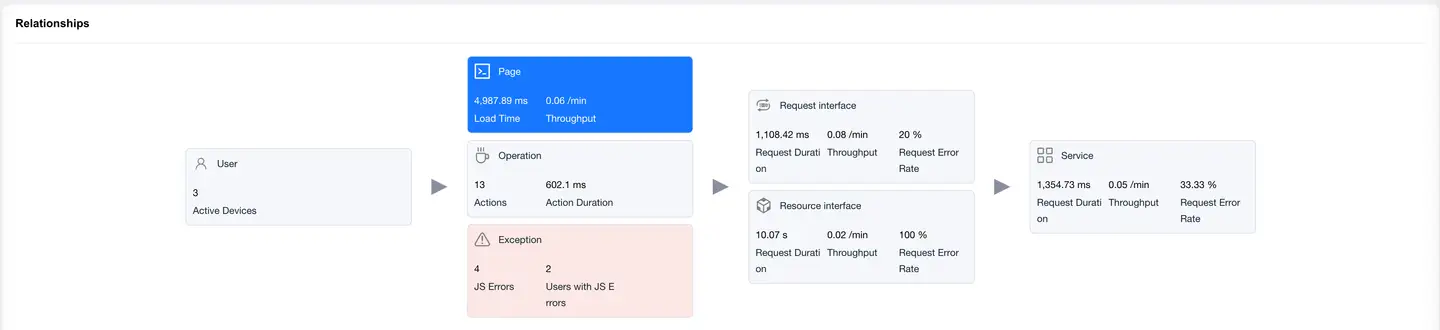
Displays the complete chain of mini program user experience and backend services, helping to analyze performance bottlenecks.
Page View
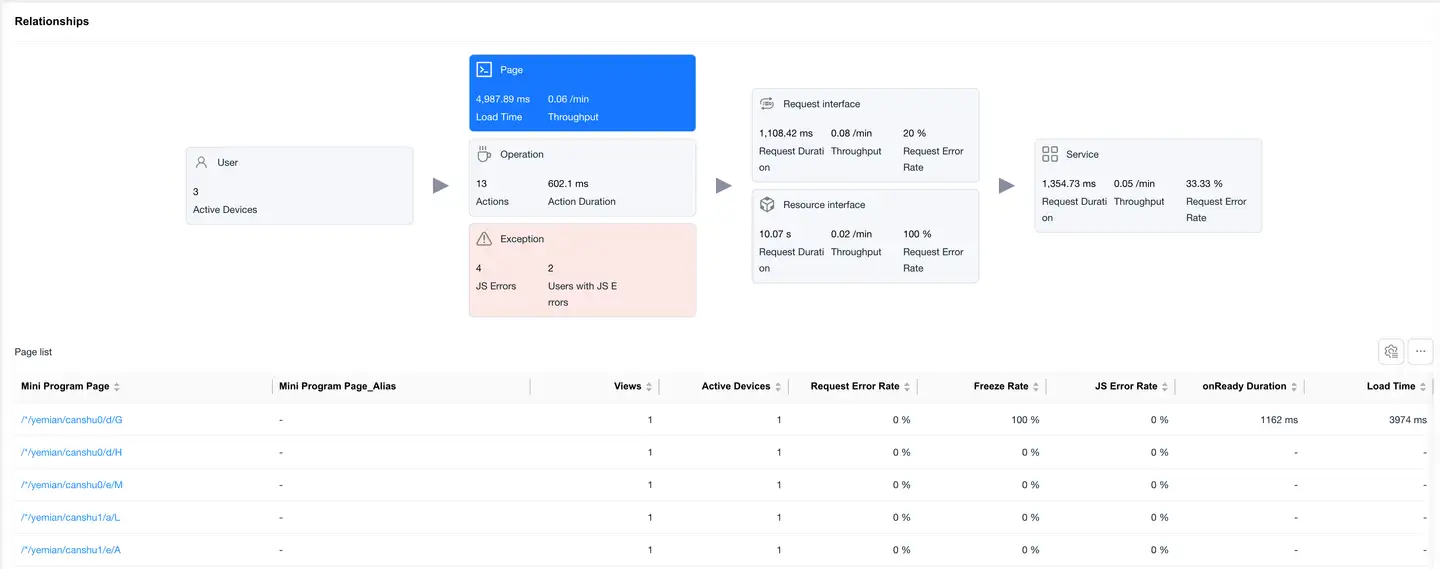
Select the Page card, and the bottom displays a list of page loading performance data, including:
- Mini Program Page
- Visit Count
- Active Device Count
- Request Error Rate
- Freeze Rate
- JS Error Rate
- Slow Page Percentage
- Abnormal Exit Page Percentage
- onReady Duration
- Loading Duration
- Request Projection Duration
- Server-side Average Duration
- Online Time
- Custom Loading Time
Click on a Mini Program Page in the list to enter the Page Detail Analysis, which displays detailed data for that mini program page.
Operation View
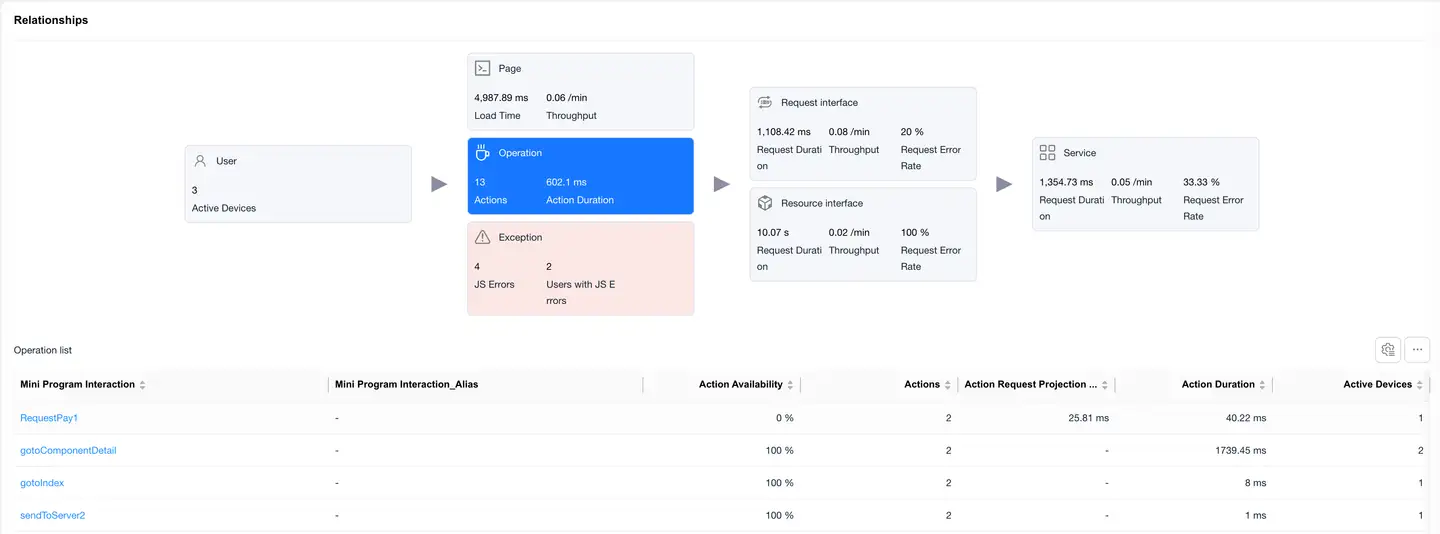
Select the Operation card, and the bottom displays a list of operation performance data, including:
- Mini Program Operation
- Operation Availability
- Operation Count
- Request Count
- Operation Request Projection Duration
- Average Request Count
- Operation Duration
- Active Device Count
- Request Error Rate
- Slow Operation Percentage
- Operations Per Minute
- Failed Operation Count
- Failed Operation User Count
- Operation Failure Rate
Click on an operation in the list to enter the Operation Detail Analysis, which displays detailed data for that operation.
Exception View
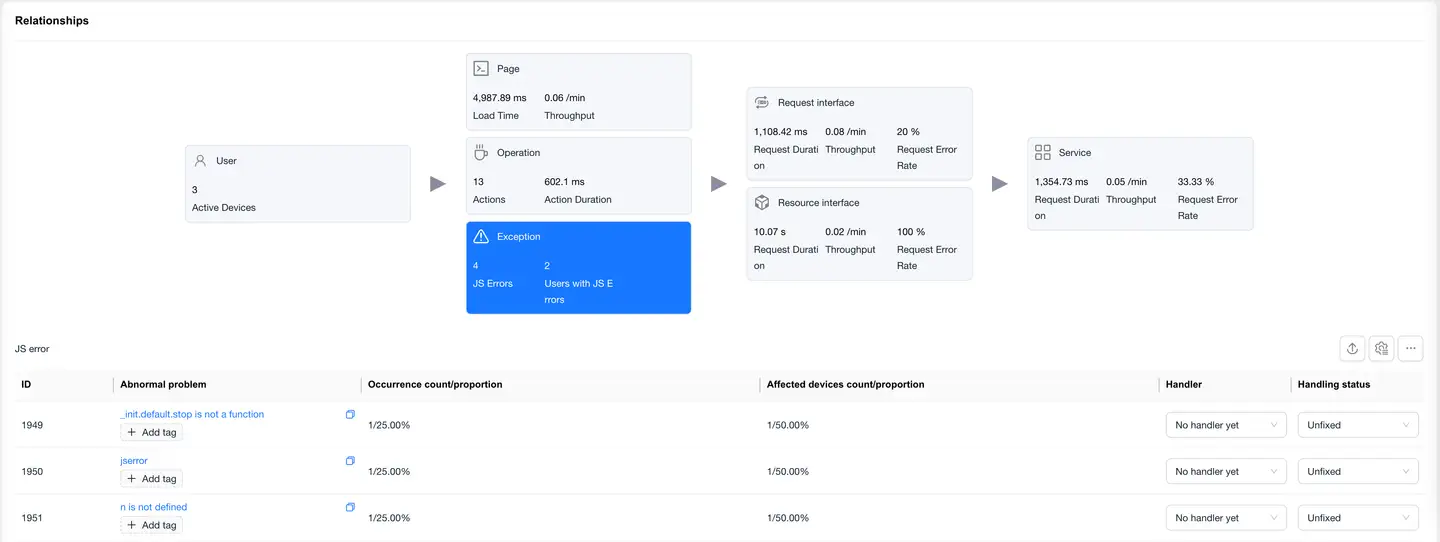
Select the Exception card, and the bottom displays a list of JS errors, including:
- Exception ID
- Exception Issue
- Occurrence Count/Percentage
- Affected Device Count/Percentage
- Handler
- Handling Status
List features:
- Supports export
- Supports custom headers
Click on an exception issue to enter the Exception Detail Analysis, which displays detailed data for that exception.
Request Interface View
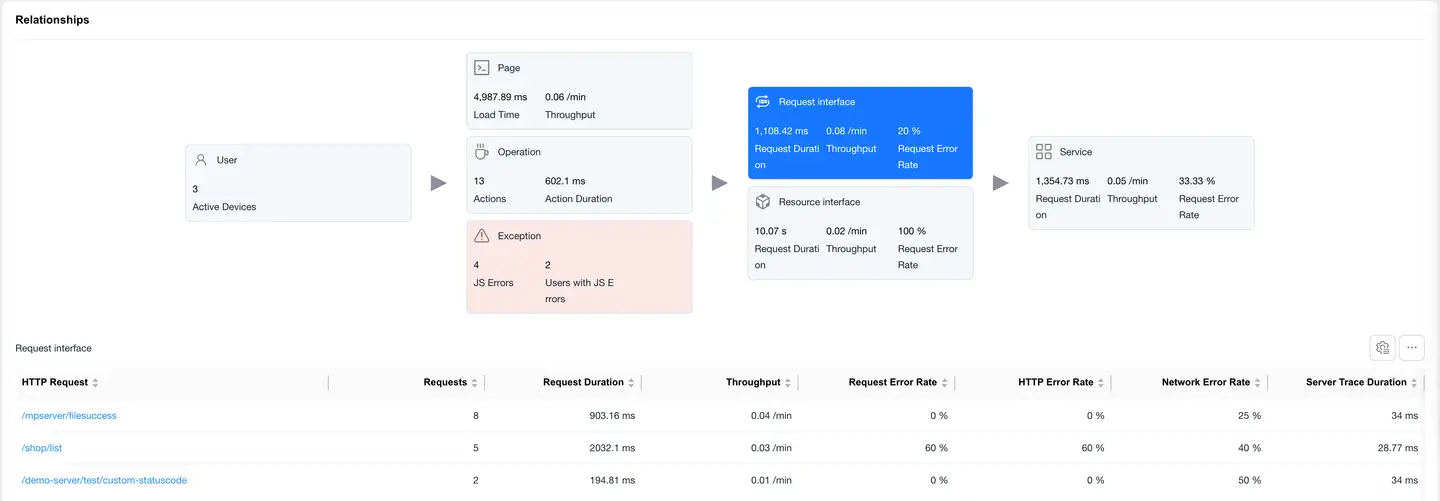
Select the Request Interface card, and the bottom displays a list of requests with mime-type as text or json, including:
- HTTP Request
- Request Count
- Request Duration
- Requests Per Minute
- Request Error Rate
- HTTP Error Rate
- Network Error Rate
- Server-side Trace Duration
- Slow Request Count
- Slow Request Percentage
- Server-side Trace Error Rate
- Upstream Traffic Consumption
- Downstream Traffic Consumption
- Availability
Click on an HTTP request to enter the Request Detail Analysis, which displays detailed data for that HTTP request.
Resource Interface Overview
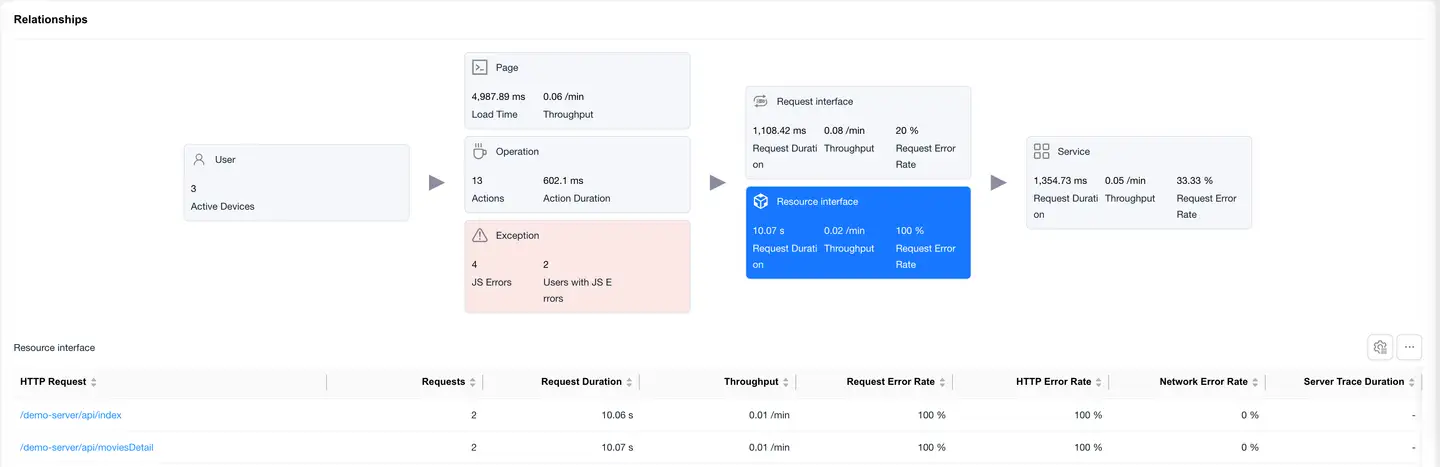
)
Select the Resource Interface card to display the loading performance data of static resources (images, JS, CSS, etc.).
List Fields
- Same fields as the request interface
- Focus on resource load time and data transfer volume
Click on an HTTP request to enter the Request Detail Analysis, which shows detailed data for that HTTP request.
Service View
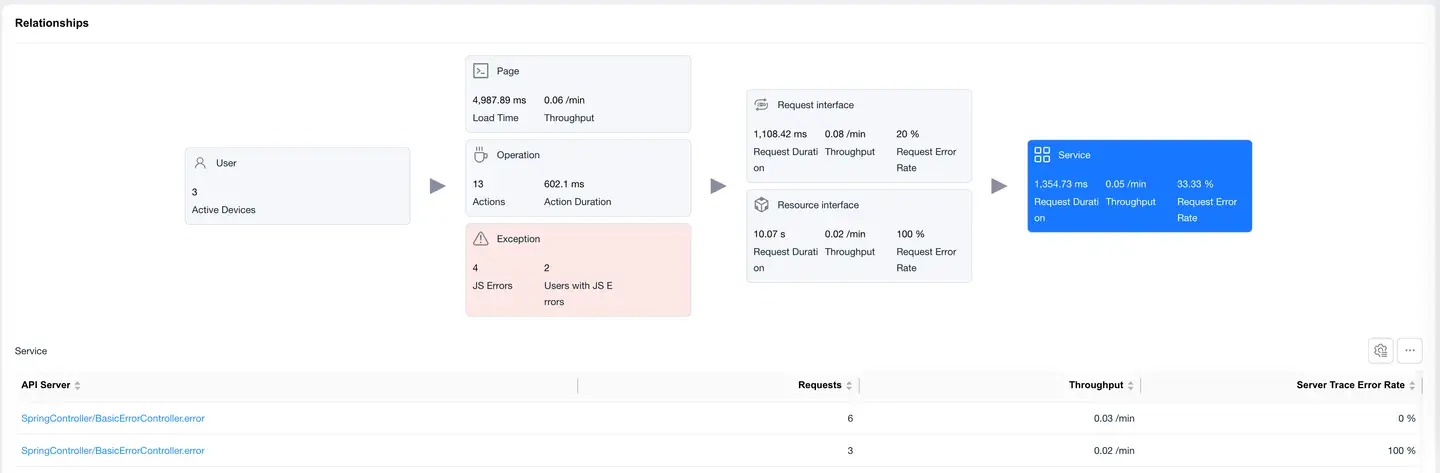
Select the Service card, and the bottom displays a list of backend services (requires backend integration with Tingyun APM agent), including:
- Backend Service
- Request Count
- Requests Per Minute
- Server-side Trace Error Rate