JS Error
JS error analysis is crucial for improving user experience, optimizing performance, and quickly locating and diagnosing issues. It helps development teams promptly fix problems affecting users, such as page crashes or slow loading, by tracking error context and user behavior paths. Additionally, JS error analysis supports data-driven decision making, identifies performance bottlenecks and error patterns, ensures business continuity, and strengthens web application security. Through long-term monitoring, teams can take preventive measures, address cross-platform compatibility challenges, and utilize personalized and automated tools to improve error management efficiency.
JS Error Rate Trend Chart
Displays the error rate, error PV, and changes over time of JavaScript errors within the selected time period. It enables development teams to identify peak periods of error occurrence, analyze the impact after specific feature updates or system changes, discover potential usage patterns, and evaluate the effectiveness of remedial measures.

Error Message List
JS error messages provide direct clues to problems that occur during code execution. They can reveal the state of variables (such as undefined or null), indicate the line of code where the error occurred, and suggest possible operations (such as attempting to call a non-existent method or access a non-existent property). By analyzing these error messages, developers can quickly locate the source of the problem, understand the context of the error, and then review and correct related logical errors, variable initialization issues, or improper object usage. This helps improve code quality, enhance program stability and robustness, and ensure that the application runs as expected.

Error Type Analysis Details
Click on "Error Message" to enter the error type analysis details page.
Metric Trend Chart
Displays the distribution of the current error type over time.

Dimension Analysis
Displays the distribution of the current error type across different dimensions, including carrier, WeChat version, device, page, country, province, city, and district - eight dimensions in total.

Details List
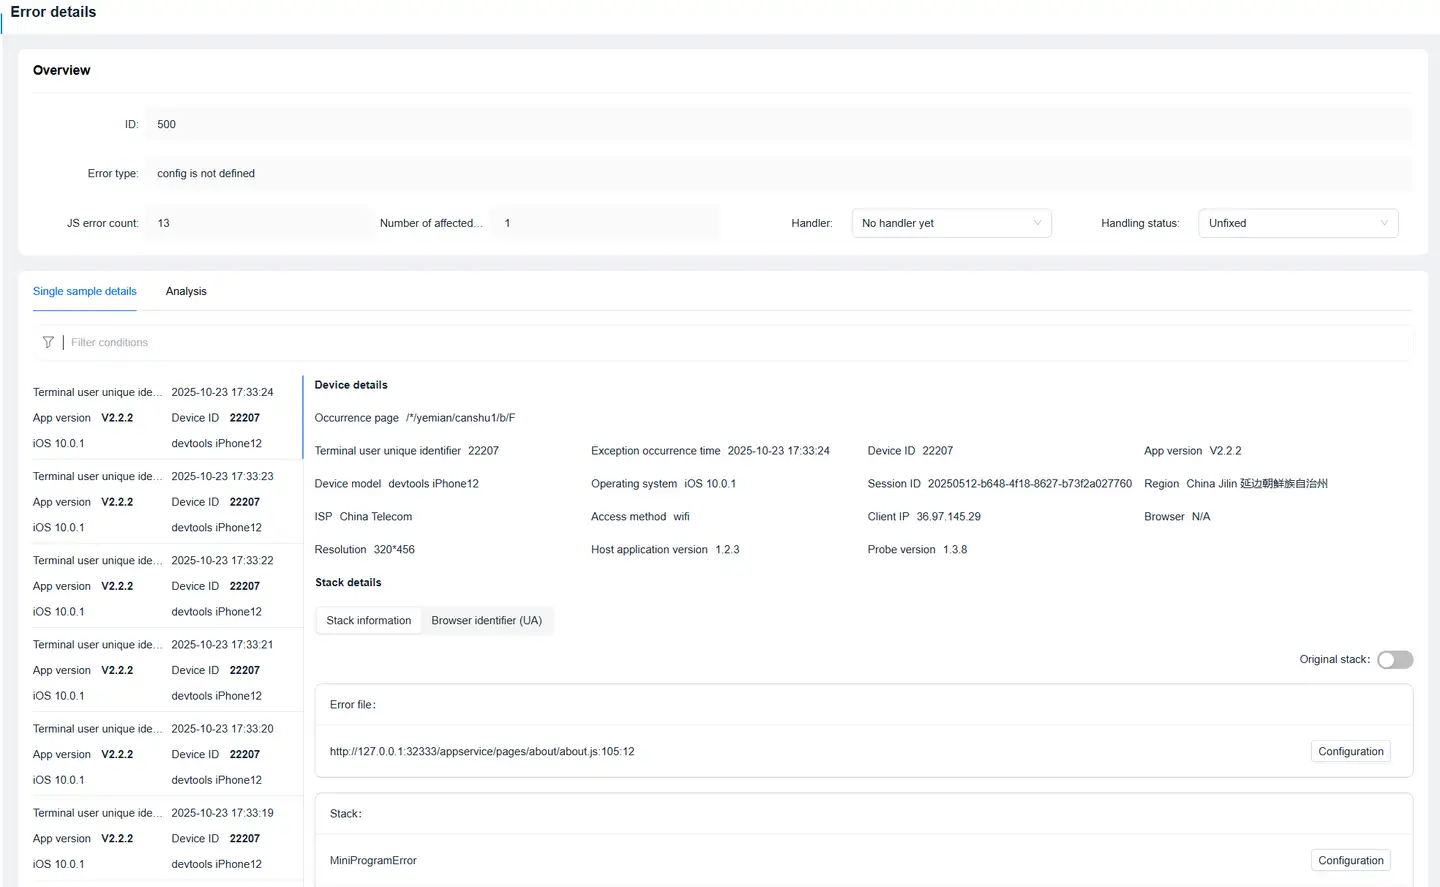
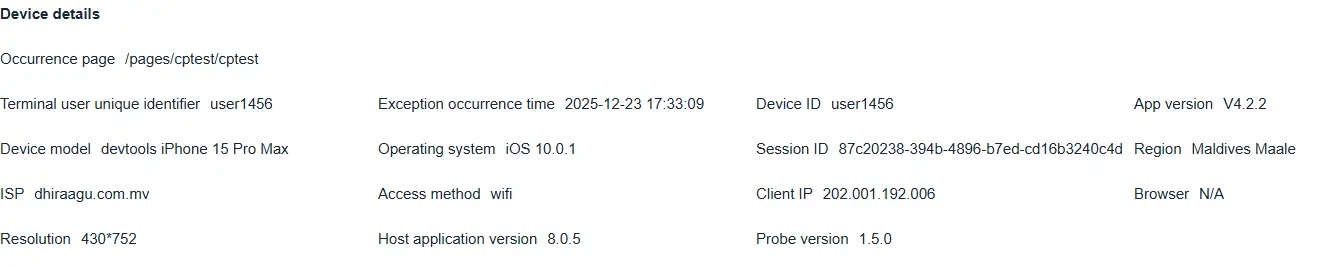
Error Details
Click on the "Time" in the "Details List" to jump to the details page.
- Stack Details
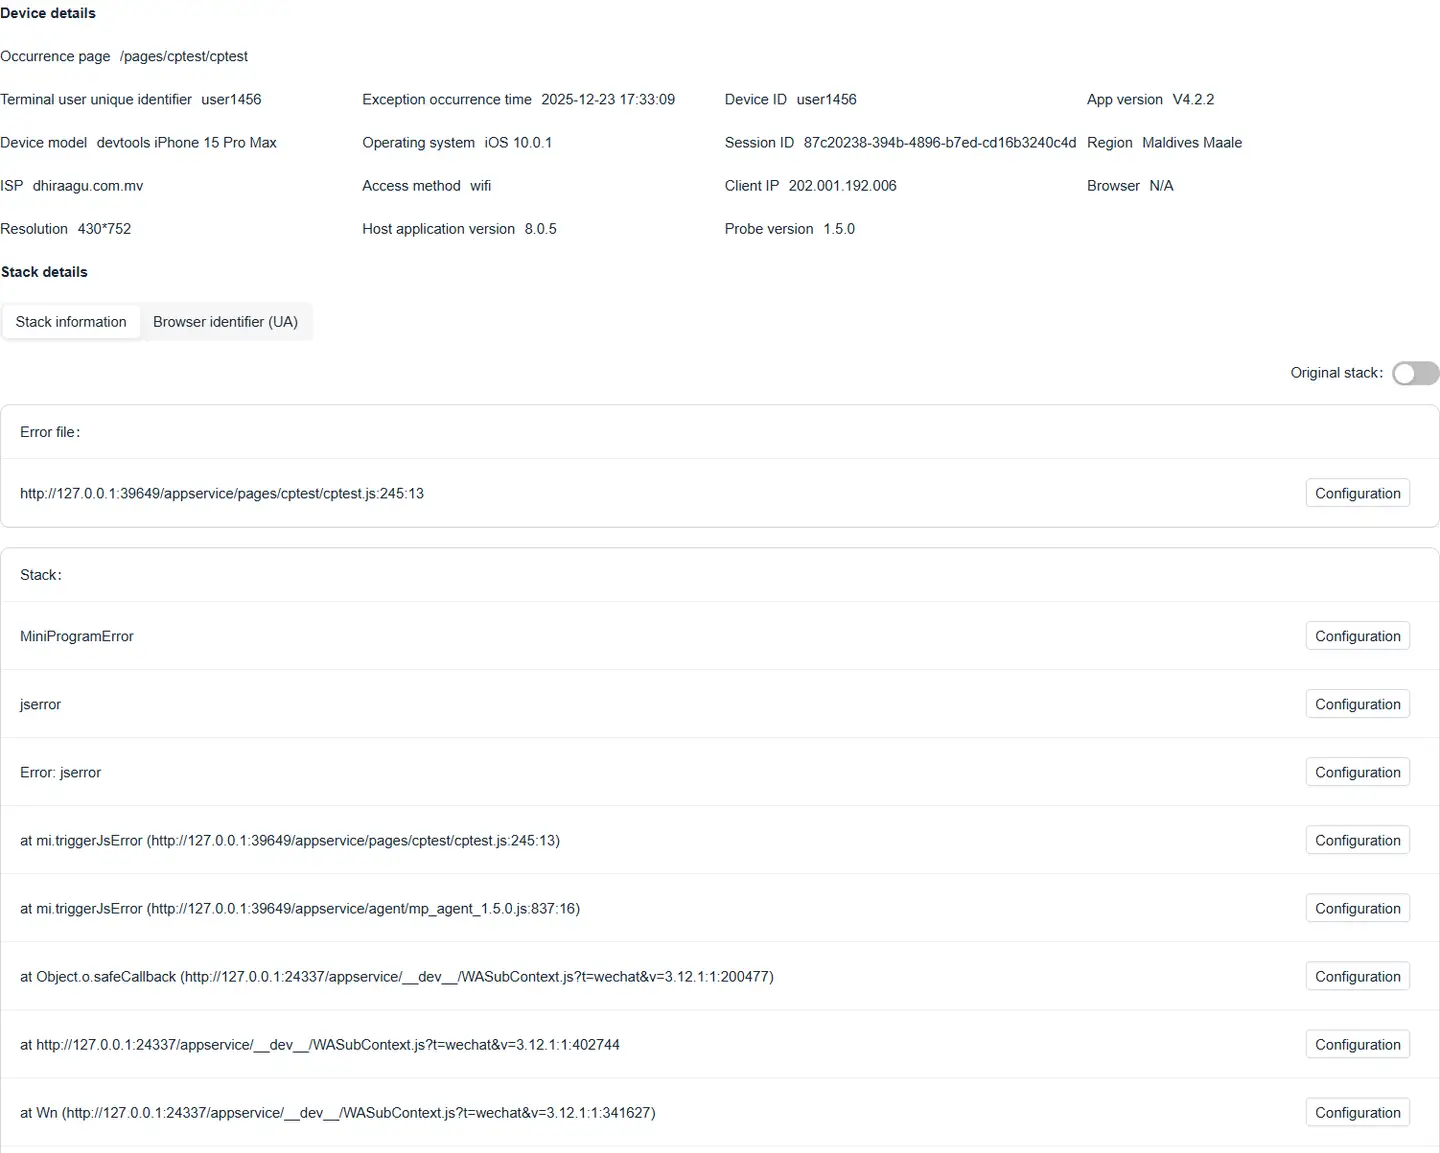
-
Device Details