Version Distribution
Overview
The version distribution feature provides product and R&D teams with performance comparison and trend analysis capabilities for different application versions, helping teams scientifically evaluate version quality, quickly identify performance degradation, and optimize version iteration strategies. Through visual version comparison and comprehensive scoring system, version performance status is clear at a glance, providing data support for version release decisions and issue fixes.
Core Value
- Version Quality Control: Comprehensive scoring system fully evaluates version performance and timely identifies quality issues
- Performance Degradation Warning: Version comparison quickly identifies performance decline to avoid user experience damage
- Iteration Effectiveness Verification: Quantify optimization results and verify whether performance optimization meets expectations
- Data-Driven Decisions: Based on real user data, support version release and rollback decisions
Use Cases
Use Case 1: Pre-Release Evaluation of New Version
Before gray release or full release of a new version, compare performance of old and new versions to assess release risks.
Practice Case:
- Planned to release v3.5.0
- Version comparison found startup time increased 30%, crash rate rose 2%
- Timely discovered performance degradation, delayed release and fixed
- Avoided experience decline for 5 million users
Use Case 2: Version Quality Review
Regularly (weekly/monthly) review performance and user distribution of each version to optimize version strategy.
Practice Case:
- Found old version (v3.2.0) still has 20% users
- This version has crash rate as high as 5%, but no forced upgrade
- Pushed upgrade reminders and made compatibility optimizations on server side
- Overall crash rate decreased 1.2%
Use Case 3: Performance Optimization Verification
Verify actual effectiveness of performance optimization measures and quantify optimization results.
Practice Case:
- v3.6.0 version focused on optimizing startup performance
- Version comparison showed cold start time dropped from 2.8s to 1.9s
- Comprehensive score improved from 75 to 88
- User retention rate increased 8%
Core Features
1. Metrics Analysis

Displays activity changes of the top 5 app versions to quickly understand version distribution status.
Analysis Dimensions
| Dimension | Description | Business Value |
|---|---|---|
| Active Devices | Number of unique devices using this version | Evaluate user coverage of the version |
| Start Count | Total start count of this version | Evaluate usage frequency and activity of the version |
Ranking Rule: Sort by total active devices or total start count within statistical time period from high to low
Application Scenarios
- Version Coverage Analysis: Understand user version distribution, evaluate forced upgrade strategy effectiveness
- Upgrade Trend Monitoring: Observe new version user growth rate, evaluate promotion effectiveness
- Long-Tail Version Identification: Discover old versions still used by many users, decide whether maintenance is needed
Operation Recommendations
-
After New Version Release:
- Observe new version active device growth curve
- Expected to reach 50% coverage in 7-14 days
- If growth is slow, check upgrade prompt strategy
-
Old Version Management:
- Pay attention to old versions older than 3 versions
- If proportion > 20%, consider forced upgrade or compatibility handling
- More old versions mean higher maintenance costs
-
Abnormal Fluctuation Analysis:
- Active devices suddenly drop: May be serious issues causing user uninstall
- Start count abnormally drops: May be performance issues affecting usage frequency
2. Version List
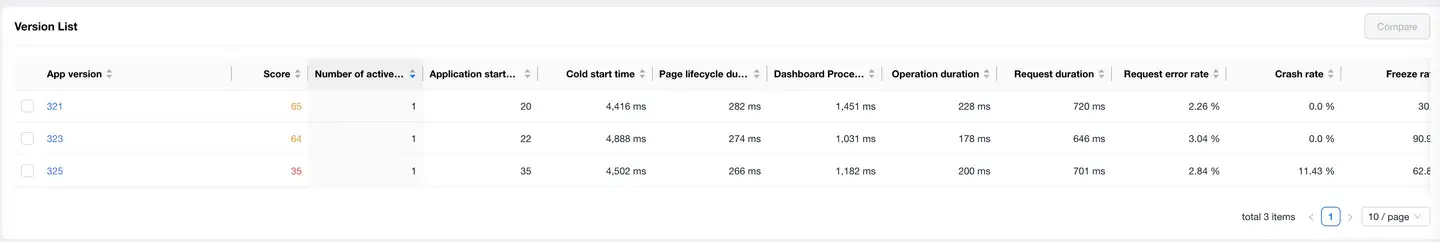
The version list displays comprehensive performance data of each version, supporting one-click comparison analysis.
Core Metrics
| Metric Category | Metric Name | Description | Excellent Standard |
|---|---|---|---|
| Basic Data | App Version | Version number | - |
| Score | Comprehensive performance score (0-100) | ≥ 85 | |
| Active Devices | Number of devices using this version | - | |
| App Start Count | Total start count of this version | - | |
| Performance Metrics | Cold Start Time | Application cold start latency | < 2s |
| Page Lifecycle Time | Page load completion time | < 1s | |
| First Screen Time | First screen content rendering time | < 1.5s | |
| Operation Time | User interaction response time | < 300ms | |
| Request Time | Network request average response time | < 500ms | |
| Abnormal Metrics | Request Error Rate | Network request failure proportion | < 1% |
| Crash Rate | Application crashes / starts proportion | < 0.5% | |
| Stutter Rate | Stutters / starts proportion | < 3% |
Version Comparison Feature
Usage
- Check the versions to compare in the version list (up to 3)
- Click the [Compare] button in the upper right corner of the list
- View version performance comparison details
Time Selection
Select the time range for data comparison through the time dropdown menu above.
Usage Tips
Quickly Identify Problem Versions
- Sort by Score: Versions with score < 70 need special attention
- Sort by Crash Rate: Versions with crash rate > 1% need urgent handling
- Sort by Active Devices: Prioritize optimizing versions with more user coverage
Version Comparison Strategy
- Old vs New Version Comparison: v3.5.0 vs v3.4.0 (evaluate new version quality)
- Consecutive Version Comparison: v3.5.0 vs v3.4.0 vs v3.3.0 (track performance trends)
- Problem Version Comparison: Problem version vs normal version (locate problem introduction point)
3. Version Comparison Details
Version Statistics
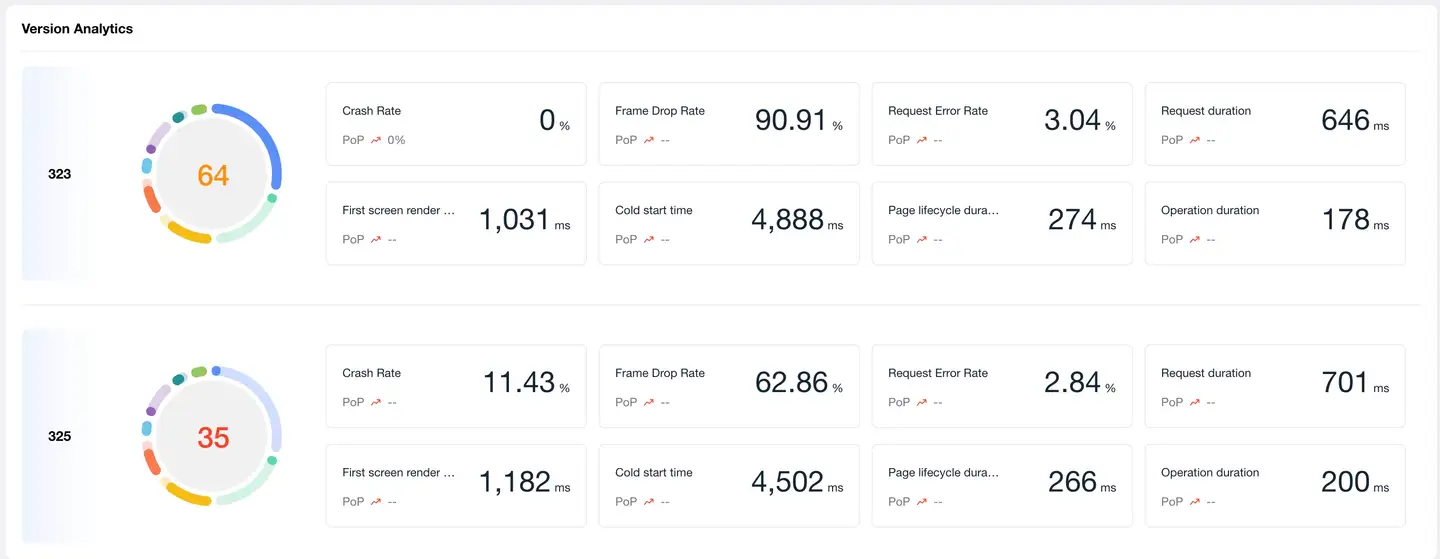
Comprehensive Scoring System
Comprehensive score is calculated through 8 core performance dimensions to fully evaluate version quality.
Scoring Dimensions
| Dimension | Weight | Description |
|---|---|---|
| Request Response Time | 15% | Network request performance |
| Crash Rate | 20% | Application stability |
| Stutter Rate | 15% | Application smoothness |
| Request Error Rate | 10% | Network availability |
| Operation Time | 10% | Interaction response speed |
| First Screen Time | 10% | Page load performance |
| Startup Time | 15% | Application startup performance |
| Time to Interactive | 5% | Page interactivity performance |
Score Configuration
Click Global Settings → Score Settings to customize:
- Threshold: Boundary values for excellent/good/average/poor for each metric
- Baseline: Target baseline values for each metric
- Weight: Proportion of each metric in comprehensive score
Best Practice: Adjust weights according to application type, e.g., tool apps can increase startup time weight, social apps can increase operation time weight.
Metrics Analysis
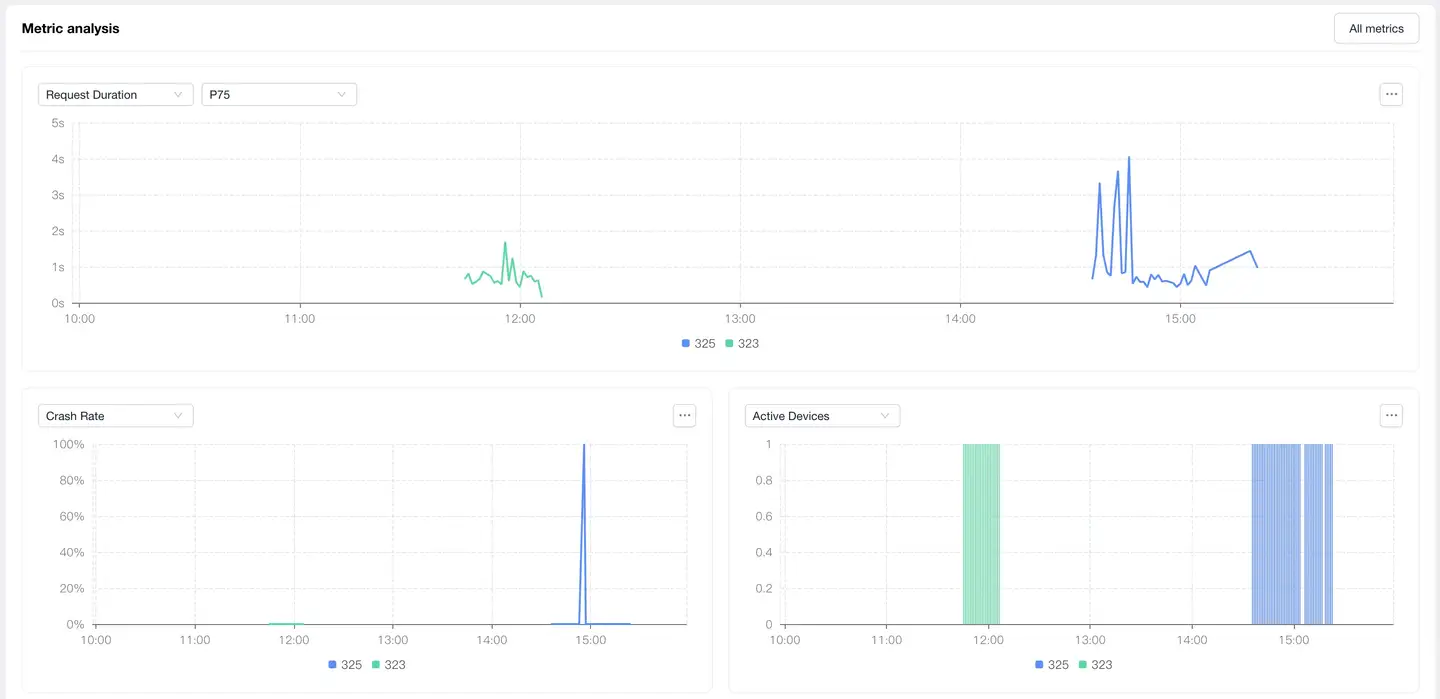
Feature Description
Through multi-version metric trend comparison, intuitively discover performance differences and change trends.
Metric Categories
1. Latency Metrics
Displays performance latency comparison of each version:
| Metric | Description | Optimization Target (Reference) |
|---|---|---|
| Request Latency | Average response time of network requests | < 500ms |
| Cold Start Latency | Application first startup completion time | < 2s |
| Hot Start Latency | Application recovery time from background | < 1s |
| Page Load Latency | Complete page load time | < 1.5s |
Analysis Points:
- Latency rising trend: Need to locate performance degradation cause
- New version latency higher: May have introduced performance issues
- Sudden latency peaks: May be specific scenario issues
2. Abnormal Metrics
Displays stability and availability comparison of each version:
| Metric | Description | Excellent Standard (Reference) |
|---|---|---|
| Crash Rate | Application crashes / starts | < 0.5% |
| Stutter Rate | Stutters / starts | < 3% |
| Request Error Rate | Failed requests / total requests | < 1% |
| HTTP Error Rate | HTTP 4xx/5xx error proportion | < 0.5% |
| Network Error Rate | Network layer errors (timeout, connection failure, etc.) proportion | < 0.5% |
Analysis Points:
- Abnormal rate rising: Highest priority, need immediate handling
- Abnormal rate fluctuation: May be related to specific time or scenario
- Large differences between versions: Need to compare code changes to locate issues
3. Statistical Metrics
Displays user distribution and activity of each version:
| Metric | Description | Business Value |
|---|---|---|
| Active Devices | Device count changes using this version | Evaluate version upgrade rate and user distribution |
| App Start Count | Start count changes of this version | Evaluate version activity and usage frequency |
Analysis Points:
- New version device count grows fast: Indicates upgrade promotion is effective
- Old version device count still high: Need to evaluate forced upgrade strategy
- Start count drops: May be performance issues affecting user usage
Interactive Features
- Mouse Hover: View detailed data at specific time points on the curve
- Legend Toggle: Click legend to show/hide specific version curves
- Time Range: Adjust time range to view comparisons of different periods
Version Management Best Practices
1. Version Release Process
Pre-Release
- Performance Baseline Comparison: Compare core metrics with previous stable version
- Score Threshold: Comprehensive score < 80 not recommended for release
- Regression Check: Ensure core metrics have no obvious degradation (degradation < 10%)
During Release (Gray Release Phase)
- Small-Scale Validation: Gray release to 5%-10% users, observe for 24-48 hours
- Real-Time Monitoring: Pay attention to crash rate, stutter rate, request error rate
- Comparison Analysis: Real-time comparison of gray version vs production version
- Abnormal Thresholds:
- Crash rate increase > 50%: Immediate rollback
- Stutter rate increase > 30%: Pause gray release, investigate issues
- Other metrics degradation > 20%: Assess impact, decide whether to continue
Post-Release (Full Release Phase)
- Continuous Monitoring: Check version metrics daily for 7 days after release
- User Feedback: Combine version data analysis with user feedback
- Issue Response: Establish rapid fix and hotfix mechanisms
2. Version Degradation Troubleshooting
Troubleshooting Process
1. Discover Degradation
   ↓ Version comparison found metrics worsened

2. Confirm Impact Scope
   ↓ View affected device count and user proportion

3. Locate Introduction Version
   ↓ Consecutive version comparison, find problem introduction point

4. Analyze Root Cause
   ↓ Combine code changes and performance analysis tools

5. Formulate Solution
   ↓ Fix / Rollback / Hotfix

6. Verify Effectiveness
   ↓ Compare and verify after new version release
Common Degradation Types and Handling
| Degradation Type | Possible Causes | Investigation Direction | Handling Recommendations |
|---|---|---|---|
| Startup Time Increase | Initialization logic increase, too many resources loaded | Startup chain analysis | Lazy initialization, resource lazy loading |
| Crash Rate Rise | New code defects, compatibility issues | Crash stack analysis | Urgent fix or rollback |
| Stutter Rate Rise | Main thread time increase, memory leaks | Stutter analysis, memory analysis | Optimize time-consuming operations |
| Request Latency Increase | API changes, network strategy adjustments | Network request analysis | Optimize interface or degrade |
| Error Rate Rise | Interface changes, dependent service issues | Error log analysis | Compatibility handling or server-side fix |
3. Multi-Version Parallel Management
Version Strategy
- Main Version Maintenance: Latest 2 major versions
- Long-Tail Version Handling:
- Users of versions older than 3 versions < 5%: No longer maintained
- 5%-10%: Only fix critical issues
-
10%: Push forced upgrade
Forced Upgrade Strategy
| Scenario | Upgrade Strategy | Implementation Timing |
|---|---|---|
| Critical Security Vulnerability | Immediate forced upgrade | Within 24 hours of discovery |
| Major Performance Issues | Forced upgrade | 3-7 days after fix version release |
| Important Feature Launch | Guided upgrade | After new version coverage > 30% |
| Daily Iteration | Optional upgrade | - |
Compatibility Management
- API Compatibility: Server maintains compatibility for 3 versions
- Feature Degradation: Provide degradation solutions for features unusable in old versions
- Data Compatibility: New version data format backward compatible
4. Scoring System Optimization
Weight Adjustment Principles
Adjust weights according to application type and business goals:
| Application Type | Key Metrics | Weight Recommendations |
|---|---|---|
| Tool Apps | Startup Time, Operation Time | Startup 20%, Operation 15% |
| Content Apps | First Screen Time, Stutter Rate | First Screen 15%, Stutter 20% |
| E-commerce Apps | Request Time, Availability | Request 20%, Error Rate 15% |
| Game Apps | Stutter Rate, Crash Rate | Stutter 25%, Crash 25% |
Threshold Setting Method
- Collect Baseline Data: Statistics of metrics from the latest 3 stable versions
- Calculate Percentiles:
- Excellent: P25 (top 25% excellent)
- Good: P50 (median)
- Average: P75
- Poor: P90
- Continuous Optimization: Adjust thresholds quarterly based on actual data
5. Data-Driven Version Decisions
Version Release Decision Matrix
| Comprehensive Score | Core Metrics | Decision Recommendation |
|---|---|---|
| ≥ 85 | No obvious degradation | Can fully release |
| 80-84 | Individual metrics slightly degraded (< 10%) | Release after assessment, pay attention to degraded items |
| 70-79 | Multiple metrics degraded (10%-20%) | Release after optimization or gray observation |
| < 70 | Severe degradation (> 20%) | Not recommended for release, prioritize fixes |
| Any Score | Crash Rate > 1% | Prohibit release |
Rollback Decision Criteria
Immediately rollback if any of the following conditions are met:
- Crash rate > 2% or increased > 100% compared to previous version
- Core business functions cannot be used
- User complaints surge (> 3x)
- Comprehensive score < 60
FAQ
Q1: How to determine if a version needs optimization?
A: Comprehensive judgment based on the following standards:
Must Optimize (any condition met)
- Comprehensive score < 70
- Crash rate > 1%
- Stutter rate > 5%
- Core metrics degraded > 20% compared to previous version
Recommended to Optimize (any condition met)
- Comprehensive score 70-80
- Crash rate 0.5%-1%
- Stutter rate 3%-5%
- Core metrics degraded 10%-20% compared to previous version
Optional Optimization
- Comprehensive score 80-85
- Individual metrics have optimization space
Q2: How to choose version comparison time?
A: Choose appropriate time range according to comparison purpose:
Time Period Comparison
- Purpose: Exclude time factors, compare real differences between versions
- Scenario: Old vs new version performance comparison, gray version evaluation
- Recommendation: Choose recent 7 days or 30 days
Example
Scenario: Evaluate v3.5.0 new version quality
- v3.5.0 (recent 7 days) vs v3.4.0 (recent 7 days)
- Exclude time differences, purely compare version performance
Q3: Why did a version's score suddenly drop?
A: Possible causes and troubleshooting methods:
1. External Dependency Issues
- Symptom: API service performance decline, CDN failure
- Investigation: Check if request latency and error rate rise simultaneously
- Handling: Contact server team, optimize interface or degrade
2. Specific Scenario Issues
- Symptom: A new feature or scenario has poor performance
- Investigation: Filter and analyze by business scenario dimension
- Handling: Targeted optimization of that scenario
3. Real Performance Degradation
- Symptom: Code changes introduced performance issues
- Investigation: Compare code changes, use performance analysis tools to locate
- Handling: Code optimization or rollback
Q4: Large data differences between gray version and full version?
A: This is a common phenomenon, causes and handling methods:
Common Causes
-
User Group Differences
- Gray users may be more active or users with newer devices
- Full version includes broader devices and network environments
-
Sample Size Differences
- Few gray users, large data fluctuations
- Many full version users, more stable data
-
Time Differences
- Gray and full release times are different
- External environment may have changed
Handling Recommendations
- Gray Phase: Focus on trends rather than absolute values
- Pre-Full Assessment: Data more credible after gray user coverage reaches 20%-30%
- Layered Gray Release: Layer gray release by device tier and region for more comprehensive data
- Continuous Monitoring: Continuously compare gray period and full period data after full release