Tracing
Overview
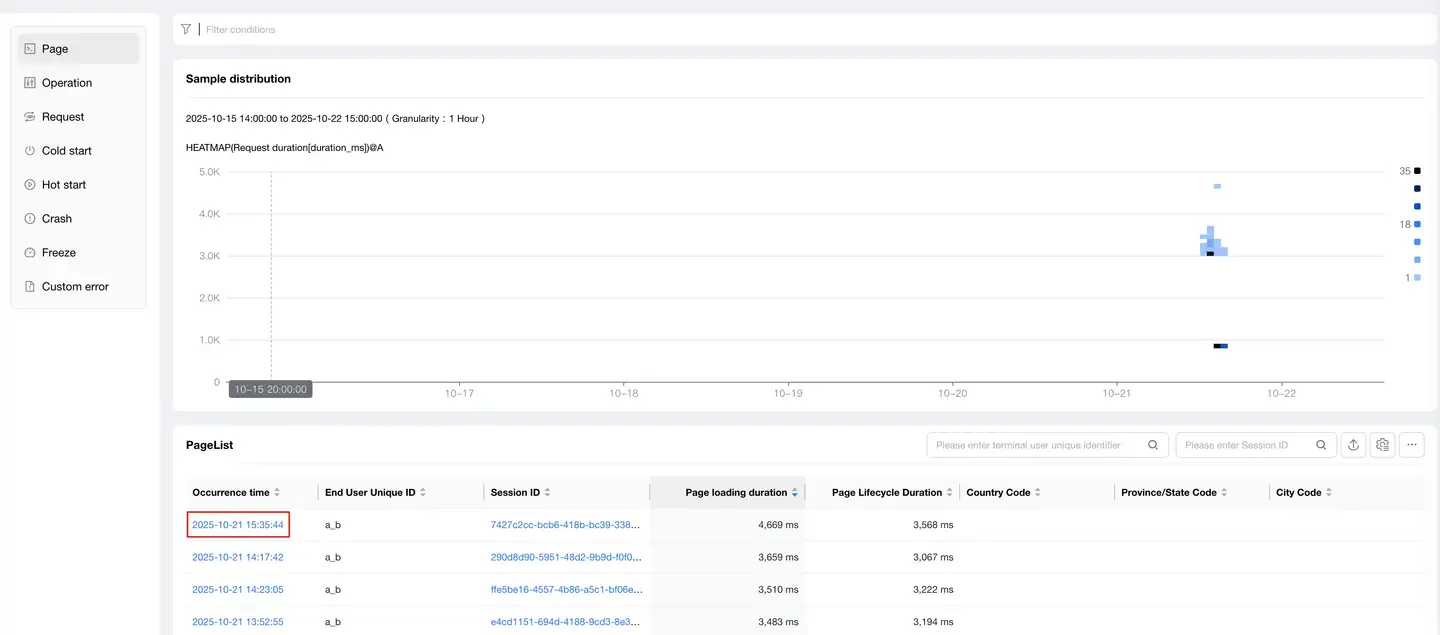
The tracing list displays all of the following within the current statistical cycle:
- Pages
- Operations
- Requests
- Cold Starts
- Hot Starts
- Crashes
- Freezes
- Custom Errors
Users can filter by the following dimensions:
- UserID
- Session ID
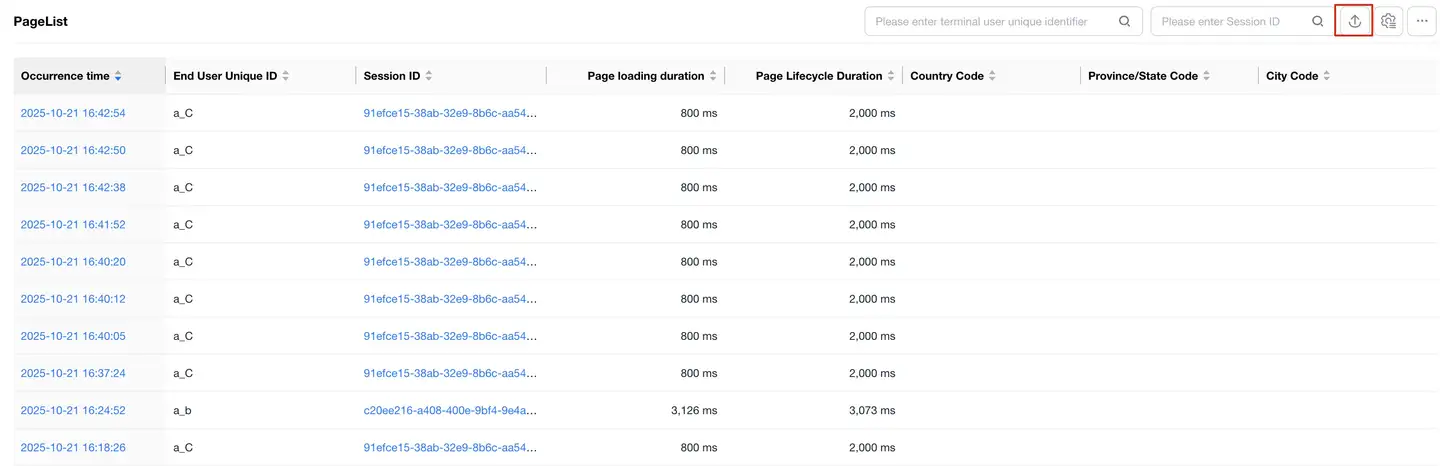
Data Export
Supports exporting the query list in CSV format:
- Click the Export button in the upper right corner of the tracing list
- Check the categories to be exported
- The system creates an export task, displayed in the export list
- When the status column shows "Completed", you can click the download link in the operation column to download the zip package
Note: You can click the Export List button in the upper right corner of the tracing list at any time to view export progress, download lists, or delete export tasks.
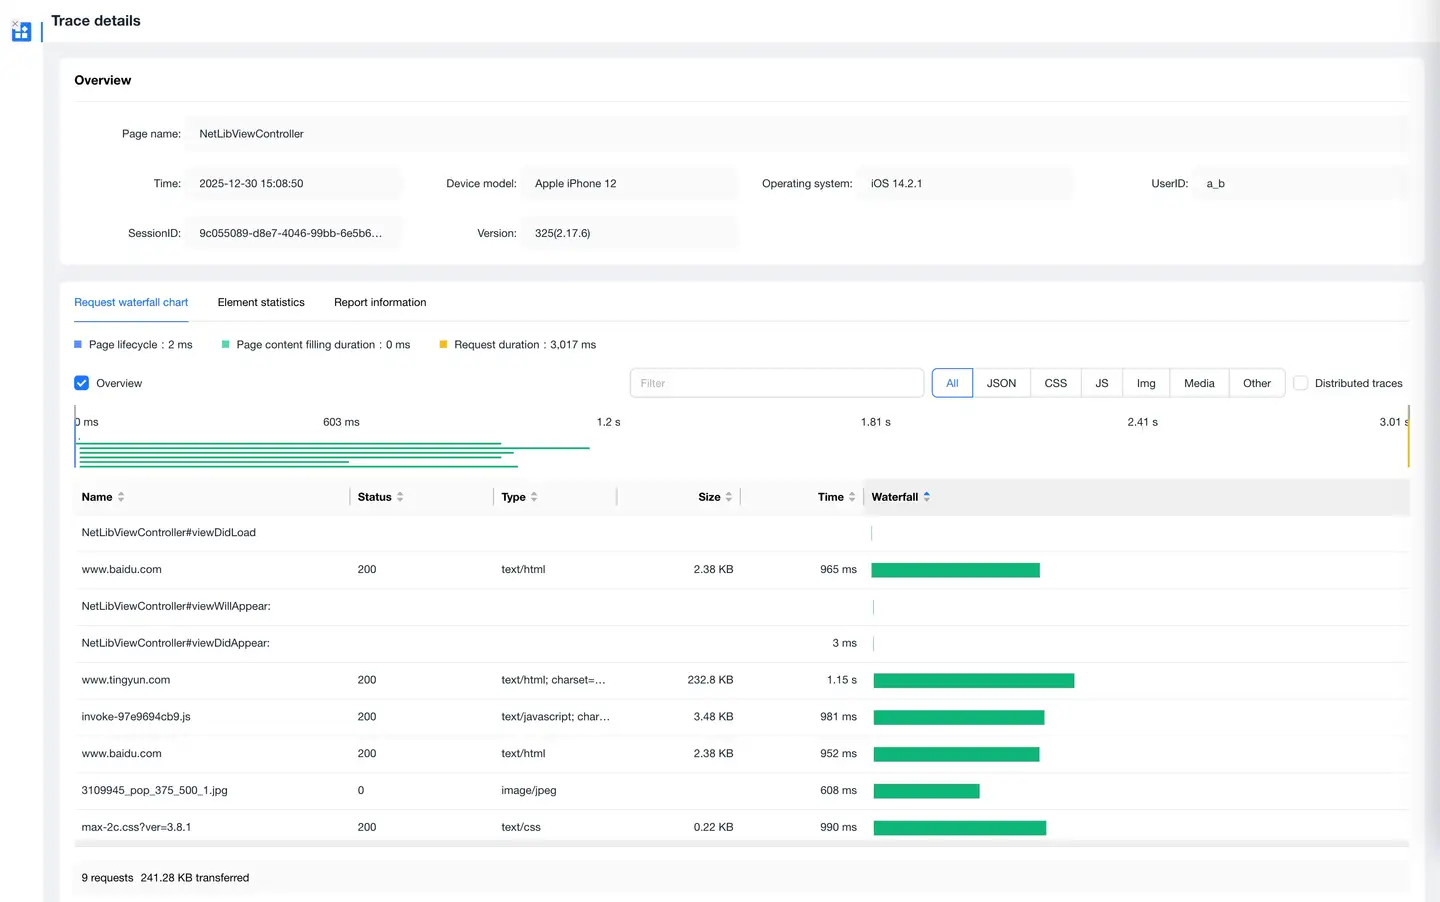
Tracing Details
Slow Start/Slow Operation/Slow Page
Click on any entry in the list to jump to the tracing details page, which includes:
- Occurrence time
- Key times for slow start
- End user information
- Waterfall diagram breakdown
Slow Start Metrics Definition
Android
- Application Preparation Time: From the beginning to the end of Application.attachbaseContext()
- Main Page Initialization Time: From the end of Application.attachbaseContext() to the end of Application.onCreate()
- View Filling Time: From the end of Application.onCreate() to the end of MainActivity.onCreate()
- Interaction Preparation Time: From the end of MainActivity.onCreate() to the end of MainActivity.onResume()
iOS
- Initialization Time: From main function startup time (SDK startup time) to the beginning of applicationDelegate.didFinishLaunchingWithOptions()
- Construction Time: From the beginning of applicationDelegate.didFinishLaunchingWithOptions() to the beginning of FirstVC.loadView()
- Page Loading Time: From the beginning of FirstVC.loadView() to the end of FirstVC.viewDidAppear()
End User Information
Includes the following data:
- UserID
- Device ID
- Device Model
- Operating System
- App Version
- Region
- Carrier
- Connection Type
- Available Storage
- Available Memory
- Battery Level
- CPU Model
- CPU Instruction Set
- CPU Usage
- UI Orientation
- GPS Information
Waterfall Diagram Breakdown
Includes the following content:
- Network request breakdown
- Main and child thread method calls
- Call relationships
Features:
- Mouse hover over network requests displays:
- Request URL
- Initiation time
- Start time
- Duration
- Response code
- Data transfer volume
- Time to first byte
- DNS
- TCP
- SSL
- Click on method call relationships to trace methods that called this method
- Click Expand Child Threads below the waterfall diagram to view downstream application transaction performance details when cross-application requests occur
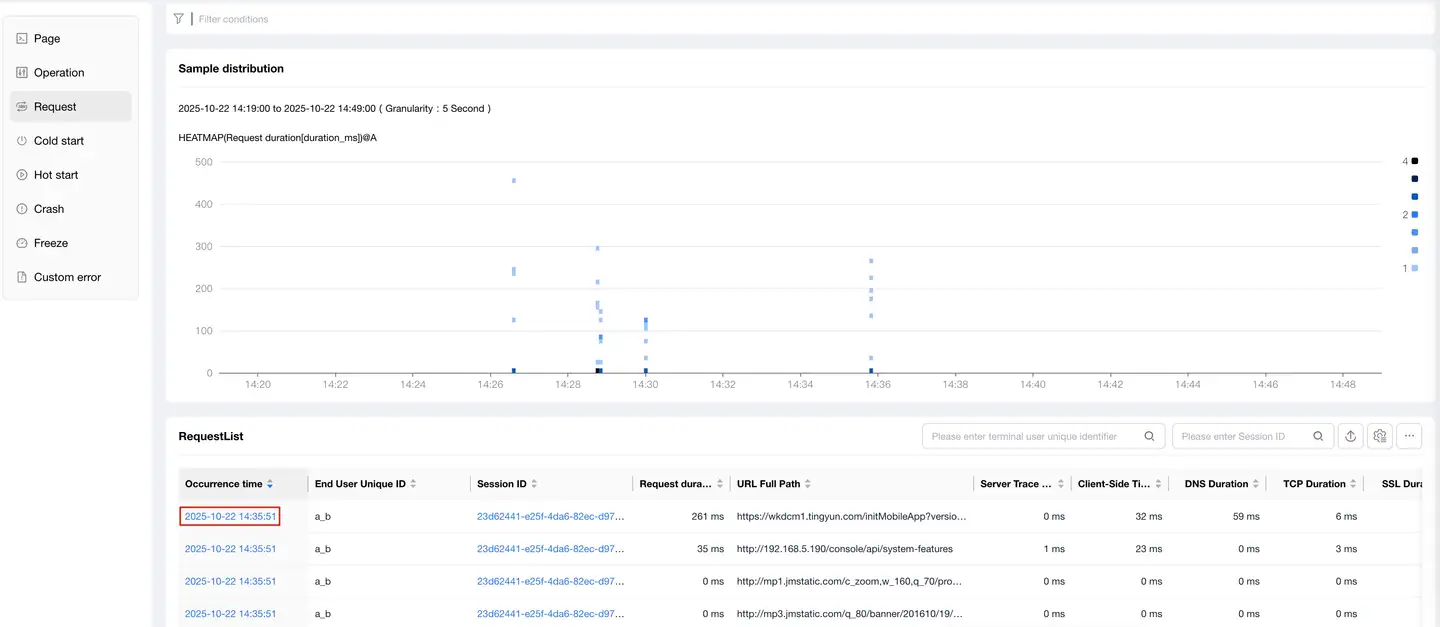
Slow Requests
The list page displays all request records that exceed the request threshold:
- When the Call Chain Tracing switch is turned on, the list only shows cross-application calls
- Supports sorting by occurrence time and total response time
- Can drill down to the APM product to view backend transaction trace details
Request Errors
The list displays HTTP errors or network errors that occurred during user operations:
- Shows error sample information
- Click on the URL link in the list to drill down to the error sample details page
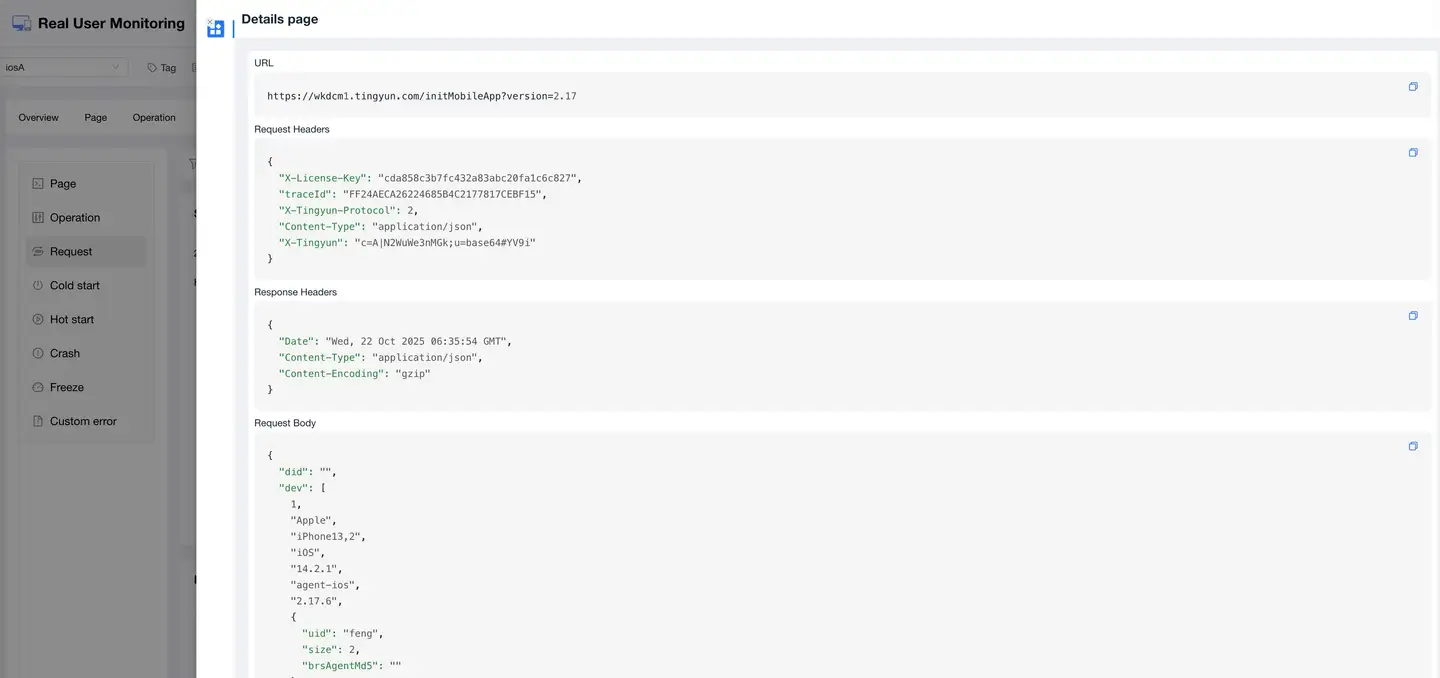
Error sample details include:
- End user information
- URL
- Request parameters
- Call stack
- Response headers
- Response content
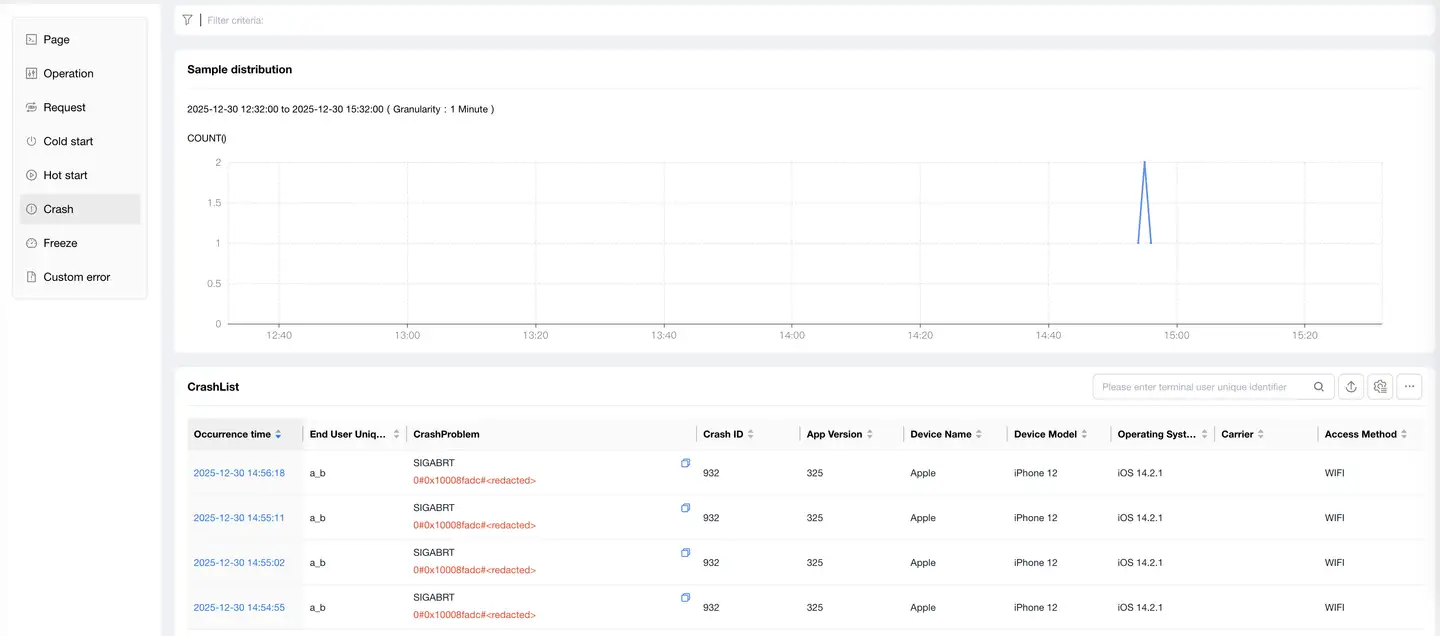
Crashes
The crash list displays records of each crash in the current application. Click on the blue link of a crash issue in the list to view crash details.
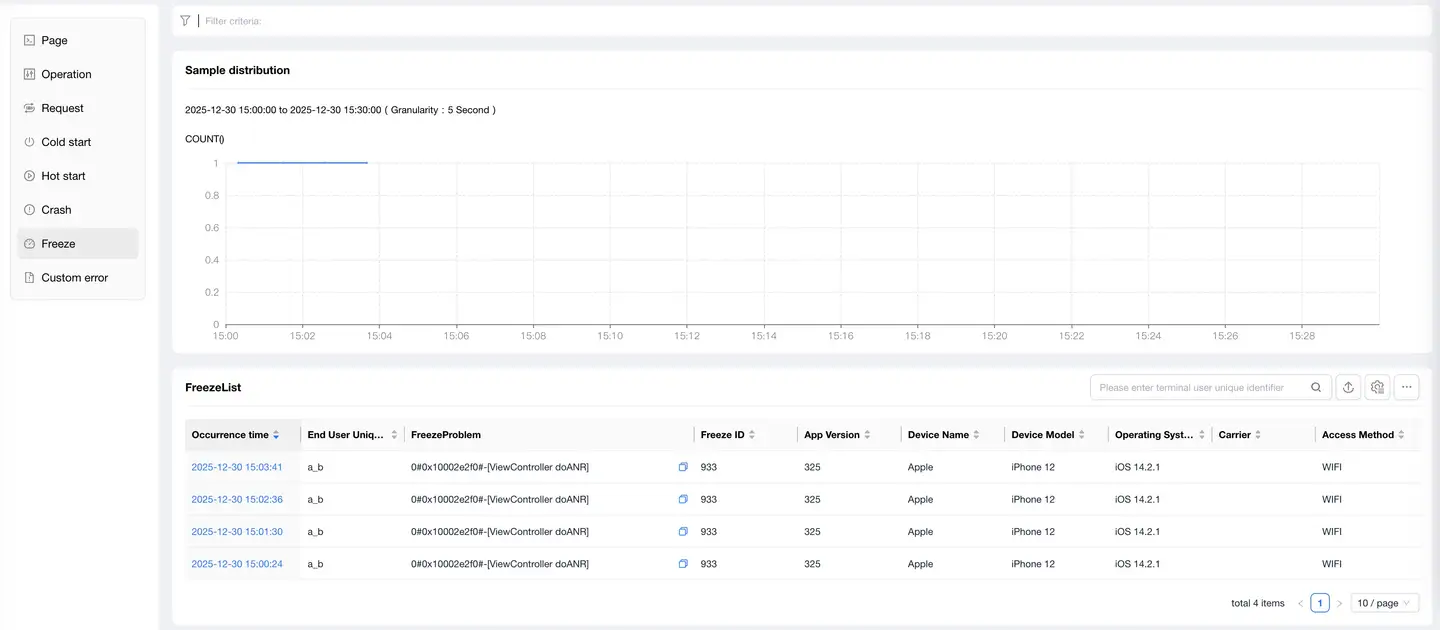
Freezes
The freeze list displays records of each freeze in the current application. Click on the blue link of a freeze issue in the list to view freeze details.
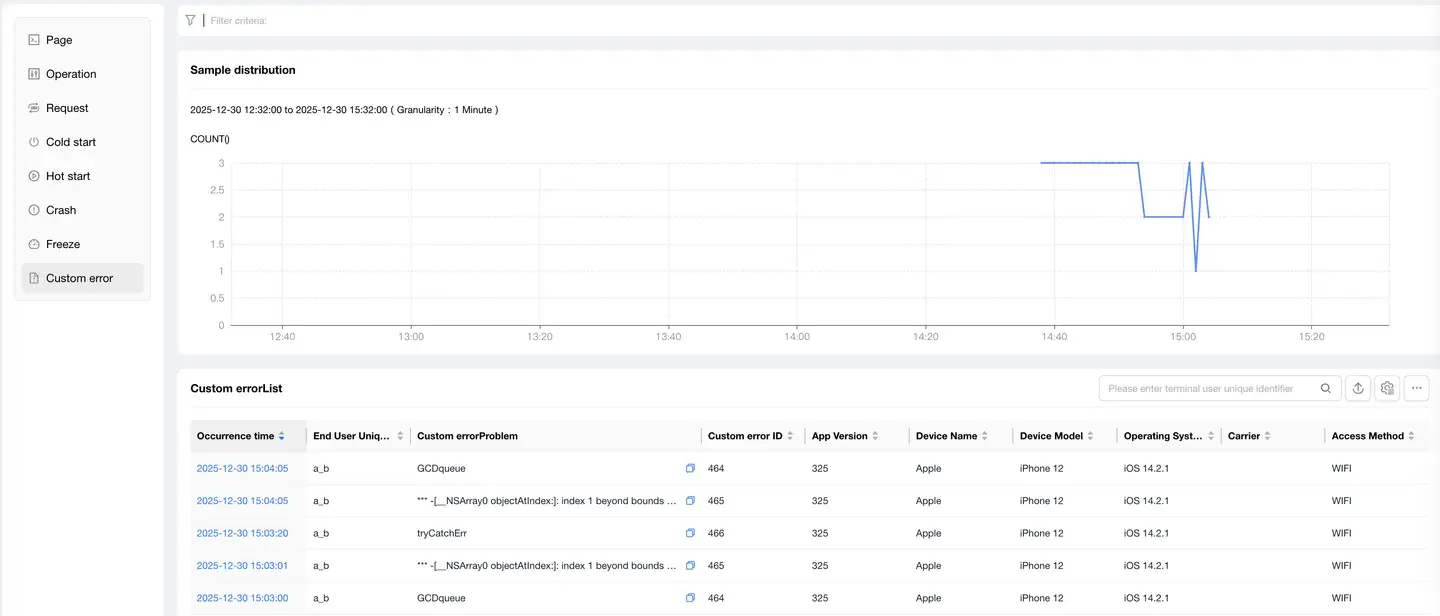
Application Errors
The error list displays records of each application error, including:
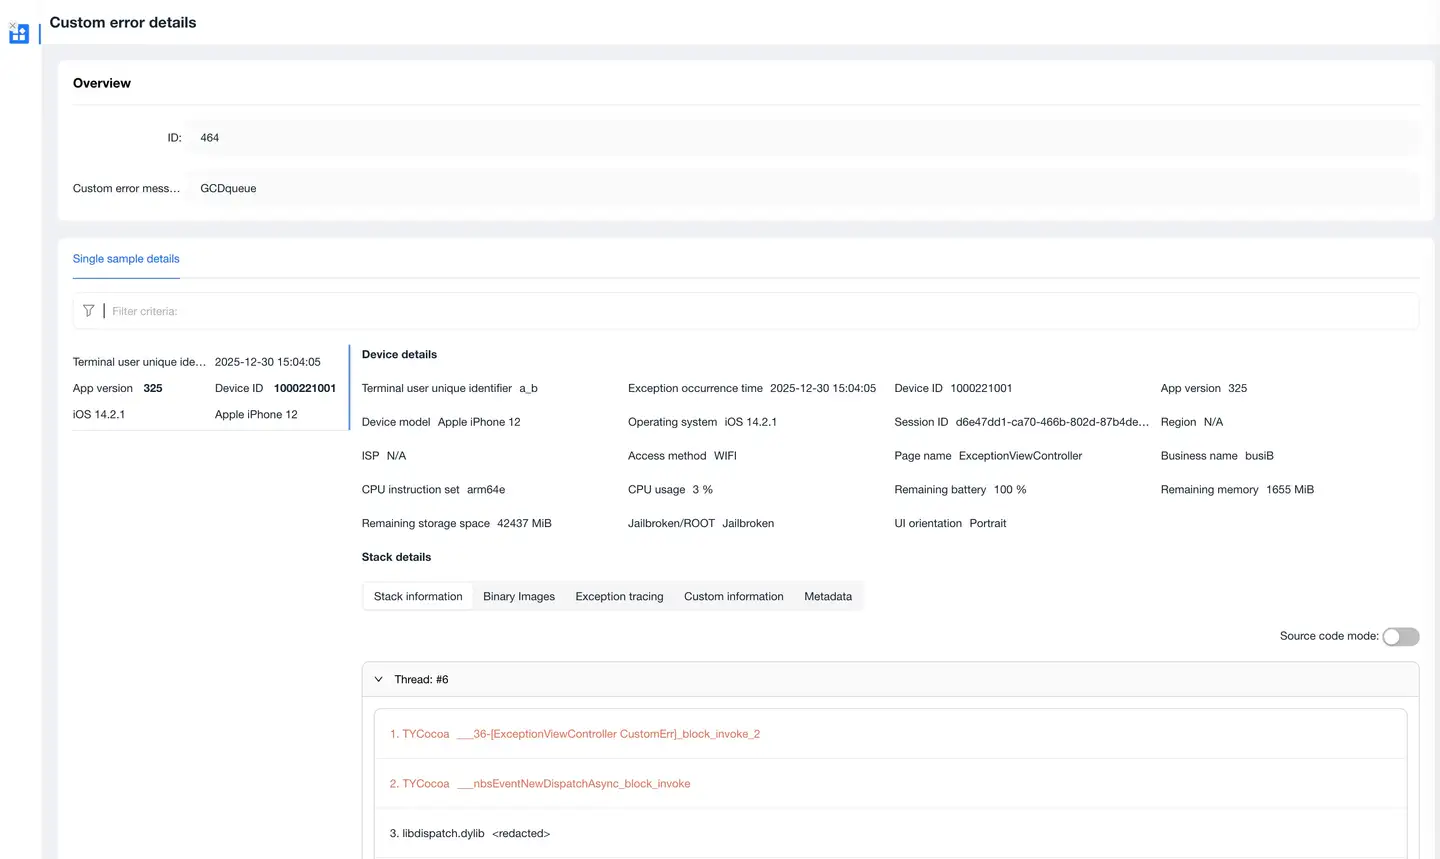
Context Information
Displays the following when the error occurred:
- Environment information
- Device information
- Operating system information
Stack Information
Displays:
- The source of the error
- The direct cause of the final error
Exception Tracing
Provides backtracking functionality:
- Records user actions through error tracking
- Accurately reflects user behavior before the current exception occurred
- Reconstructs the scenario when the error occurred
Custom Information
You can add custom information at any position after the SDK starts:
- Supports up to 10 entries
- Maximum 100 bytes per entry
- Can add information such as real user accounts and contact information
Addition method:
setUserCrashMessage(String key, String value);