User Statistics
Overview
The user statistics feature provides product, operations, and marketing teams with core data on application user scale, activity, growth trends, and more, helping teams fully understand user profiles and formulate precise operations and marketing strategies. Through multi-dimensional user data analysis, it supports product decisions, user operations, and business growth.
Core Value
- User Growth Monitoring: Real-time tracking of new user and active user trends to evaluate product appeal
- User Profile Analysis: Understand user device, system, and geographic distribution to optimize product adaptation
- Operations Effectiveness Evaluation: Quantify the impact of operations activities on user growth and activity
Use Cases
Use Case 1: Product Growth Evaluation
Regularly (daily/weekly/monthly) evaluate product user growth and health.
Practice Case:
- Discovered weekend activity dropped 30% through daily active user trends
- Analysis found the product is tool-oriented with high weekday usage frequency
- Adjusted product strategy to add lifestyle scenario features
- Weekend activity increased 25%, overall activity increased 15%
Use Case 2: Device Adaptation Optimization
Optimize product adaptation strategy based on user device and system distribution.
Practice Case:
- Found iOS 14+ users account for 65%
- Adjusted minimum supported version, dropped support for iOS 12 and below
- Saved 20% of R&D resources, focused on optimizing new system experience
- User satisfaction increased 12%
Use Case 3: Product Health Monitoring
Evaluate product usage health through collection device ratio.
Practice Case:
- Collection device count/active device count ratio dropped from 95% to 60%
- Discovered many users uninstalled the app due to performance issues
- Urgently optimized performance and pushed new version
- Collection ratio recovered to 85%, recovered many users
Core Features
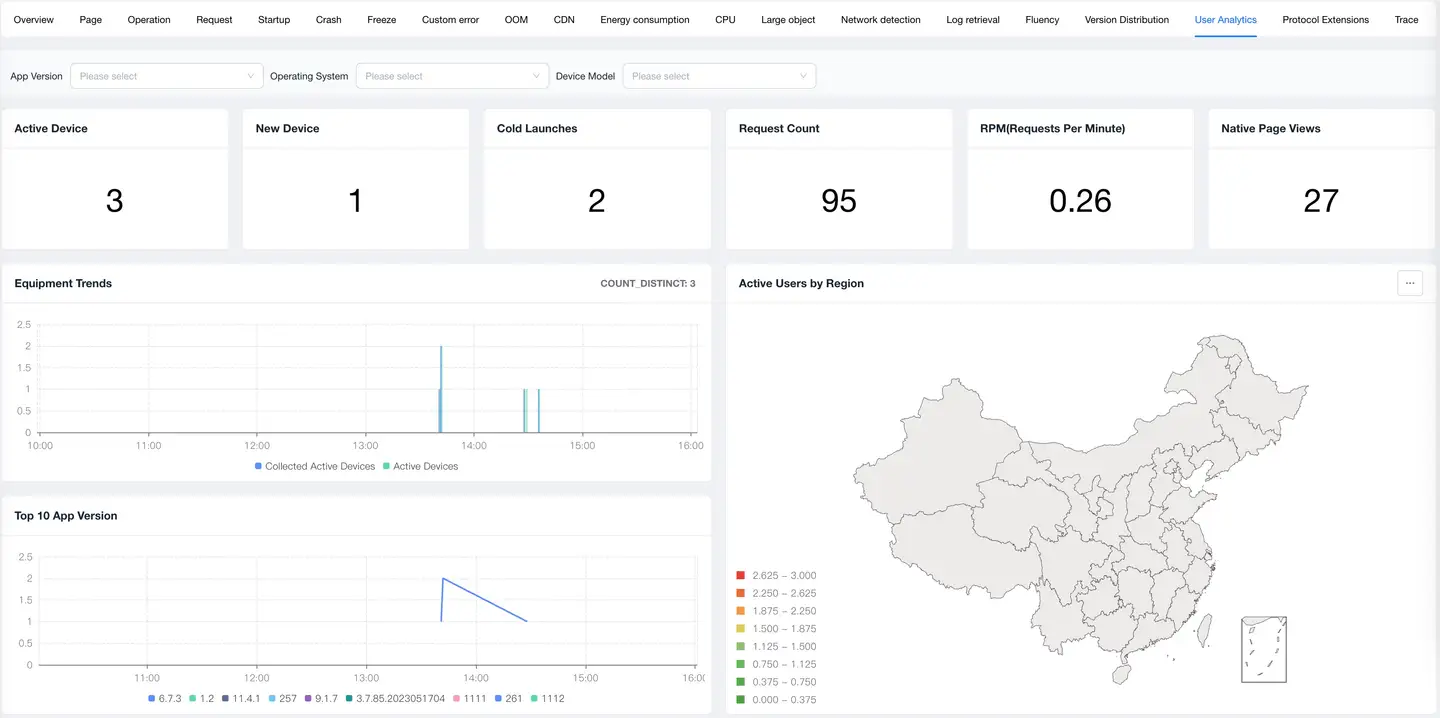
1. Data Cards

Data cards display core user metrics of the application within the statistical period, providing a quick overview of product health.
Core Metrics
| Metric | Description | Business Significance |
|---|---|---|
| Active Users | Number of unique devices using the application in the statistical period | Reflects product user scale and activity |
| New Users | Number of devices using the application for the first time in the statistical period | Reflects product growth capability and appeal |
| Cold Start Count | Total number of application cold starts | Reflects user usage frequency and stickiness |
| Request Count | Total number of network requests initiated by the application | Reflects user interaction depth and activity |
| RPM | Requests Per Minute | Reflects system load and business activity |
| Native Page Views | Total number of native page visits | Reflects user browsing depth |
Metric Interpretation
User Scale Evaluation
- Active Users:
- DAU (Daily Active Users): Core metric for daily operations
- WAU (Weekly Active Users): Evaluate periodic activity
- MAU (Monthly Active Users): Evaluate overall user scale
- Healthy Ratio: DAU/MAU > 20% (high activity)
User Growth Evaluation
- New Users:
- Organic Growth: Growth from product reputation
- Campaign Growth: Growth from marketing activities
- New User Ratio: New Users / Active Users
- Healthy Ratio: 5%-15% (stable growth)
User Stickiness Evaluation
- Cold Start Count:
- Average Starts Per User = Cold Start Count / Active Users
- High Stickiness Apps: > 5 times/day
- Medium Stickiness Apps: 2-5 times/day
- Low Stickiness Apps: < 2 times/day
User Activity Evaluation
- Request Count & RPM:
- Average Requests Per User = Request Count / Active Users
- Reflects user usage depth
- Higher values indicate more active users
Best Practice: Set data card metrics as the homepage to quickly understand product health status in daily morning meetings.
2. Trend Analysis
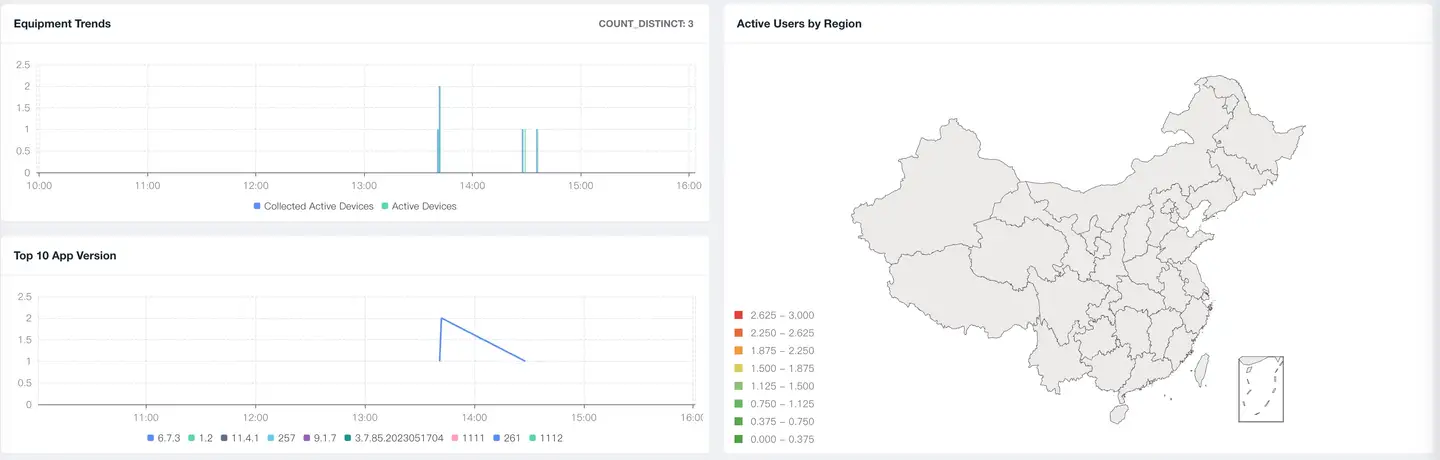
Trend analysis displays changes in user metrics over time, helping to discover growth trends, abnormal fluctuations, and periodic patterns.
Daily Active Devices Trend
Dual-Line Comparison
| Metric Line | Description | Business Meaning |
|---|---|---|
| Active Devices | Actual active users of the application | Real user scale of the product |
| Collection Devices | Number of devices from which SDK collects data | Coverage scope of the monitoring system |
Collection Coverage = Collection Devices / Active Devices
- 100%: Ideal state, all users are monitored
- 80%-100%: Healthy state, covering main users
- 50%-80%: Needs attention, some users are not monitored
- < 50%: Abnormal state, most core users are not monitored
Reasons for Collection Coverage Decline
-
Monthly Active Limit Exceeded
- Monthly active package purchased is exhausted
- SDK automatically samples, only collecting data from some users
- Impact: Incomplete monitoring data
-
SDK Issues
- SDK initialization failure
- Network reporting failure
- Impact: Some data loss
-
User Issues
- User disabled monitoring
- Application was force-stopped
- Impact: Unable to monitor some users
Note: After monthly active limit is exceeded, user statistics data can still be uploaded, but other detailed performance data will be sampled.
Top 10 App Version Trends
Displays the active user distribution trends of the top 10 app versions:
Version Iteration Analysis
- New version growth rate: Evaluate upgrade effectiveness
- Old version retention: Evaluate upgrade strategy
- Version distribution balance: Evaluate compatibility strategy
Application Scenarios
-
New Version Promotion Evaluation
- 7 days after release, new version should account for 30%-50%
- If growth is slow, check upgrade prompt strategy
-
Old Version Retirement Decision
- Versions older than 3 versions < 5%: Can stop maintenance
- 5%-10%: Only fix critical issues
-
10%: Need forced upgrade or continuous maintenance
-
Version Compatibility Evaluation
- Too many versions: Increases maintenance costs
- Recommend maintaining 2-3 major versions
Active User Geographic Distribution
Visualizes active user distribution across different regions through maps:
Regional Market Insights
- High penetration regions: Focus operations, improve ARPU
- Low penetration regions: Growth opportunities, increase promotion
- Blank regions: Potential markets, strategic layout
3. Top 10 Dimension Analysis
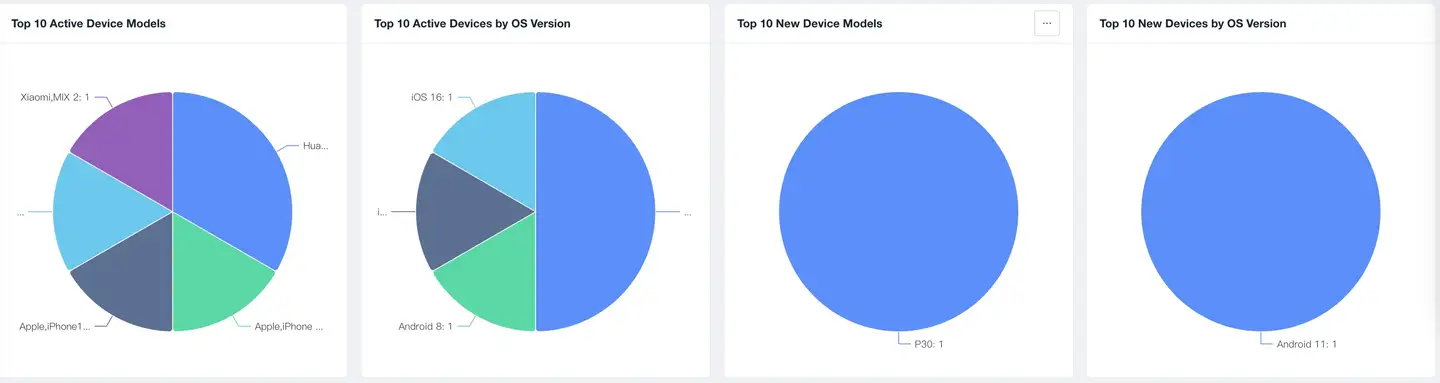
Displays user distribution across different dimensions through pie charts, helping to understand user profiles and formulate precise strategies.
Active Users - App Version Distribution
Analysis Value
- Version Health: Whether version distribution is reasonable
- Upgrade Effectiveness: How is new version coverage
- Compatibility Strategy: Which versions need to be supported
Active Users - Operating System Distribution
Analysis Value
- System Adaptation: Which system versions to focus on supporting
- New Feature Adoption: Which new APIs can be used
- Minimum Version: When can the minimum version requirement be raised
New Users - Device Model Distribution
Analysis Value
- User Profile: What devices do new users use
- Market Positioning: High-end or mid-to-low-end market
- Performance Strategy: How to do device tier optimization
New Users - App Version Distribution
Analysis Value
- Promotion Channels: Where do new users come from
- Version Appeal: Which version attracts new users more
- App Store: New user performance of each store
Application Scenarios
-
Promotion Effectiveness Evaluation
- Which version do new users mainly install
- Evaluate app store optimization effectiveness
- Compare quality of different channels
-
Version Strategy
- Do new users use the latest version
- Are old versions still being promoted
- Need to update promotion materials
Best Practices
1. Establish Data Dashboards
Daily Monitoring Dashboard
- Core Metrics: DAU, New Users, Start Count
- Update Frequency: Every morning
- Focus: Month-over-month changes, abnormal fluctuations
Weekly Operations Dashboard
- Core Metrics: WAU, Growth Rate, Activity Rate
- Update Frequency: Every Monday
- Focus: Week-over-week comparison, operations activity effectiveness
Monthly Business Dashboard
- Core Metrics: MAU, Monthly Growth, User Structure
- Update Frequency: Beginning of each month
- Focus: Monthly target achievement, trend prediction
2. Set Up Data Alerts
Abnormal Decline Alerts
- DAU month-over-month decline > 15%
- New users month-over-month decline > 20%
- Collection coverage < 70%
Abnormal Rise Alerts
- DAU month-over-month rise > 50% (may be data anomaly)
- New users month-over-month rise > 100% (verify data authenticity)
FAQ
Q1: Why is the collection device count less than or equal to active device count?
A: This is a normal phenomenon, mainly due to the following reasons:
1. Monthly Active Package Limit (Most Common)
- Purchased 500K monthly active package, but actual MAU is 1M
- SDK automatically samples, only collecting data from 500K users
- Impact: Performance data incomplete, but user statistics data still accurate
- Solution: Upgrade package or accept sampling
2. SDK Reporting Failure
- Network issues causing data reporting failure
- SDK configuration error
- Impact: Some user data loss
- Solution: Check SDK configuration and network settings
3. User Actively Disabled
- User disabled monitoring permissions
- Application was killed by system in background
- Impact: Unable to collect data from this user
- Solution: Guide users to enable permissions
Tip: Collection coverage is recommended to stay above 80% to ensure data representativeness.
Q2: Why did active users suddenly decline?
A: Systematic troubleshooting:
1. Normal Fluctuation
- Holiday effects (weekends, holidays)
- Seasonal patterns (student summer/winter vacations)
- Judgment: Compare with same period last year
2. Product Issues
- New version has serious bugs
- Significant performance decline
- Core functionality abnormal
- Judgment: Check version release time and performance metrics
3. Data Issues
- SDK collection abnormal
- Server failure
- Judgment: Check collection device ratio