Request Analysis
The Request Analysis feature can monitor the network request performance and network environment of online applications in real-time, providing key data support for operations personnel to determine whether network errors (such as unknown host or connection timeout errors) are caused by "client network environment" issues.
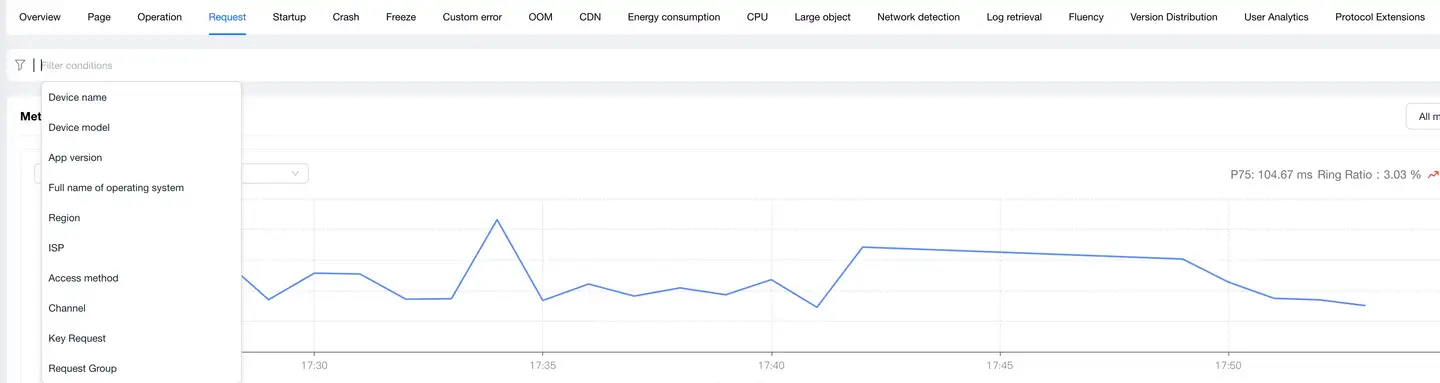
Filter Conditions
You can filter by the following dimensions:
- Device name
- Device model
- App version
- Operating system
- Operating system major version
- Region
- Carrier
- Access method
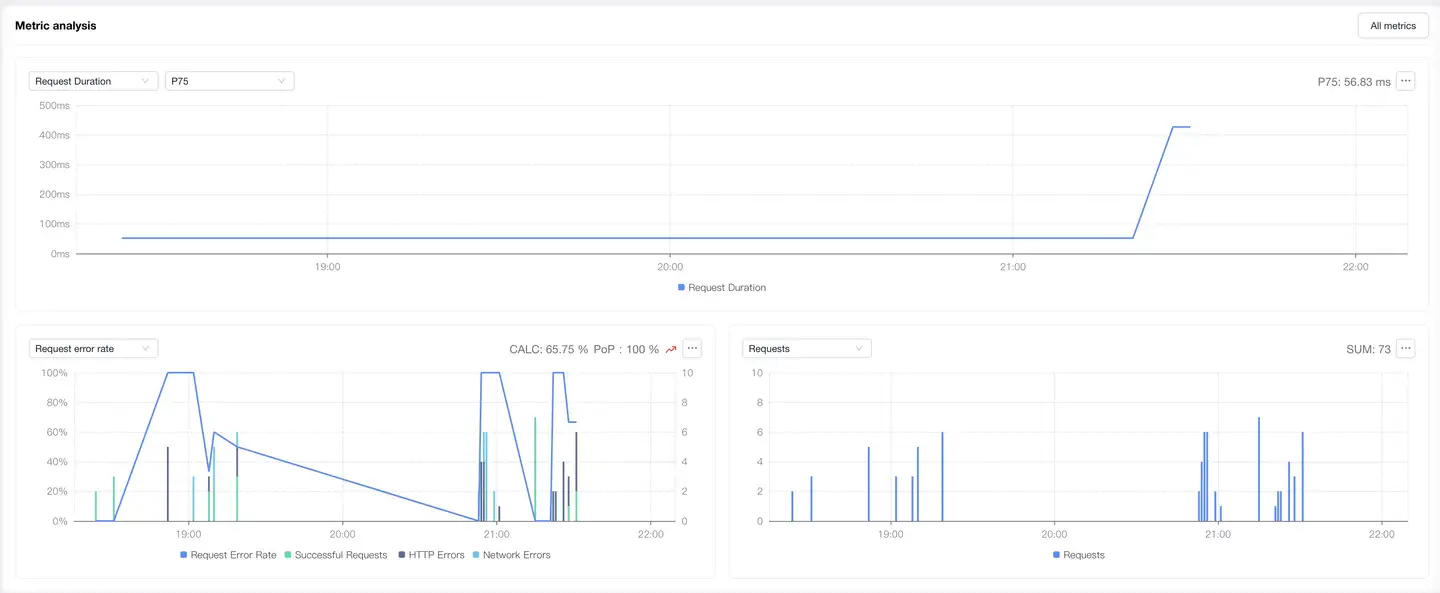
Metric Analysis
Displays trend charts of network request performance metrics under the filter conditions. You can filter and analyze performance metrics as needed. Time-based performance metrics support the following value analyses, with P75 displayed by default:
- AVG
- P50
- P75
- P95
- P99
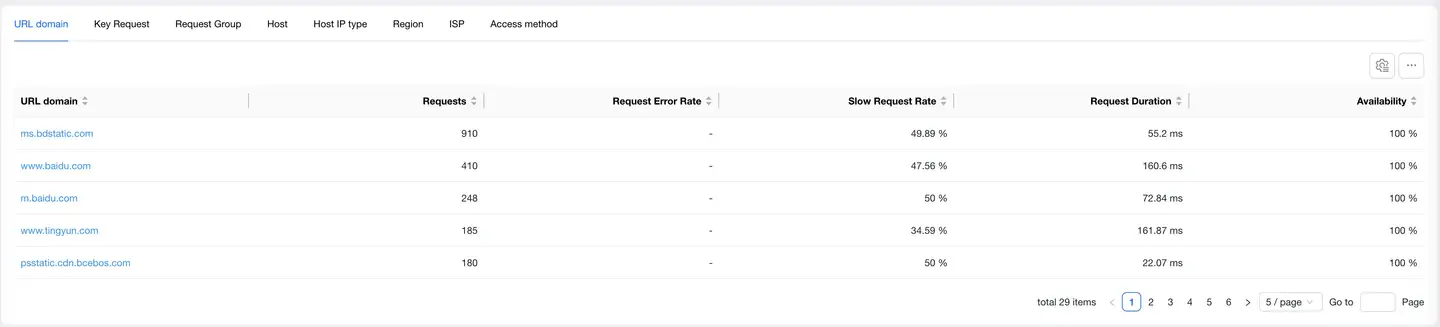
Dimension Analysis
Analyzes network request performance through the following 6 dimensions:
- URL domain
- Host
- Host IP type
- Region
- Carrier
- Access method
After selecting any dimension detail data:
- Filter conditions will add the filter item of the selected dimension detail
- All modules on the page display the filtered performance data
- The region dimension map can be drilled down, supporting drill-down to province/state
- You can filter network request performance metrics on the left to analyze their performance in different regions
- The list supports customizable headers
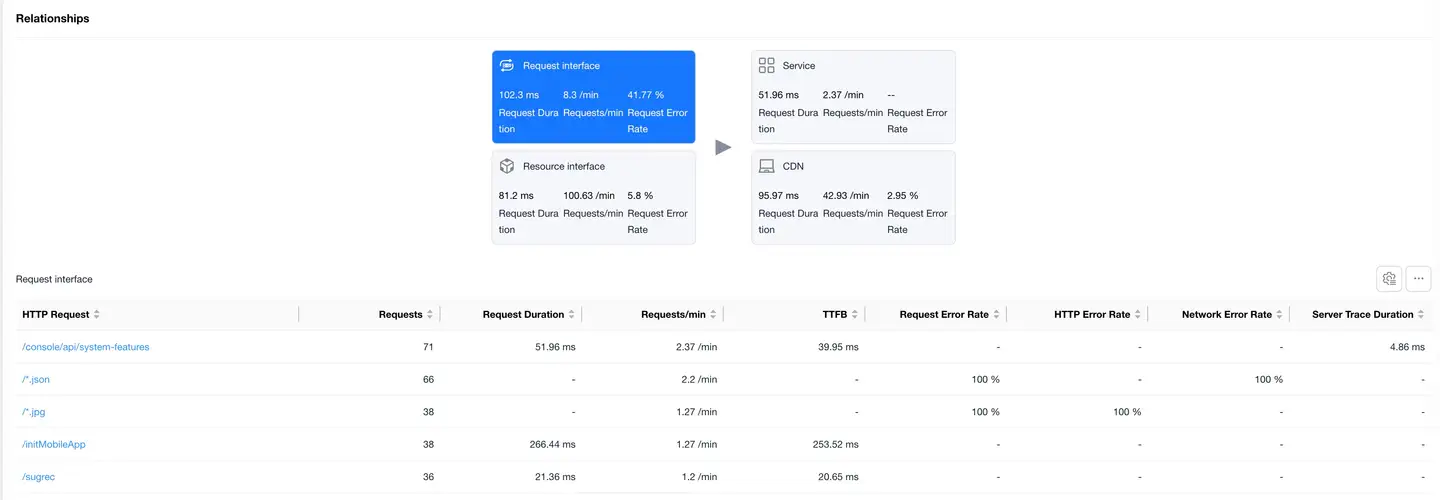
Relationship Topology
Displays the complete link between application network requests and backend services, helping to analyze performance bottlenecks.

Request Interface
Select the Request Interface card to display the list of request data with "mime-type as text or json" at the bottom.
The list displays data including:
- HTTP request
- Request count
- Request duration
- Requests per minute
- TTFB
- Request error rate
- Network error rate
- Server-side trace duration
- Slow request count
- Slow request percentage
- DNS duration
- TCP duration
- SSL duration
- Server response duration
- Remaining packet duration
- Server-side trace error rate
- Upstream traffic consumption
- Downstream traffic consumption
- Availability
Click on the HTTP request to enter Request Detail Analysis, which displays the detailed data of the HTTP request.
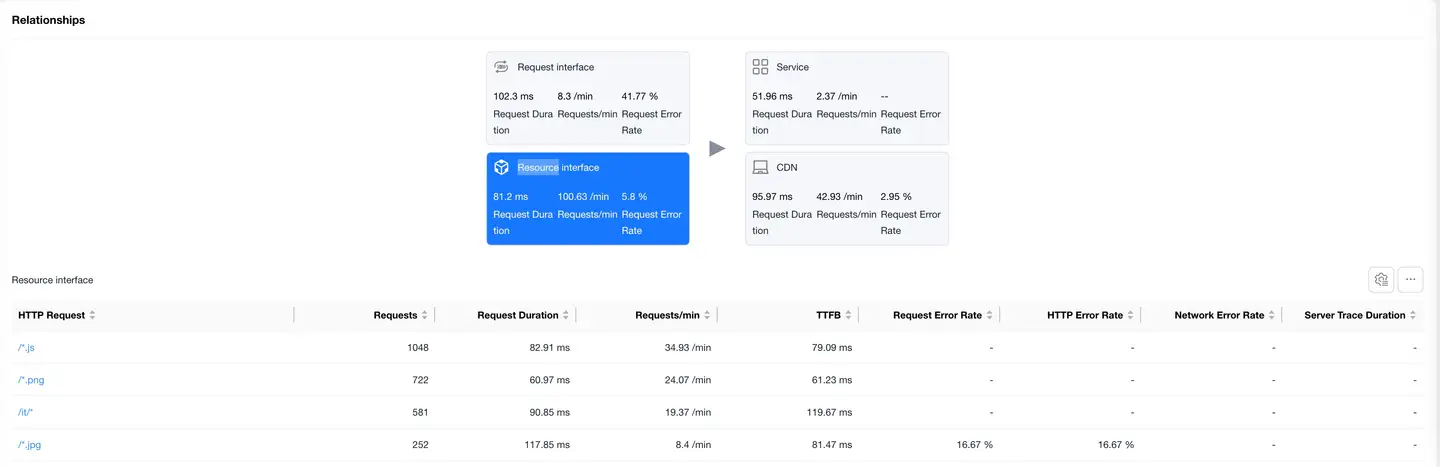
Resource Interface
Select the Resource Interface card to display the resource request data list at the bottom. The list displays the same data as the request interface.
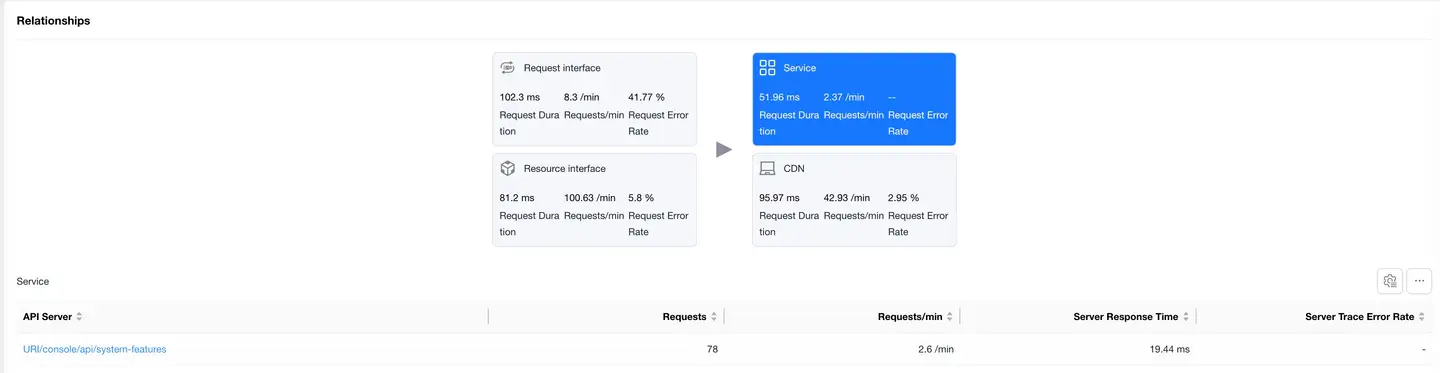
Service
Select the Service card to display the backend service list (requires backend integration with APM Agents).
The list displays data including:
- Backend service
- Request count
- Requests per minute
- Server response duration
- Server-side trace error rate
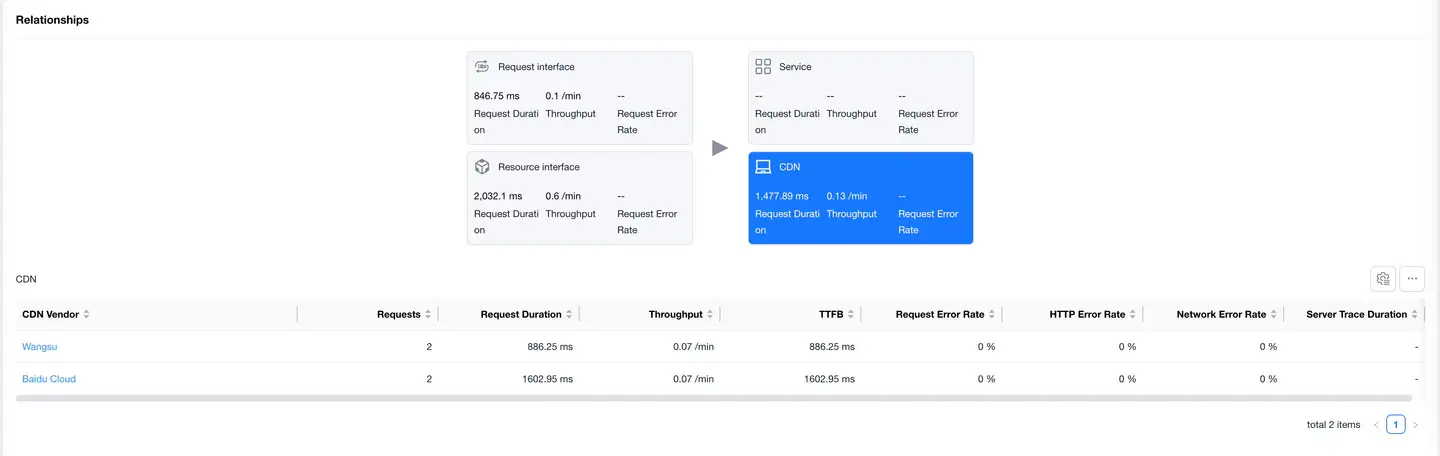
CDN
Select the CDN card to display the CDN provider data list. The list displays the same data as the request interface.
Request Details
Filter Conditions
Same as the filter conditions described above.
Metric Analysis
Same as the metric analysis described above.
Dimension Analysis
Same as the dimension analysis described above.
Relationship Topology
Displays the complete link between application network requests and backend services. Includes the following two parts:
Service
Select the Service card to display the backend service list (requires backend integration with APM Agents). The list displays the same data as the Service section described above.
CDN
Select the CDN card to display the CDN provider data list. The list displays the same data as the CDN section described above.
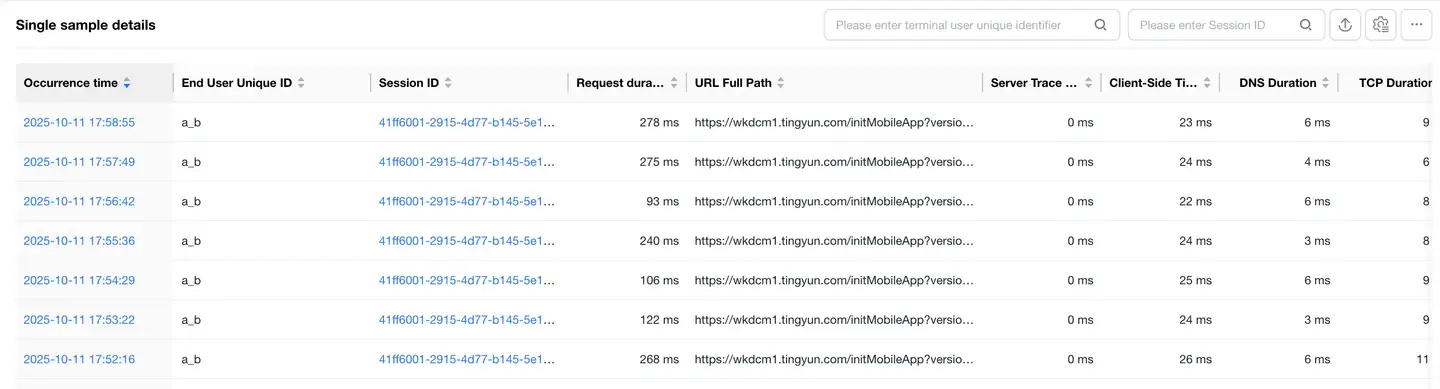
Sample Details
The details list displays all sample details of the selected interface.
The list displays data including:
- timestamp (occurrence time)
- Unique identifier of end user
- Session ID
- Full URL path
- Request duration
- Client local duration
- DNS duration
- TCP duration
- SSL duration
- Server response duration
- Remaining packet duration
- TCP packet loss rate 「Details of packet loss when the SDK performs TCPPing on the requested domain name upon network request completion.」
- etc.
List features:
- Support for filtering by user ID, session ID
- Support for export
- Support for customizable headers
- Click on Session ID to jump to Session Details
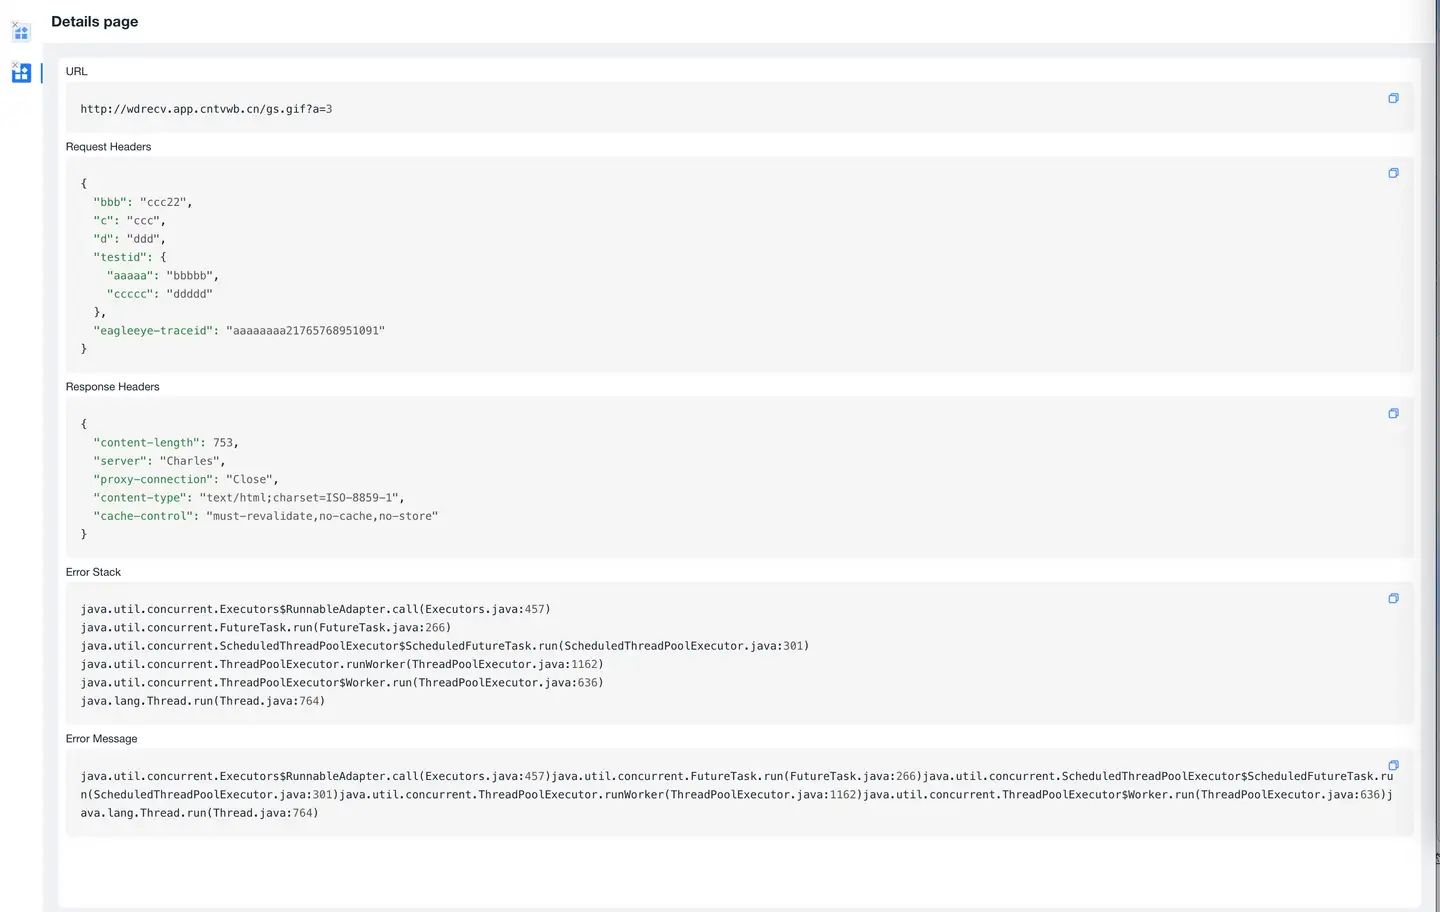
URL Detail Tracing
Click on the timeStamp in the details list to enter the URL detail tracing page:
- Displays URL information
- If Request Content Collection is enabled, it will also display:
- Request headers
- Response headers
- Request body
- Response body information