Protocol Extension
Overview
The protocol extension feature provides R&D, operations, and product teams with network protocol monitoring capabilities beyond HTTP/HTTPS, supporting performance analysis of modern communication protocols such as WebSocket and gRPC, while providing flexible extension for custom protocol monitoring. It helps teams fully understand the network communication status of applications, quickly locate performance issues at the protocol level, and ensure the stability of real-time communication and microservices architecture.
Core Value
- Full Protocol Coverage: Supports HTTP/HTTPS, WebSocket, gRPC, and other protocols for end-to-end monitoring
- Real-Time Communication Monitoring: Focuses on performance and stability analysis of real-time protocols like WebSocket
- Microservices Architecture Support: Deep monitoring of microservices communication protocols like gRPC
- Flexible Extension Capability: Customize monitoring metrics and dimensions for any protocol through API
Technical Requirements
- SDK Version: ≥ 2.16.0
- Supported Platforms: Android, iOS, Harmony OS
- Data Collection: Predefined protocols automatically collected, custom protocols require instrumentation
Use Cases
Use Case 1: Real-Time Communication Performance Optimization
WebSocket as the core communication protocol of the application requires monitoring of connection stability and message transmission performance.
Practice Case:
- Social app uses WebSocket for instant messaging
- Monitoring found message latency P95 reached 2s, failure rate 5%
- Located connection issues in specific regions through protocol extension
- After optimization, latency dropped to 500ms, failure rate dropped to 0.5%
- User message delivery rate increased 95%
Use Case 2: Microservices Performance Monitoring
Under gRPC microservices architecture, need to monitor performance and error rates of inter-service calls.
Practice Case:
- Application uses gRPC for mobile-to-microservices communication
- Found a gRPC service call failure rate of 10%
- Located timeout issues in specific methods through detail list
- After backend team optimized the service, failure rate dropped to 1%
- Overall application availability increased 3%
Use Case 3: Custom Protocol Monitoring
Using private protocols or special network protocols requires custom monitoring solutions.
Practice Case:
- IoT application uses MQTT protocol for communication
- Customized MQTT protocol monitoring through SDK API
- Established metric system: connection count, message volume, transmission latency
- Discovered frequent disconnection and reconnection issues on device side
- After optimizing heartbeat mechanism, connection stability increased 80%
Supported Protocol Scenarios
Predefined Protocols
WebSocket
- Application Scenario: Mobile
- Monitoring Metrics: Connection latency, message latency, failure rate, TPM
- Data Collection: SDK automatically collects, no additional configuration needed
gRPC
- Application Scenario: Mobile
- Monitoring Metrics: Call latency, failure rate, throughput, errors
- Data Collection: SDK automatically collects, no additional configuration needed
Custom Protocols
Custom Capabilities
- Custom protocol name and type
- Custom monitoring metrics (metrics)
- Custom analysis dimensions (tags)
- Custom detail data (data)
Core Features
1. Data Dashboard
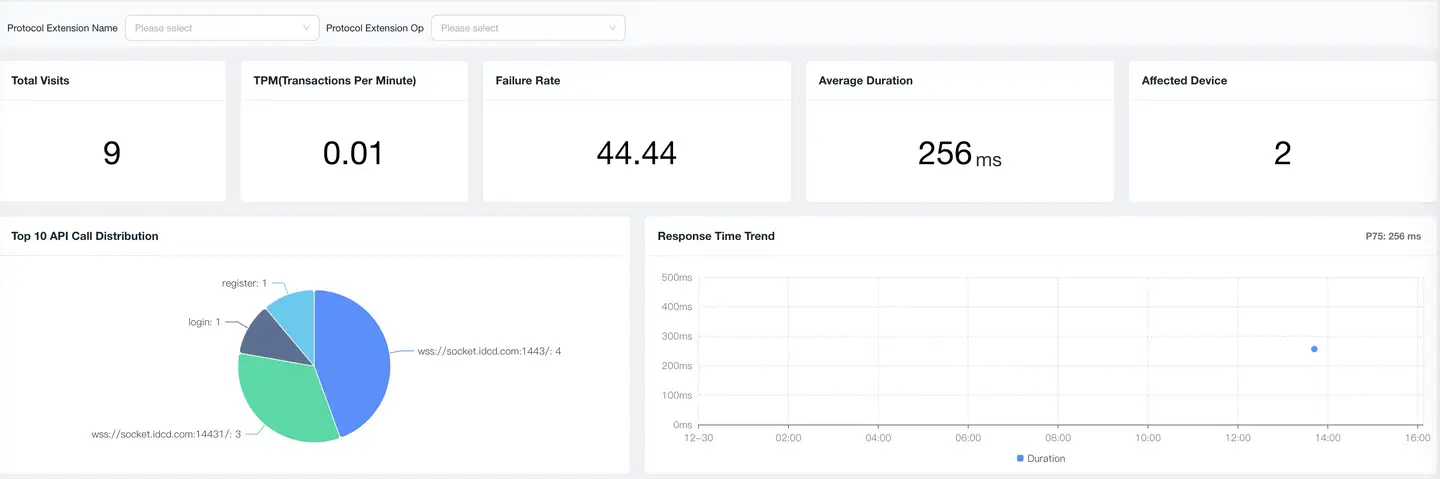
The protocol extension data dashboard provides a global view of protocol performance, supporting multi-protocol comparison analysis.
Global Filters
Supports multi-dimensional data filtering to accurately locate problem scope:
Filter Dimensions
- Protocol Extension Name: Specific protocol instance (e.g., Chat WebSocket, Push WebSocket)
- Protocol Extension Type: Protocol category (WebSocket, gRPC, Custom)
2. Data Cards

Data cards display core performance metrics of protocols, providing a quick overview.
Basic Metrics
| Metric | Description | Calculation Method |
|---|---|---|
| Access Count | Total number of protocol calls | Total calls within statistical time period |
| TPM | Accesses per minute | Access Count / Statistical Minutes |
| Average Latency | Average response time of protocol calls | Default shows P75 percentile |
| Failure Rate | Proportion of failed calls | Failed Count / Total Access Count × 100% |
| Affected Users | Unique number of users using this protocol | Deduplicated count |
Failure Determination Rules
WebSocket
status = -1: Connection failure or abnormal disconnection- Can customize failure determination conditions through SDK API
gRPC
- gRPC status code non-zero: Call failure
- Timeout without response: Call failure
Custom Protocol
- Set failure conditions through SDK API
- Flexibly define failure standards that meet business requirements
3. Trend Analysis
Displays trends of protocol performance metrics over time, helping to discover performance fluctuations and anomalies.
Dimension Analysis
Data Type Distribution
- Displays access volume distribution of different protocol types
Name Failure Rate Distribution
- Displays failure rates of different instances
Failure Rate Trend
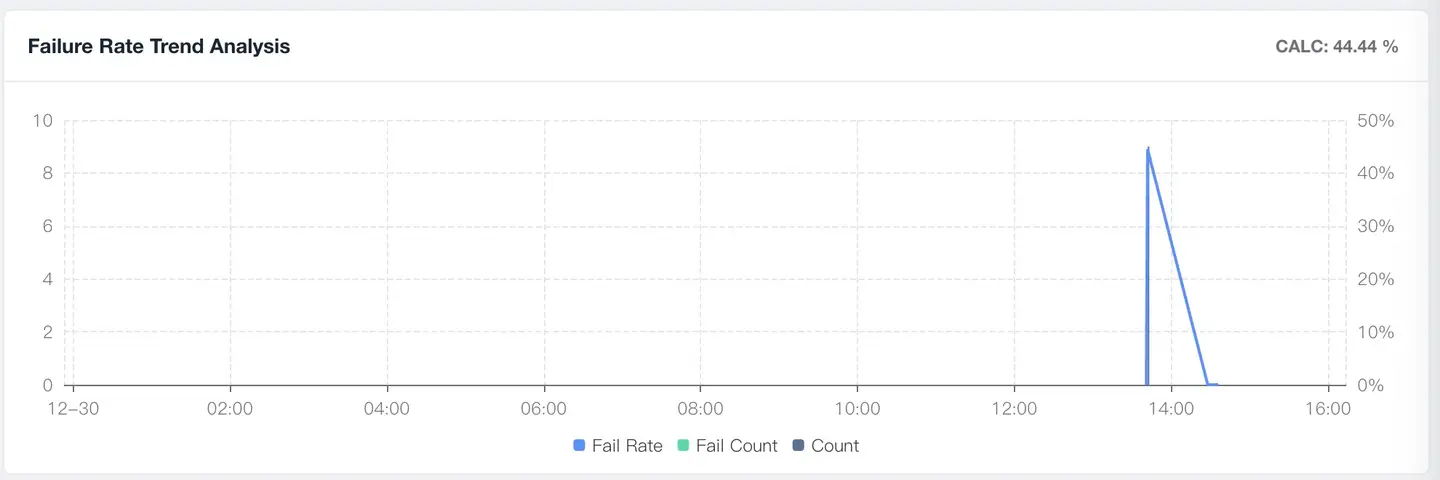
Displays protocol failure rate trends over time:
Analysis Points
- Sudden Rise: May be service failure or network issues
- Sustained High Level: Need deep investigation of protocol implementation
- Periodic Fluctuation: May be related to business peaks or network environment
- Gradual Rise: May be performance degradation or user volume increase
Alert Recommendations
- Failure Rate > 5%: Needs attention
- Failure Rate > 10%: Needs urgent handling
- Failure Rate month-over-month rise > 50%: Trigger alert
Latency Trend
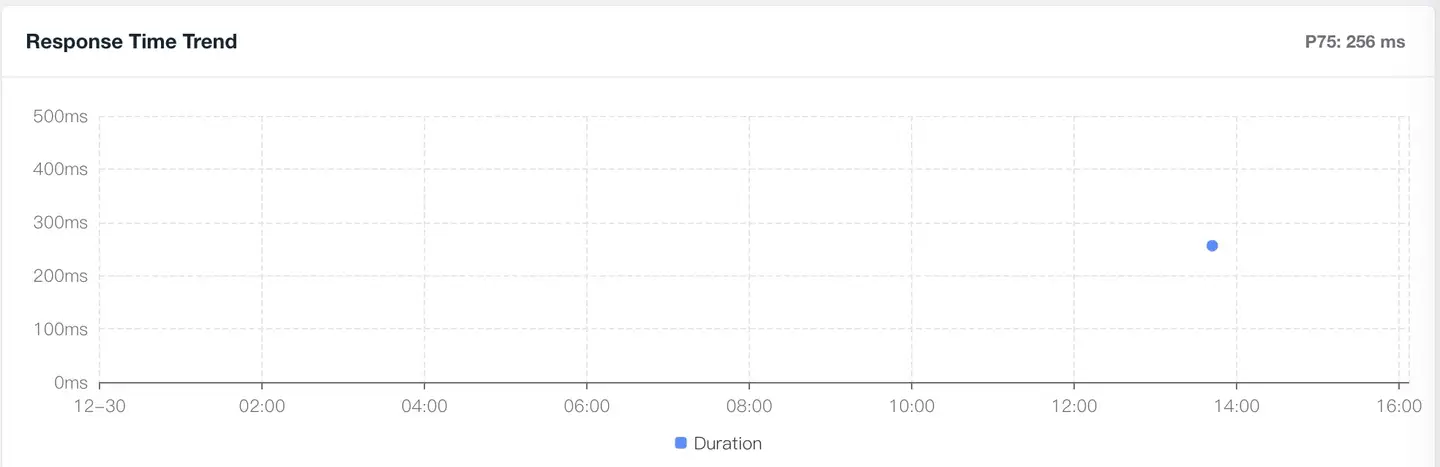
Displays protocol latency trends over time:
Percentile Analysis (can be customized in dashboard, default uses P75)
- P50 (Median): Experience level of 50% of users
- P75 (Default): Experience level of 75% of users
- P95: Focus on long-tail user experience
- P99: Extreme scenario performance
Optimization Directions
- Sudden latency increase: Check network or server-side issues
- Consistently high: Optimize protocol implementation or network strategy
- Large fluctuations: Optimize connection reuse and heartbeat mechanism
4. Detail List

The detail list displays statistical data of all protocols, supporting deep analysis and problem localization.
Metric List
Default Metrics (SDK automatically collects)
- Name, Data Type, Access Count, TPM, Latency P75, Availability
- Active Device Count, Affected User Count
Custom Metrics (uploaded through metrics)
- Business-related metrics (e.g., message size, reconnection count)
- Performance-related metrics (e.g., serialization latency, compression rate)
- Quality-related metrics (e.g., message loss rate, out-of-order rate)
Device Dimensions (can be customized in dashboard)
Default Dimensions
- Device Model, Operating System, App Version
- Country, Province/State, City, ISP
- Network Type (WiFi, 4G, 5G)
Custom Dimensions (uploaded through tags)
- Business dimensions (e.g., chat room ID, user level)
- Technical dimensions (e.g., server region, protocol version)
- Environment dimensions (e.g., foreground/background, weak network/normal network)
Custom Protocol Configuration
Configuration Process
1. SDK Instrumentation Define Data
   ↓ Set protocol name, metrics, dimensions

2. Metric System Extraction
   ↓ Configure custom metrics and dimensions

3. Dashboard Configuration
   ↓ Copy and customize dashboard

4. Data Display
   ↓ View protocol monitoring data
Step 1: SDK Instrumentation
Android SDK Example
// Start custom protocol monitoring
NBSAppAgent.startSpan(String name, String operation);
Parameter Description
name: Protocol name (e.g., MQTT Message, Custom RPC)operation: Operation type (e.g., send, receive, connect)
iOS SDK Example
Objective-C
// Start custom protocol monitoring
+ (id<NBSSpan>)startSpanWithName:(NSString *)name
                       operation:(NSString *)operation;
Swift
// Start custom protocol monitoring
startSpan(withName: String!, operation: String!)
Parameter Description
name: Protocol name (e.g., MQTT Message, Custom RPC)operation: Operation type (e.g., send, receive, connect)
Harmony OS SDK Example
import tingyun, { SpanStatuses } from '@tingyun/sdk-core'

// 1. Start protocol monitoring
const span = tingyun.startSpan('span_name', 'span_operation')

// 2. Set detail data
span.setData('dataKey', 'dataValue')

// 3. Set custom dimensions
span.setTag('tagKey', 'tagValue')

// 4. Set custom metrics
span.setMetric('time', 50, SpanMetricUnits.Millisecond)

// 5. Set duration
span.setDuration(100)

// 6. Set status
span.setStatus(SpanStatuses.OK)
span.setStatusCode('200')

// 7. Create child Span (optional)
const childSpan = span.startChild('child_span_name', 'child_span_operation')
childSpan.finish()

// 8. End monitoring
span.finish()
Parameter Description
span_name: Protocol namespan_operation: Operation typesetData(): Set detail datasetTag(): Set custom dimensionssetMetric(): Set custom metricssetDuration(): Set duration (milliseconds)setStatus(): Set status (OK/ERROR)setStatusCode(): Set status code
Step 2: Metric System Configuration
Enter Metric System
- Navigate to: Platform Management → Metric System
- Select Data Source: Mobile Protocol Extension
- Click [New Metric]
Configure Custom Metrics
| Configuration Item | Description | Example |
|---|---|---|
| Metric Name | Display name of the metric | Message Size |
| Metric Field | Key of metric in SDK | message_size |
| Aggregation Method | sum/avg/max/min/count | avg |
| Unit | Unit of the metric | KB |
Configure Custom Dimensions
| Configuration Item | Description | Example |
|---|---|---|
| Dimension Name | Display name of the dimension | Message Topic |
| Dimension Field | Key of tag in SDK | topic |
| Dimension Type | String/Numeric | String |
Step 3: Dashboard Configuration
Copy Default Dashboard
- Navigate to: Dashboard
- Find [Mobile Protocol Extension Dashboard]
- Click [Copy] button
- Rename to custom protocol dashboard (e.g., Socket Monitoring Dashboard)
Update Chart Configuration
- Enter edit mode
- Select the chart to modify
- Update chart configuration:
- Metric: Select custom metric
- Dimension: Select custom dimension
- Filter: Add protocol type filter
Chart Configuration Example
Chart: Socket Message Size Trend
- Metric: Message Size (avg)
- Dimension: Time
- Filter: Protocol Type = Socket
- Chart Type: Line Chart

Chart: Message Topic Distribution
- Metric: Access Count
- Dimension: Message Topic
- Filter: Protocol Type = MQTT
- Chart Type: Pie Chart
Performance Optimization Guide
WebSocket Performance Optimization
Issue 1: Connection Latency Too Long
Symptom: WebSocket connection establishment latency > 2s
Common Causes
- Slow DNS resolution
- Slow TCP handshake
- Slow SSL/TLS handshake
- Slow server response
Optimization Recommendations
-
DNS Optimization:
- Use HTTPDNS
- Cache DNS results locally
- Pre-resolve domain names
-
Connection Optimization:
- Connection reuse and keep-alive
- Reduce handshake times
- Optimize heartbeat strategy
-
Protocol Optimization:
- Prefer WSS (encrypted)
- Enable compression (permessage-deflate)
Issue 2: High Message Latency
Symptom: Message transmission latency P95 > 1s
Common Causes
- Message body too large
- Network congestion
- Slow server processing
- Serialization/deserialization latency
Optimization Recommendations
-
Message Optimization:
- Compress message content
- Use binary protocols (e.g., Protocol Buffers)
- Fragment large messages for transmission
-
Network Optimization:
- Select optimal server nodes
- Degradation strategy in weak network
- Message priority queue
-
Code Optimization:
- Asynchronous message processing
- Optimize serialization performance
- Batch send messages
Issue 3: Frequent Connection Disconnections
Symptom: WebSocket failure rate > 5%
Common Causes
- Unstable network
- Unreasonable heartbeat mechanism
- Server actively disconnects
- App enters background
Optimization Recommendations
-
Heartbeat Mechanism:
- Reasonably set heartbeat interval (recommend 30-60s)
- Auto-reconnect after heartbeat timeout
- Distinguish foreground/background heartbeat strategy
-
Reconnection Strategy:
- Exponential backoff reconnection
- Limit reconnection attempts
- Pause reconnection when network is disconnected
-
Connection Keep-Alive:
- Maintain connection when app goes to background
- Monitor network changes and actively reconnect
- Server-side optimize connection timeout
gRPC Performance Optimization
Issue 1: High Call Latency
Optimization Directions
- Enable HTTP/2 multiplexing
- Use connection pool
- Enable gRPC compression
- Optimize Protobuf serialization
Issue 2: High Call Failure Rate
Optimization Directions
- Configure reasonable timeout
- Implement retry mechanism
- Circuit breaker and degradation strategy
- Monitor server health status
Custom Protocol Optimization
General Optimization Principles
-
Performance First:
- Choose efficient serialization method
- Reduce unnecessary data transmission
- Optimize protocol handshake process
-
Reliability First:
- Implement message acknowledgment mechanism
- Design retransmission strategy
- Handle network exceptions
-
Extensibility:
- Design version compatibility mechanism
- Reserve extension fields
- Support protocol negotiation
Best Practices
1. Troubleshooting Process
1. Discover Issue
   ↓ Failure rate/latency abnormal

2. Confirm Scope
   ↓ Specific protocol/region/device

3. Analyze Trend
   ↓ When started/is it continuous

4. View Details
   ↓ Error information/call stack

5. Locate Root Cause
   ↓ Client/network/server

6. Formulate Solution
   ↓ Optimize/degrade/rollback

7. Verify Effectiveness
   ↓ Compare data before and after optimization
2. Data Analysis Recommendations
Multi-Dimensional Comparison
- Performance comparison of different protocols
- Performance comparison of different regions
- Performance comparison of different network environments
Correlation Analysis
- Correlation between protocol performance and business metrics
- Correlation between protocol performance and device performance
- Correlation between protocol performance and version
Trend Prediction
- Predict future trends based on historical data
- Early detection of performance degradation
- Plan capacity and optimization
FAQ
Q1: How to design a metric system for custom protocols?
A: Follow these principles:
Core Metrics (Required)
-
Performance Metrics:
- Call latency (P50/P75/P95/P99)
- TPM (calls per minute)
- Failure rate
-
Business Metrics:
- Metrics directly related to business
- E.g., message size, queue length, concurrency
Auxiliary Metrics (Optional)
-
Quality Metrics:
- Retry count
- Message loss rate
- Out-of-order rate
-
Resource Metrics:
- Traffic consumption
- CPU usage
- Memory usage
Metric Design Example
MQTT Protocol Metric System:

Core Metrics:
- Connection latency, message latency, failure rate, TPM

Business Metrics:
- Message size, topic count, subscription count

Quality Metrics:
- Reconnection count, message loss rate, QoS distribution

Dimensions:
- Topic, QoS level, message type