Page Analysis
The page analysis function can monitor the online application page loading performance in real-time, helping developers quickly locate problems and optimize user experience.
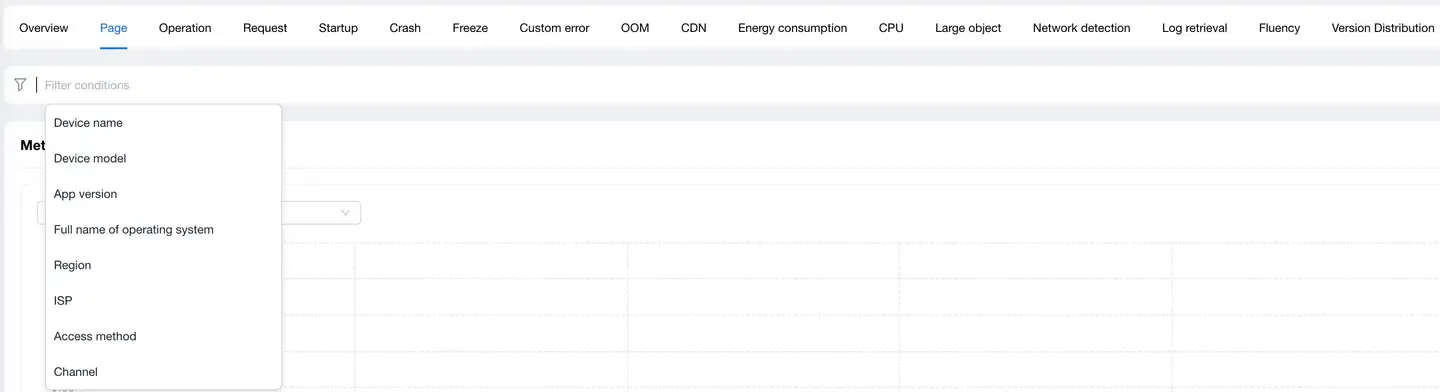
Filter Conditions
You can filter by the following dimensions:
- Device name
- Device model
- App version
- Operating system
- Operating system major version
- Region
- Carrier
- Access method
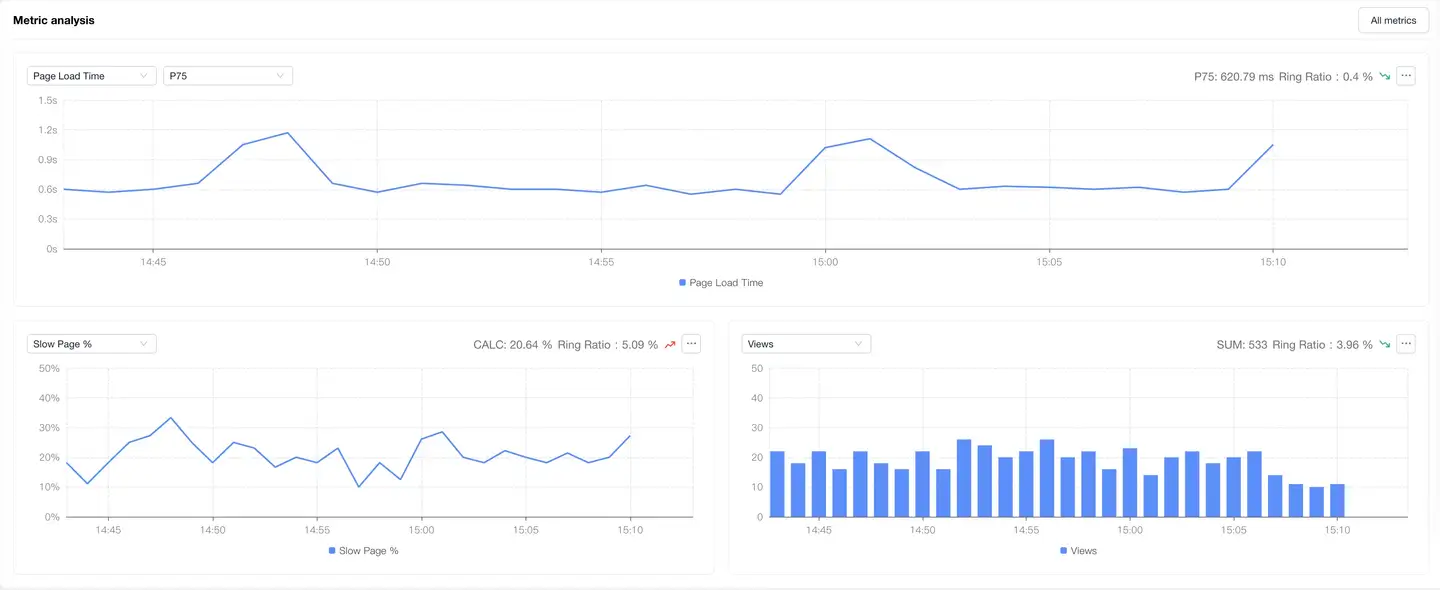
Metrics Analysis
Displays trend charts of page performance metrics under filter conditions. You can filter and analyze performance metrics as needed. Time-based performance metrics support the following value analysis, with P75 displayed by default:
- Average
- P50
- P75
- P95
- P99
Dimension Analysis
Analyzes page loading performance through the following four dimensions:
- Operating system major version
- Device model
- App version
- Region
After selecting any dimension detail data:
- Filter conditions will add filter items for the selected dimension details
- All modules on the page display performance data after filtering
- The region dimension map can be drilled down, supporting drill-down to province/state

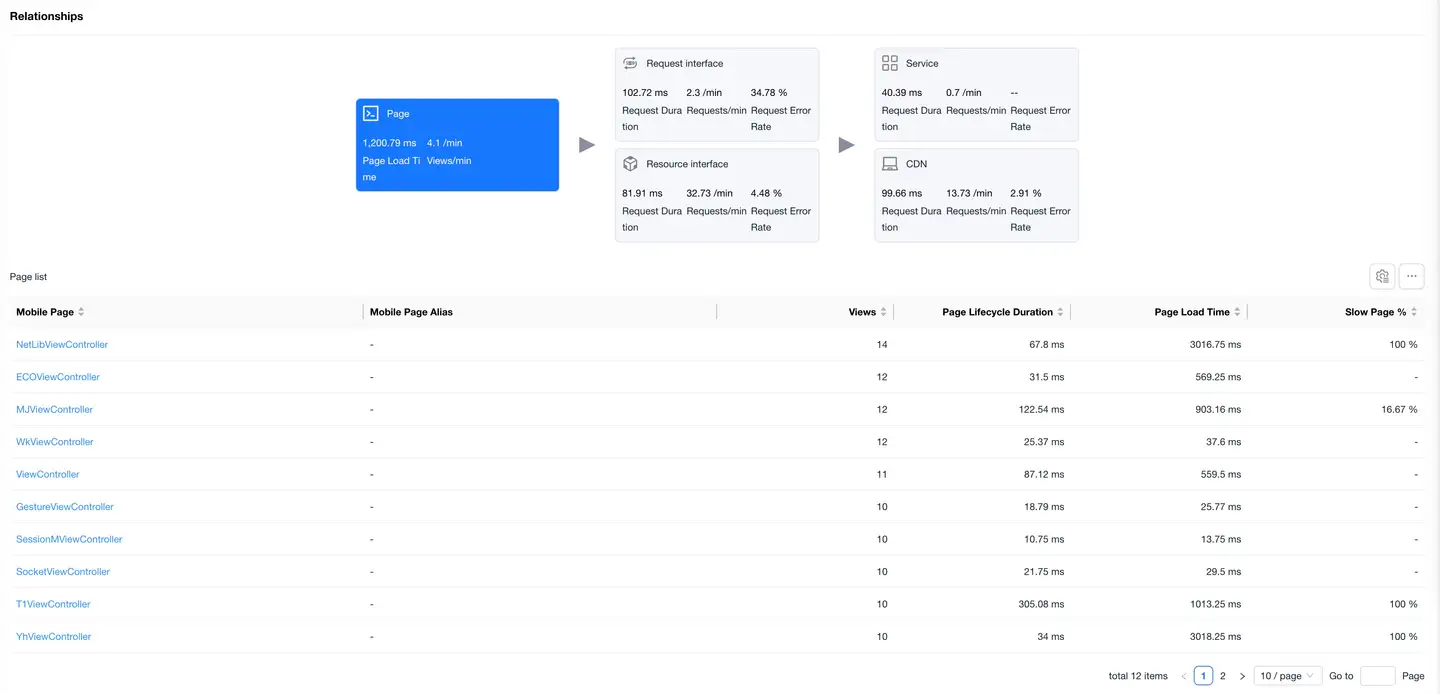
Relationship Topology
Displays the complete link between application page loading and backend services, helping to analyze performance bottlenecks.

Pages
The Pages card is selected by default, with the page performance data list displayed at the bottom.
The list shows data including:
- Mobile Page
- Visit Count
- Page Lifecycle Duration
- Page Load Duration
- Slow Page Percentage
- Page_Alias(You can add aliases for pages in entity management)
Click on a page in the list to enter the Page Details, which displays detailed data for that page.
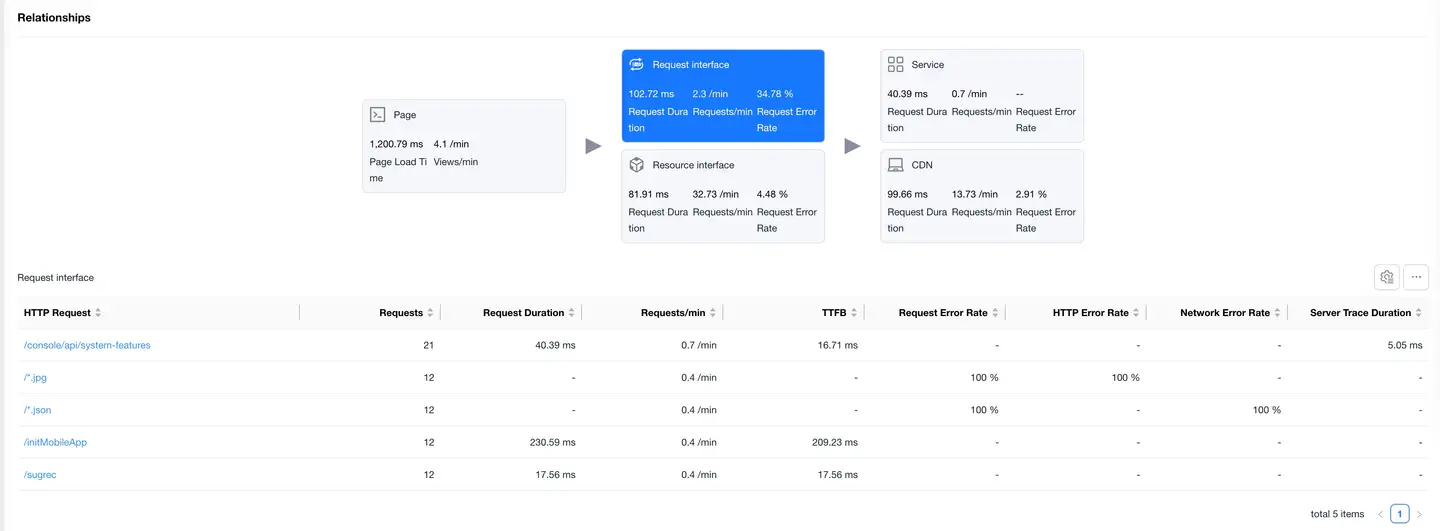
Request Interfaces
Select the Request Interfaces card to display the list of requests with "mime-type as text or json".
The list shows data including:
- HTTP Request
- Request Count
- Request Duration
- Requests Per Minute
- TTFB
- Request Error Rate
- Network Error Rate
- Server-side Trace Duration
- Slow Request Count
- Slow Request Percentage
- DNS Duration
- TCP Duration
- SSL Duration
- Server Response Duration
- Remaining Package Duration
- Server-side Trace Error Rate
- Upstream Traffic Consumption
- Downstream Traffic Consumption
- Availability
Click on an HTTP request to enter the Request Detail Analysis, which displays detailed data for that HTTP request.
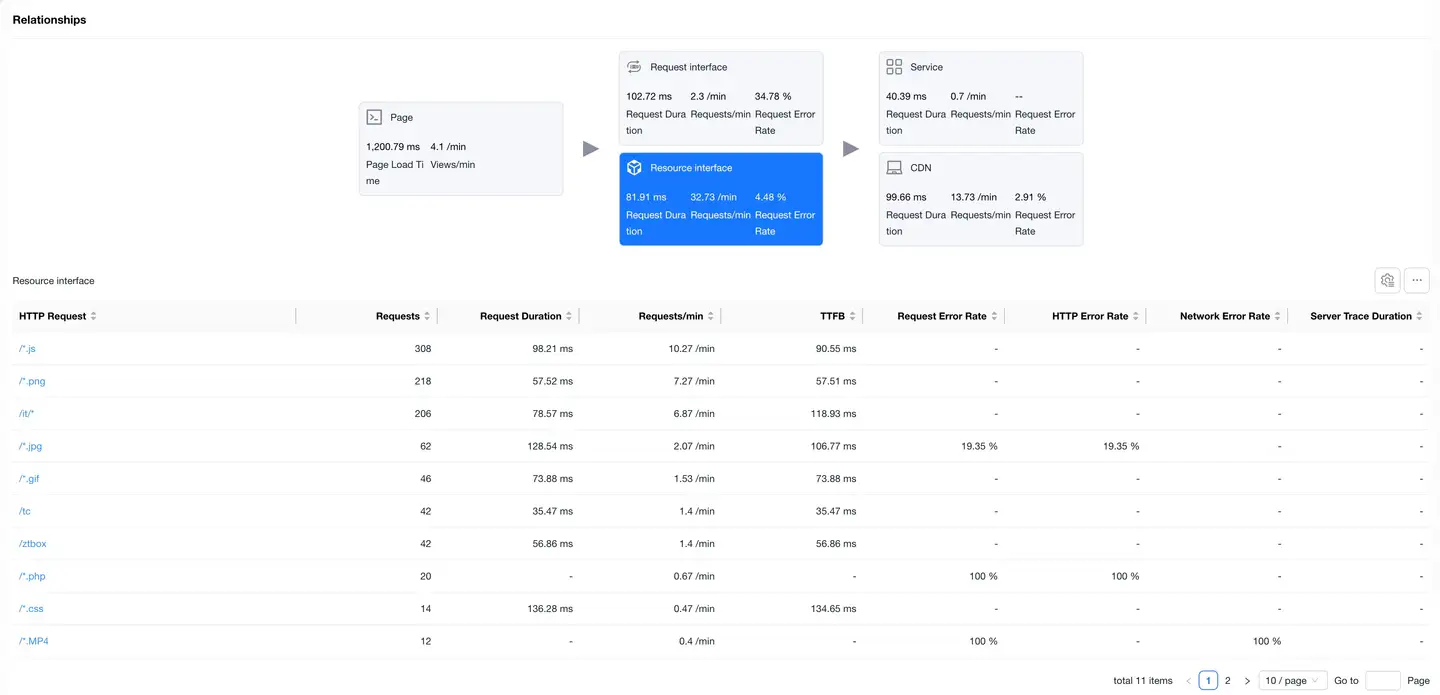
Resource Interfaces
Select the Resource Interfaces card to display the resource request data list. The list shows data same as request interfaces.
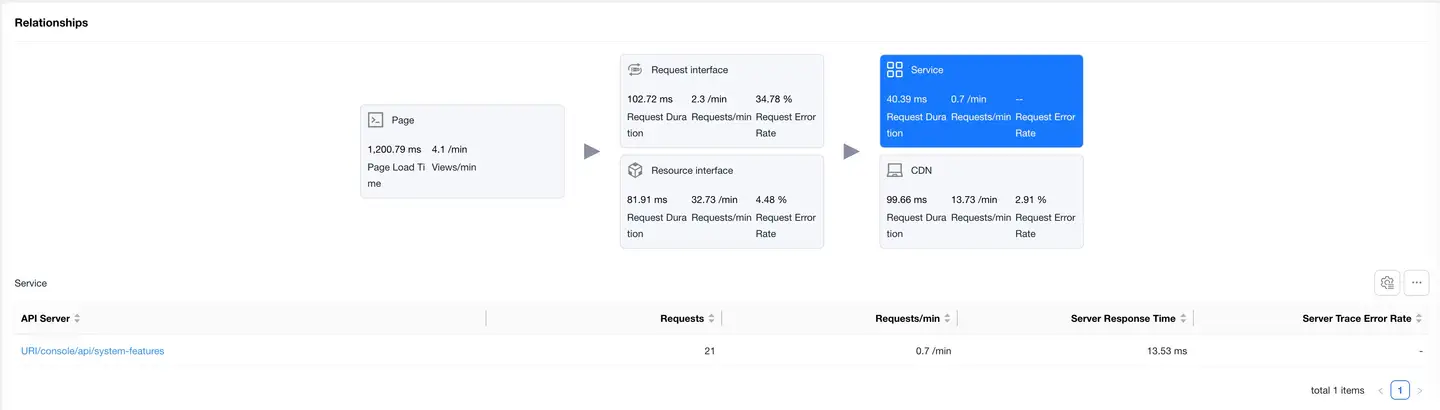
Services
Select the Services card to display the backend service list "requires backend to embed APM Agent".
The list shows data including:
- Backend Service
- Request Count
- Requests Per Minute
- Server Response Duration
- Server-side Trace Error Rate
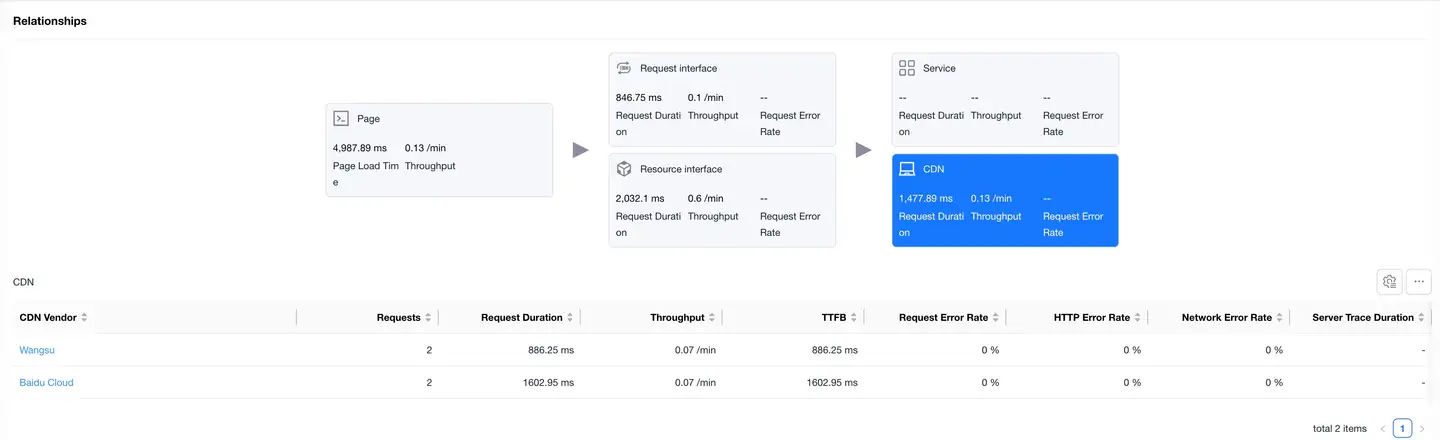
CDN
Select the CDN card to display the CDN vendor data list. The list shows data same as request interfaces.
Page Details
Filter Conditions
Same as the filter conditions above.
Metrics Analysis
Same as the metrics analysis above.
Dimension Analysis
Same as the dimension analysis above.
Relationship Topology
Displays the complete link between a single application page loading and backend services, helping to analyze performance bottlenecks.
Request Interfaces
Select the Request Interfaces card to display the list of requests with "mime-type as text or json". The list shows data same as the request interfaces above.
Resource Interfaces
Select the Resource Interfaces card to display the resource request data list. The list shows data same as the request interfaces above.
Services
Select the Services card to display the backend service list "requires backend to embed APM Agent". The list shows data same as the services above.
CDN
Select the CDN card to display the CDN vendor data list. The list shows data same as the CDN above.
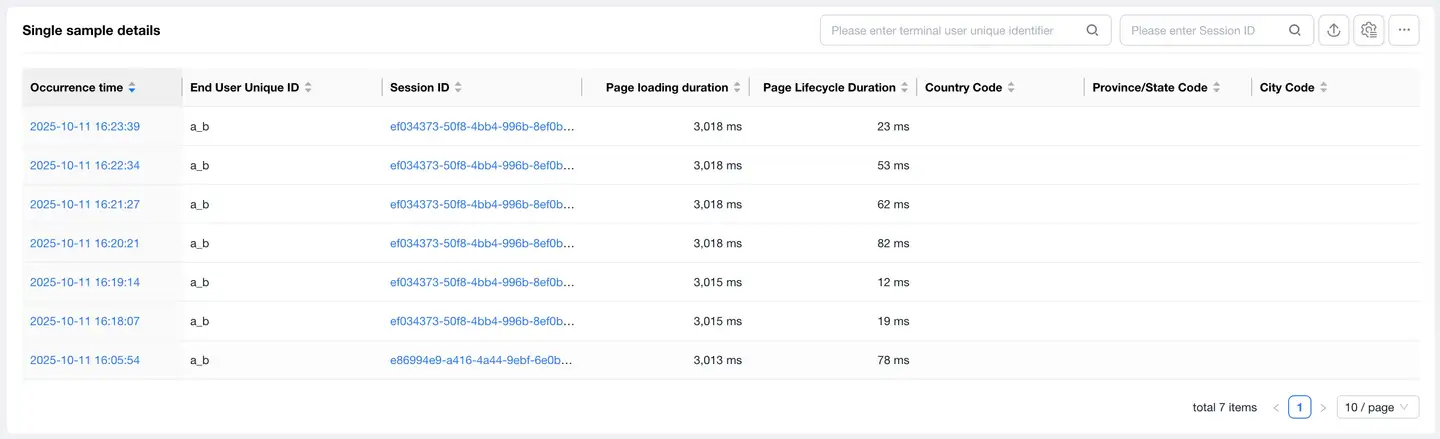
Sample Details
The details list displays all sample details for the selected page.
The list shows data including:
- timestamp "Occurrence Time"
- End User Unique Identifier
- Session ID
- Page Load Duration
- Page Lifecycle Duration
- Country
- Province/State
- City
List features:
- Supports filtering by user ID and session ID
- Supports export
- Supports customizable headers
- Clicking on Session ID navigates to Session Details
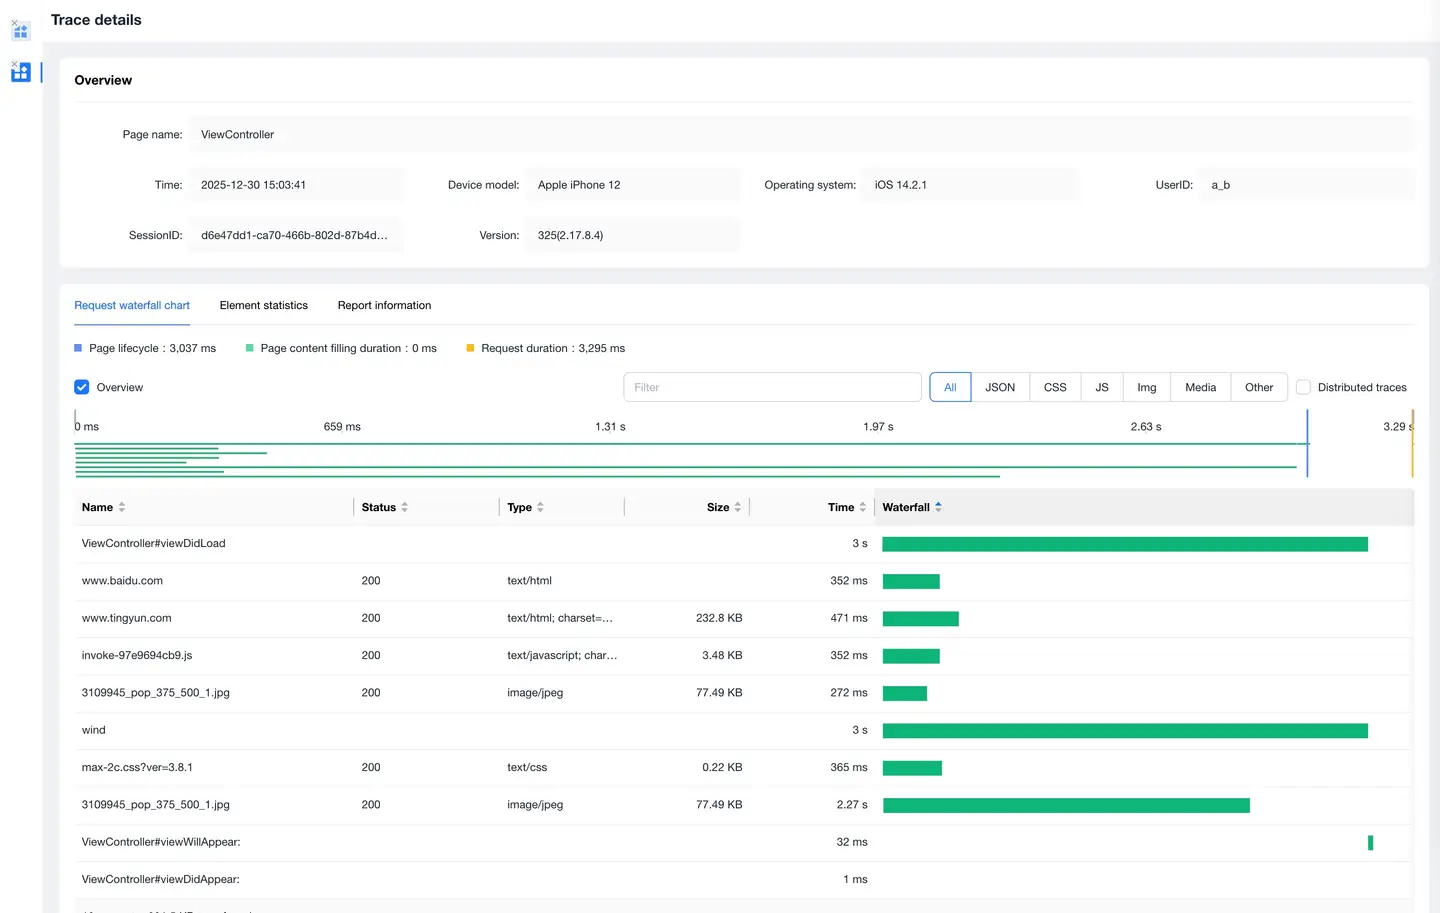
Trace Detail Tracking
Click on the timeStamp in the details list to enter the Trace Detail Tracking page, which displays the request information during page loading.
Includes the following content:
- Request Waterfall: Displays the request information during page loading in a waterfall format, supports filtering by request type, and supports searching request URLs
- Element Statistics: Statistics on request volume and file transfer size by request type and domain name
- Reported Information: Displays the original information of the Trace Detail Tracking