OOM Analysis
OOM Details
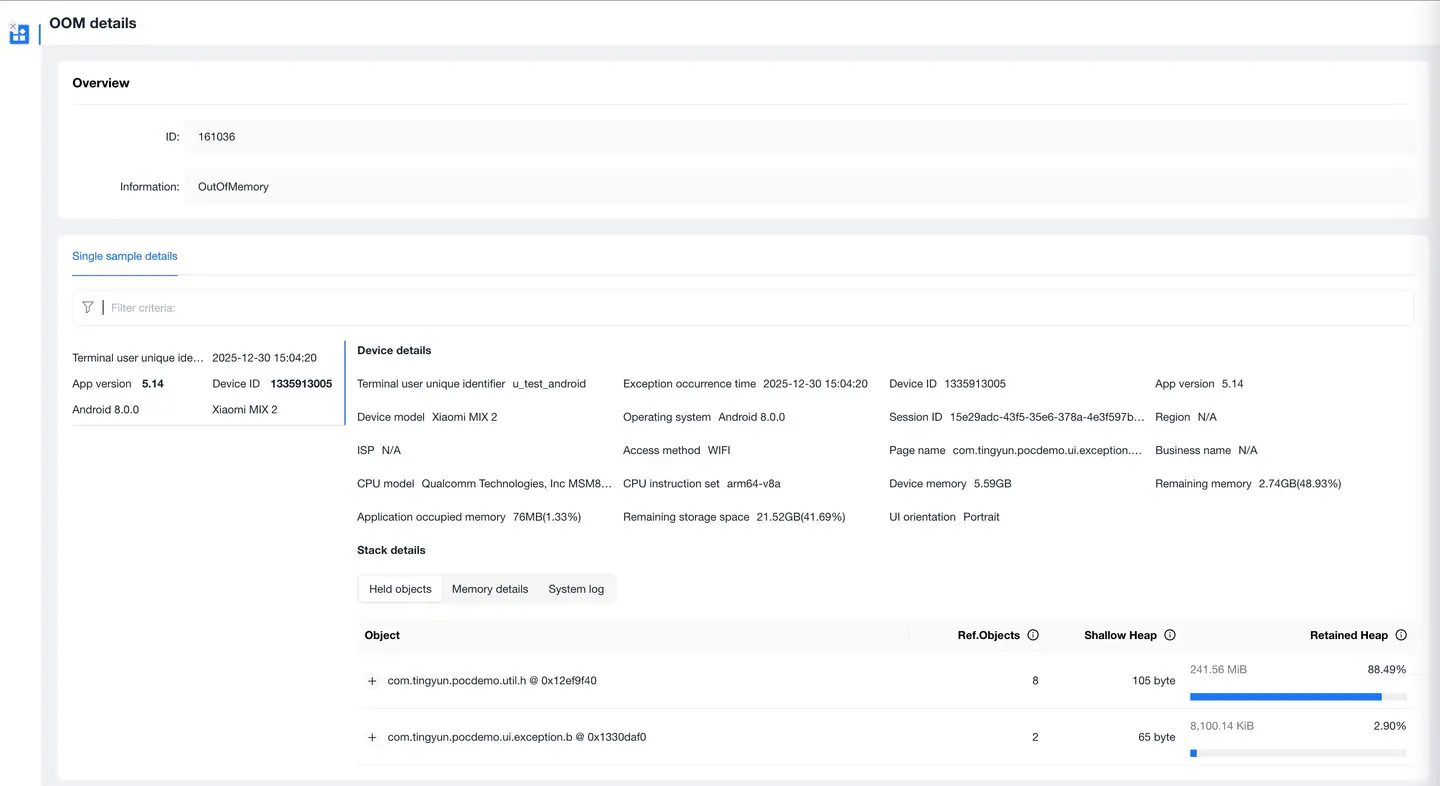
OOM details are the detailed information of OOM exception events occurring on the current device. The details page distinguishes between Android and iOS operating systems.
Note: OOM only supports Java and OC code, including Android, iOS, HarmonyOS 3.0. Android currently does not support non-Java implemented Hybrid applications.
Android System
Environment Information
Includes the following information:
- User ID
- Application launch time
- Exception occurrence time
- Session duration
- DeviceID
- Application version
- Device model
- Operating system
- Region
- Carrier
- Access method
- Device memory
- Application memory usage (percentage)
- Remaining memory (percentage)
- Remaining storage space (percentage)
- CPU model
- CPU instruction set
- UI orientation
Retained Objects (Root Cause Analysis)
First, check the Retained Heap. If the Retained Heap is particularly large while its own Shallow Heap is relatively small, it indicates that held objects have not been released in time. In this case, you need to find which large objects in the corresponding class have not released memory, causing GC to be unable to reclaim memory.
Includes the following metrics:
- Object: Format is "object Class name + memory address" or "object array + memory address"
- Ref.Objects: Number of objects held, only displaying nodes with Shallow Heap greater than 256KB
- Shallow Heap: The size of memory occupied by the object itself
- Retained Heap: The sum of all objects that can be removed from memory by GC after the object is reclaimed by the garbage collector. Retained Heap can more accurately reflect the actual memory size occupied by an object
The page supports jumping to Session Details.
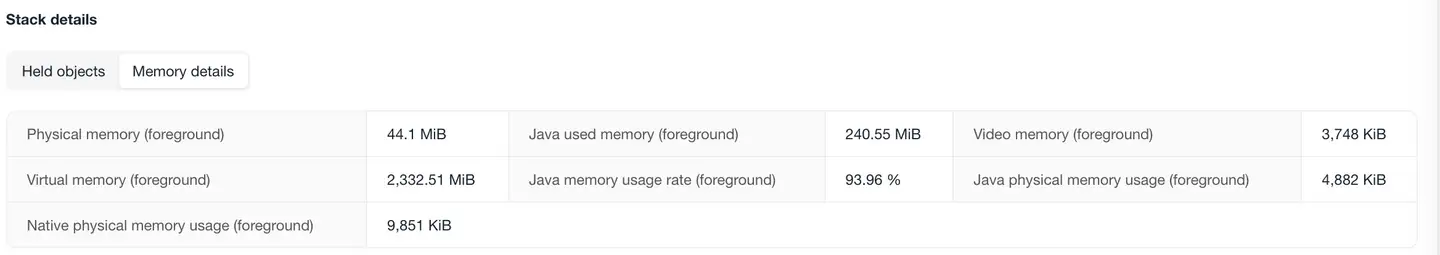
Memory Details
Provides Android device-related memory details, including:
Foreground memory and background memory:
- Physical memory
- Java memory usage
- Video memory
- Virtual memory
- Java memory usage rate
- Java physical memory usage
- Native physical memory usage
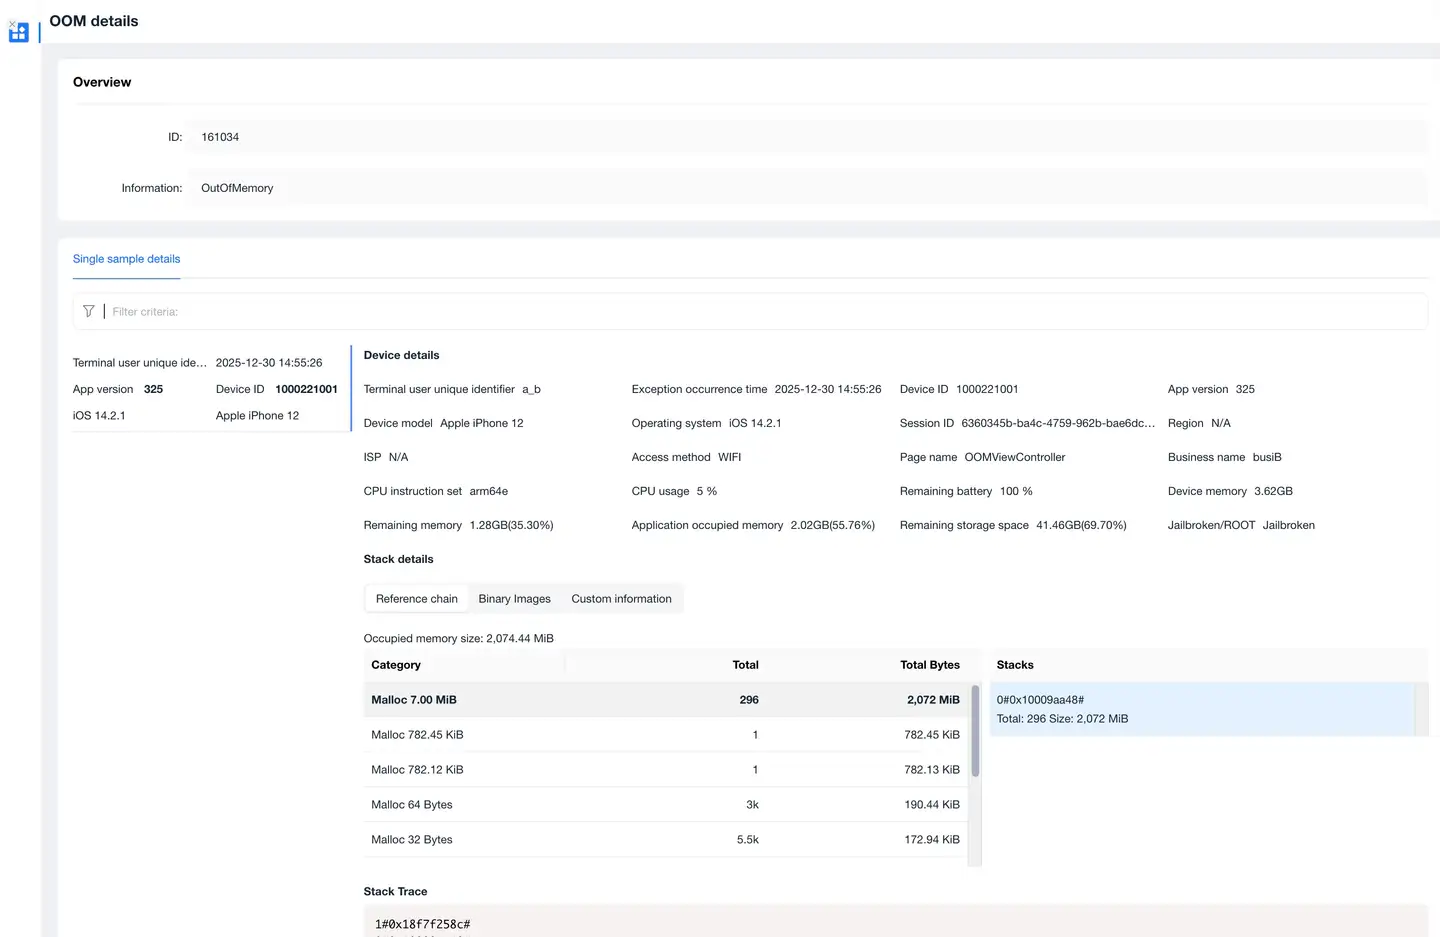
iOS System
Environment Information
Includes the following information:
- User ID
- Application launch time
- Exception occurrence time
- Session duration
- DeviceID
- Application version
- Device model
- Operating system
- Region
- Carrier
- Access method
- Device memory
- Application memory usage (percentage)
- Remaining memory (percentage)
- Remaining storage space (percentage)
- Remaining battery
- CPU instruction set
- CPU usage
- Jailbreak status
Reference Chain (Root Cause Analysis)
Analysis steps:
- Find the most likely category in the reference chain from two perspectives: object count and object memory allocation size
- Select a caller in Stacks and trace back to its parent node to view the reference relationship, finding a possible reference path (you can use Total and Size to determine the occurrence count and size of the currently selected Stacks)
- Check the call stack information at the time of memory allocation in Stacks Trace, then determine which business module has the problem
Includes the following metrics:
- Category: Memory allocation category (may be a specific object name or Malloc allocation memory size)
- Total: Category call count
- Total Bytes: Category memory allocation total size
- Stacks: Caller (may be one or multiple)
- Stacks Trace: Call stack information at the time of memory allocation
The page supports jumping to Session Details.