Network Probing
Function Overview
When users complain, developers or operations personnel often encounter many complex problems, such as:
- Client network quality cannot be measured
- User business logs are too large to obtain
- Local environment is difficult to reproduce issues
- Lack of effective means to investigate such difficult problems
Through a unified dispatch center, real-time data can be collected based on different task types when real users encounter problems. Network probing and log retrieval are two methods that help development and operations personnel obtain first-hand data promptly, improving troubleshooting efficiency.
Feature Introduction
A fault root cause location tool provided for operations personnel, offering network probing services for real users to help operations personnel understand real users' network environments. Mobile SDK can execute specific tasks based on different scenarios and dimensions for network probing, CDN selection comparison, etc.
Main Functions
- Execute TCP Ping tasks for specific scenarios
- Execute ICMP Ping tasks for specific scenarios
- Execute MTR tasks for specific scenarios
- Execute single file download tasks for specific scenarios
- Automatically collect Server IP
- Automatically collect packet loss rate and network latency data
- Automatically collect CNAME to obtain CDN vendor information
Note: SDK cannot obtain the Server IP of domain name requests. Now, through network probing, it can accurately obtain the Server IP address while collecting the domain's CNAME information and performance metrics. After enabling the network probing switch, SDK will execute the Ping command three times for domains requested by the application within the current minute to obtain Server IP, CNAME, and performance data.
Use Cases
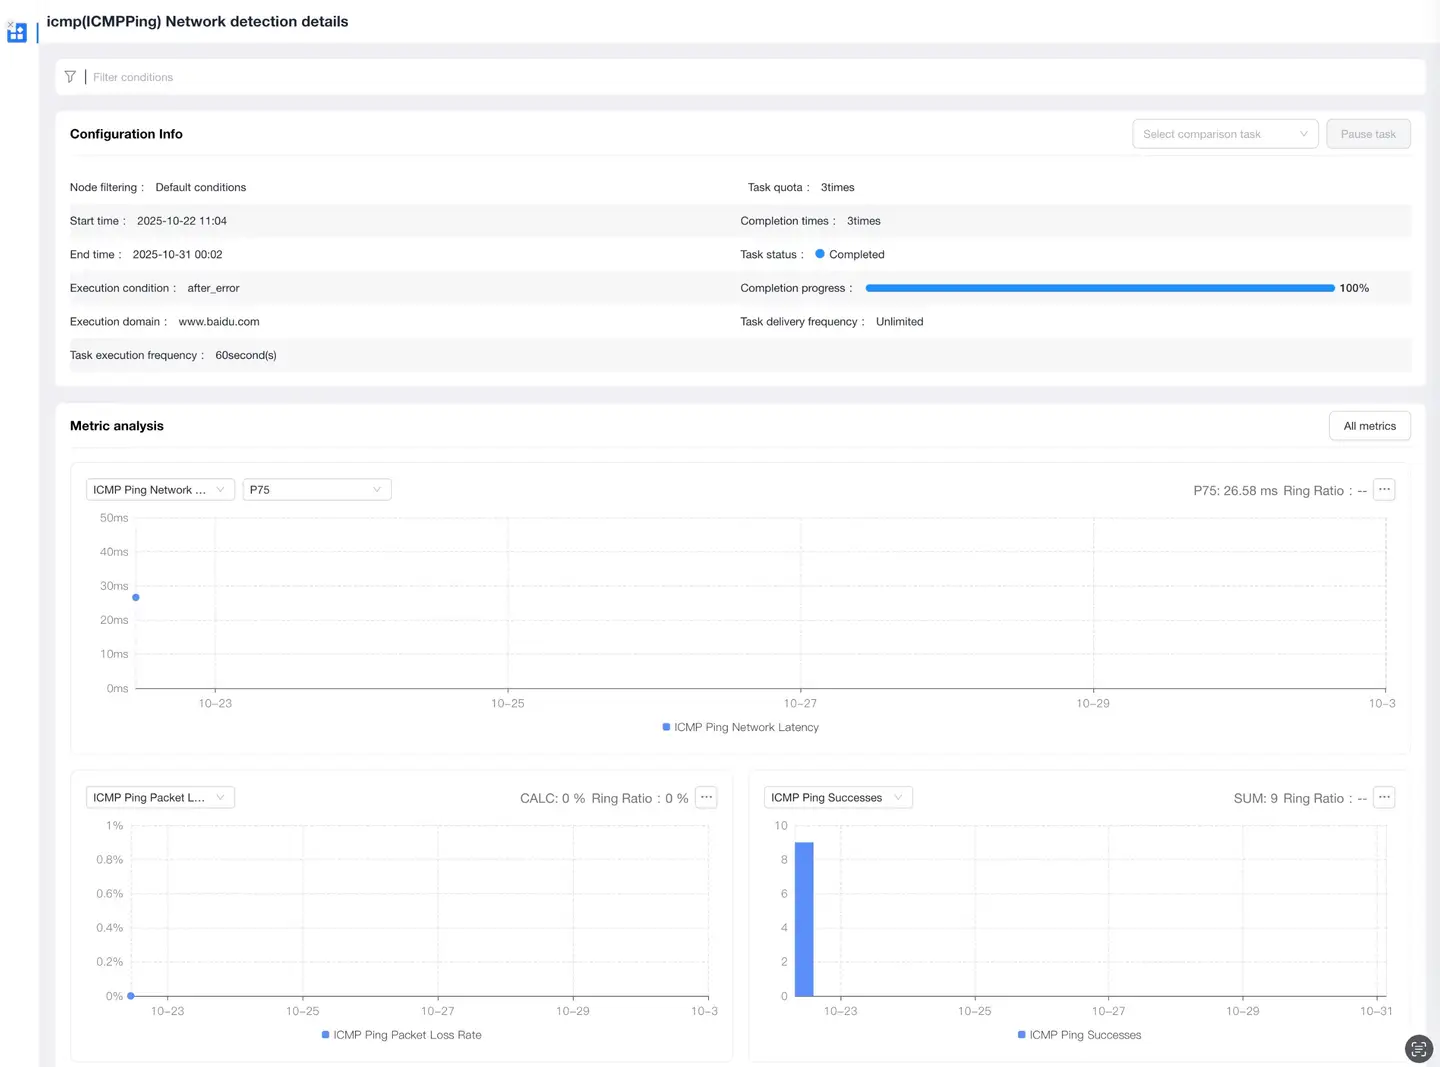
Network Error Diagnosis
Through "TCP Ping/ICMP Ping" tasks, a Ping command can be executed for the error domain after a request error occurs, obtaining current network latency and packet loss rate to determine if the error is caused by poor client network environment.
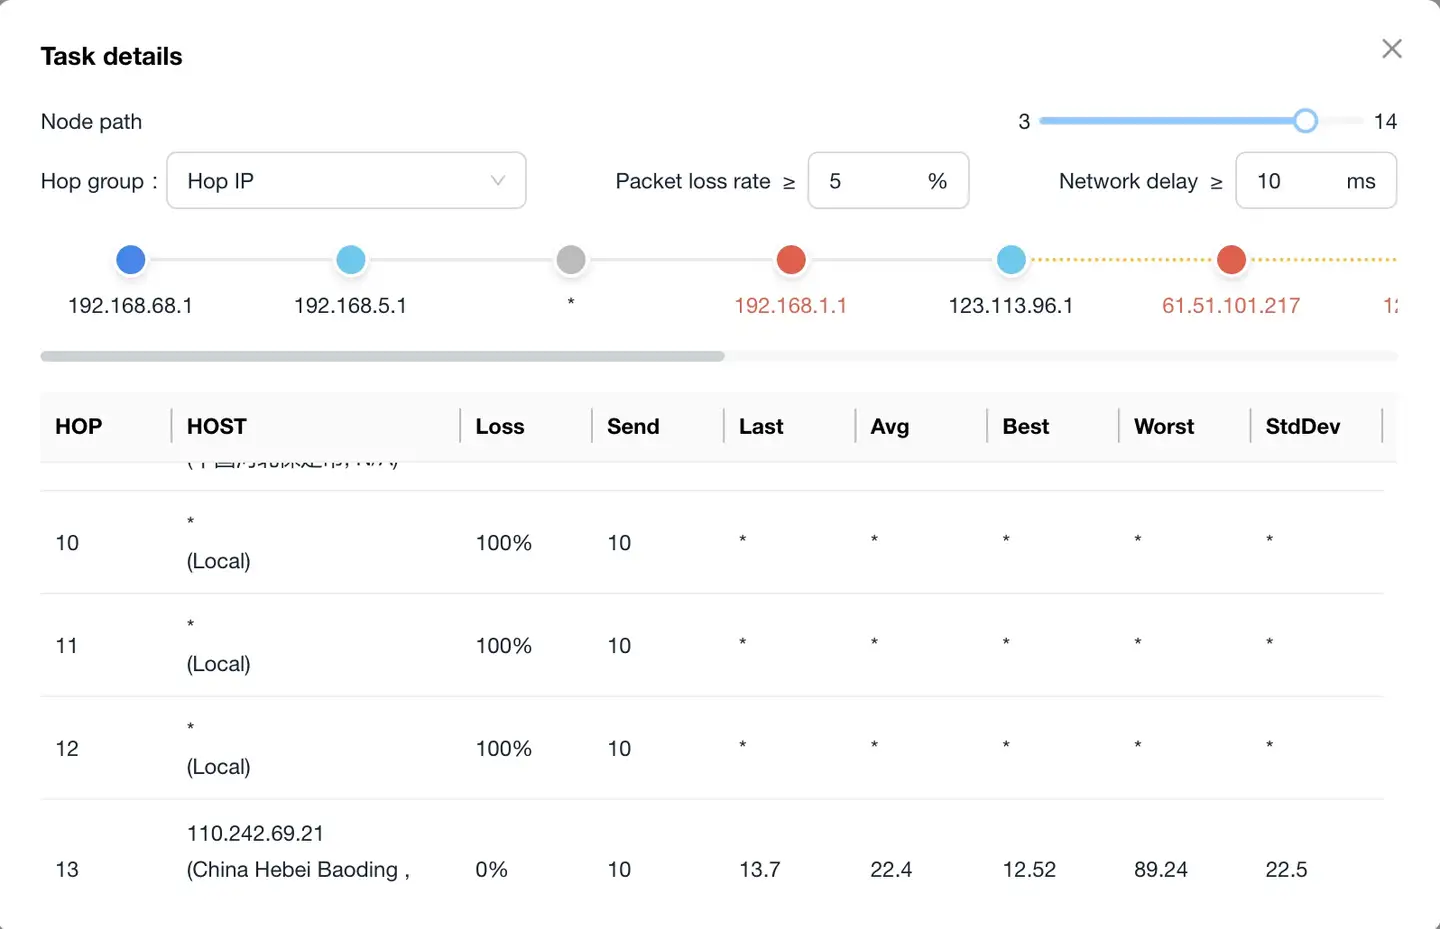
Network Link Quality Analysis
Through "MTR" tasks, more comprehensive network diagnostic information can be obtained in real-time. Operations personnel can:
- Diagnose and isolate network errors experienced by real users in real-time
- Provide reports on network status to carriers
When analyzing MTR data, two metrics need attention:
- Packet loss rate
- Latency
Note: If a certain percentage of loss is observed at any specific hop, this may indicate a problem with that particular router.
CDN Selection Comparison
Through "Single File Download" tasks, you can:
- Probe the acceleration effect of the same resource under different CDN vendors for the same dimensions
- Provide task comparison functionality
- View detailed performance data for each node
Function Configuration
Switch Settings
This function is controlled by the Network Probing switch:
- Select Global Settings in the navigation bar
- Click the Security Settings tab
- Enter the Security Settings page
- Check the network probing switch status (enabled by default)
Note: If the "Network Probing" switch is turned off, tasks cannot be executed.

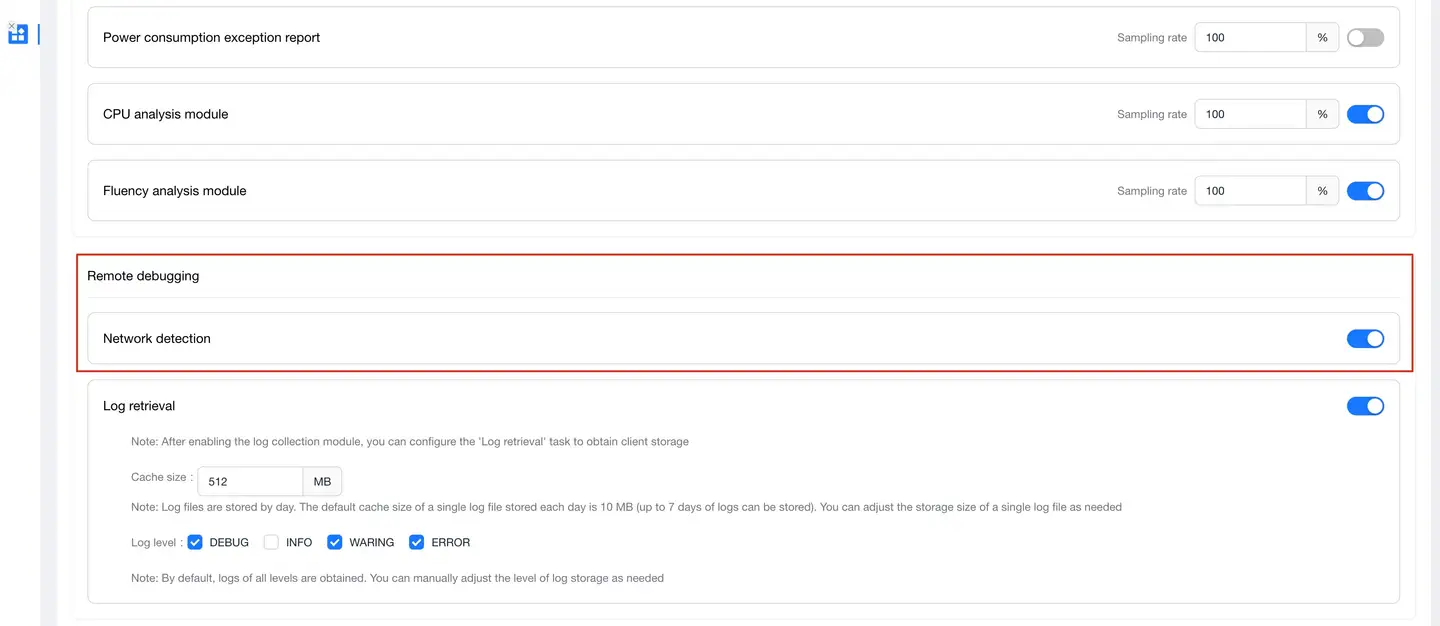
Task Management
Select Remote Debugging > Network Probing in the navigation bar to enter the Probing Task Overview page.
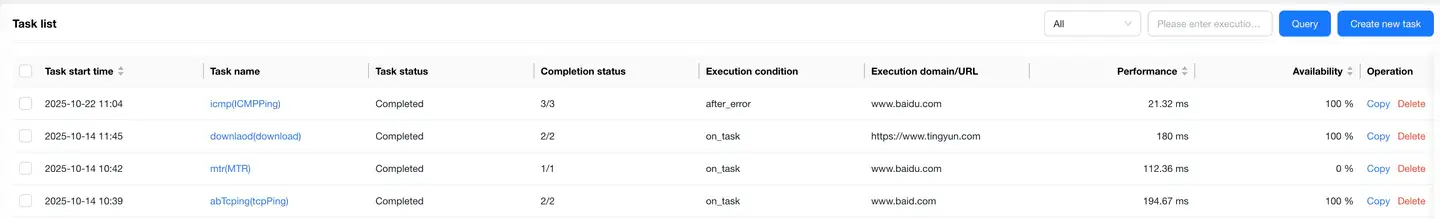
Task List
Supports the following functions:
- Filter list by task status
- Query list by execution domain/URL
List display content:
-
Task Start Time: The time when the current task began to be dispatched
-
Task Name: The task name added when creating a new task
-
Task Status:
- Executing: The current task is in execution state
- Incomplete: The current task execution points are greater than the remaining task points
- Completed: The current task has been fully executed
- Paused: The current task can be paused in the task details page
-
Completion Status: Shows the current executed tasks and current configured tasks
-
Execution Conditions:
- Execute Immediately: After SDK receives the dispatched task, it immediately executes a probing task for the "task domain"
- Execute After Request Completion: After SDK receives the dispatched task, it executes the probing task after the application completes accessing the "condition domain"
- Execute After Request Error: After SDK receives the dispatched task, it executes the probing task after an error occurs when the application accesses the "condition domain"
-
Execution Domain/URL:
- Ping Task (TCP Ping/ICMP Ping): Execution domain
- MTR Task: Execution domain
- Single File Download Task: URL
-
Performance Metrics:
- Ping Task (TCP Ping/ICMP Ping): Network latency
- MTR Task: Network latency, jitter, hop count
- Single File Download Task: Response time
-
Availability Metrics:
- Ping Task (TCP Ping/ICMP Ping): Packet loss rate
- MTR Task: Packet loss rate
- Single File Download Task: 1-(Error task count/Total task count)
-
Operation Options:
- Copy: Copy a current task, need to re-enter execution time and execution count