Launch Analysis
The launch analysis function can monitor the cold/hot launch performance of online applications in real-time, helping developers quickly locate problems and optimize user experience.
Filter Conditions
You can filter by device name, device model, App version, operating system, operating system major version, region, carrier, and access method.
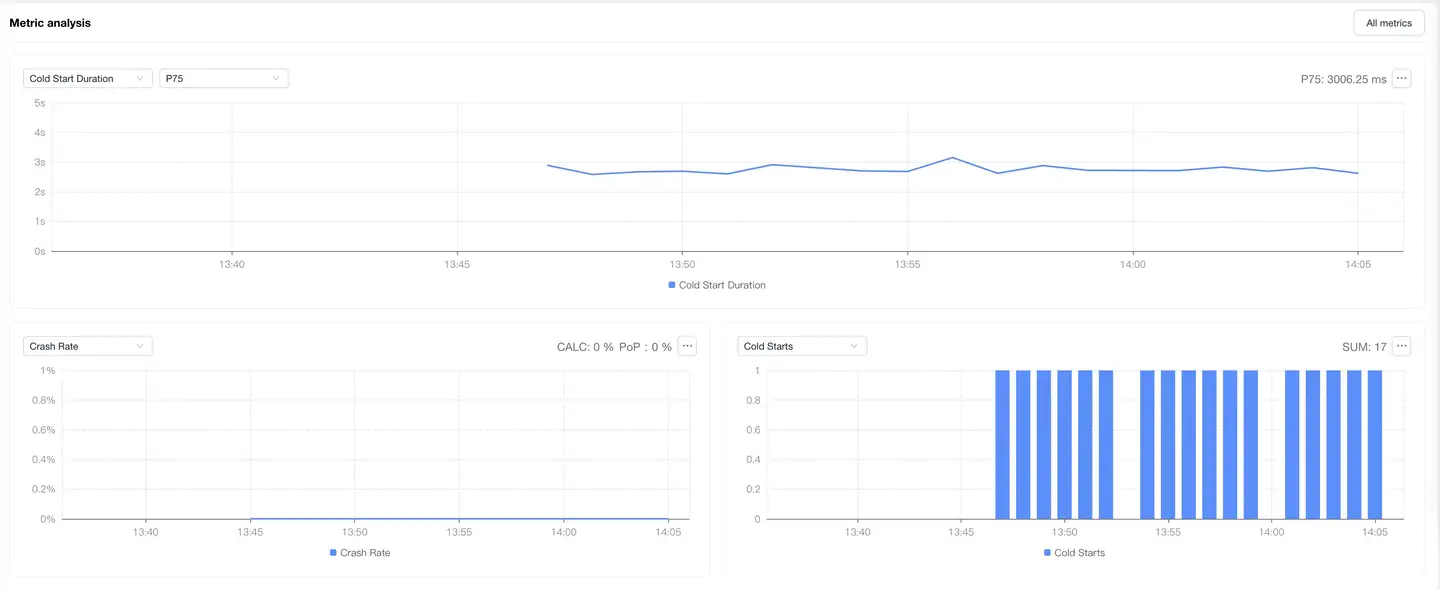
Metric Analysis
Displays the trend chart of application launch performance metrics under filter conditions. You can filter and analyze performance metrics according to your needs. Time-consuming performance metrics support AVG, P50, P75, P95, P99 value analysis, with P75 value displayed by default.
Dimension Analysis
Displays the distribution of application launch performance by region. The map can be drilled down to province/state level. After map drill-down, the corresponding region will be added to the filter conditions, and all modules on the page will display performance data after filtering. You can select launch performance metrics on the left to analyze their performance in different regions. The list supports custom headers.
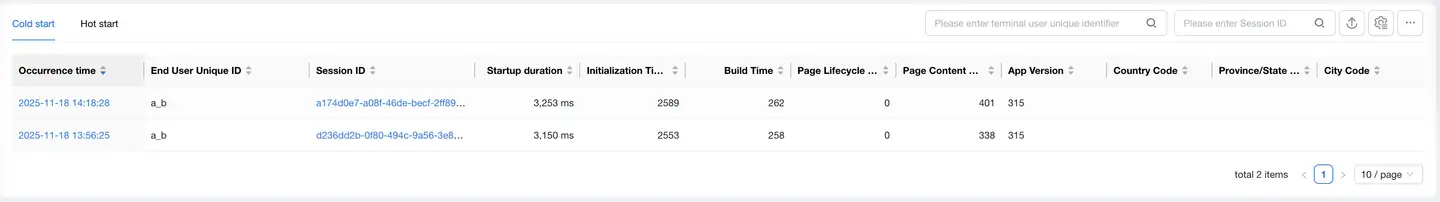
Launch List
The launch list displays single sample data for cold starts and hot starts. The list displays data such as timestamp, end user unique identifier, session ID, launch time, App version, etc. The list supports filtering by user ID and session ID, supports export, and supports custom headers. Click Session ID to jump to Session Details.
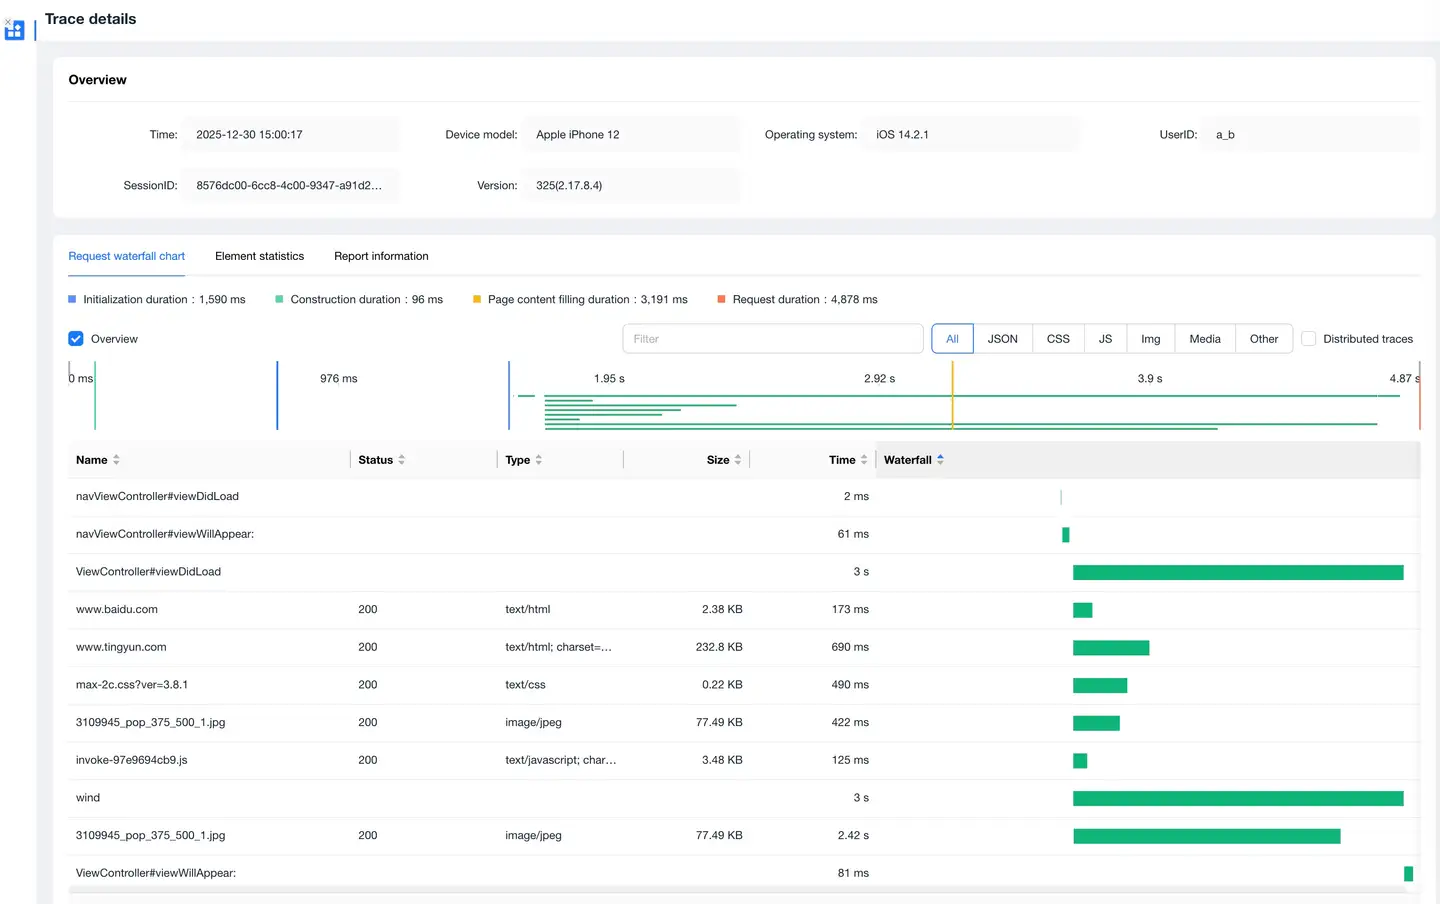
Trace Detail Tracking
Click timeStamp in the details list to enter the Trace Detail Tracking page, which displays the request information during the application launch process.
-
Request Waterfall Chart
Displays request information during application launch in waterfall chart form, supports filtering by request type, and supports searching request URLs.
-
Element Statistics
Statistics on request volume and file transfer size by request type and domain name.
-
Reported Information
Displays the original information of this Trace Detail Tracking.