Application Settings
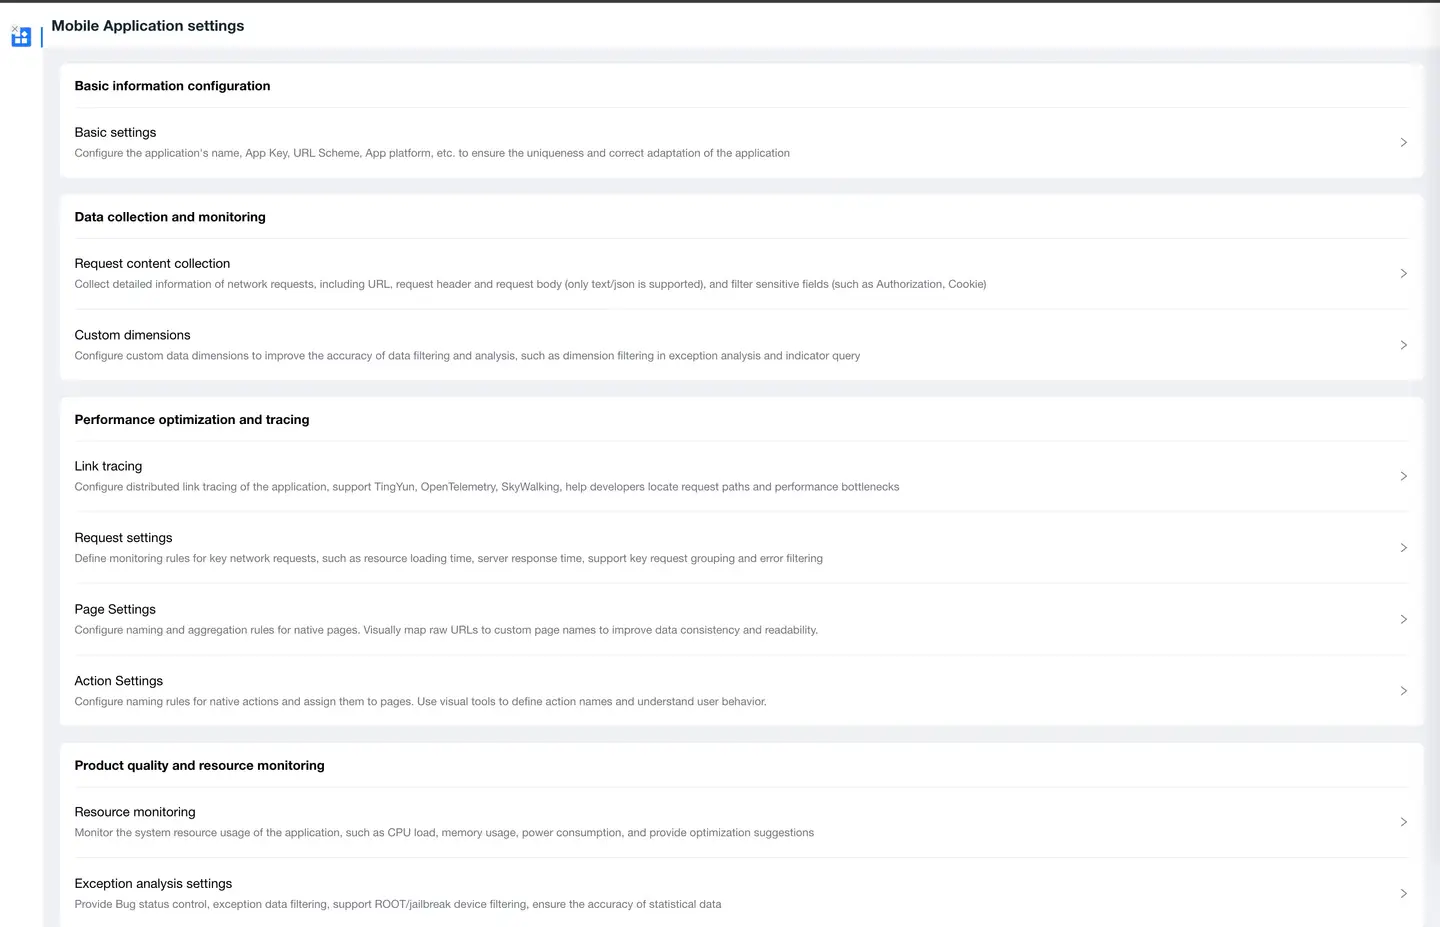
To facilitate developers in setting up application functions, the terminal application provides two setting methods: "Global Settings" and "Application Settings".
- Global Configuration: Universal settings that adapt to all applications can be configured directly in "Global Settings". Once configured, they take effect by enabling the [Use Global Configuration] switch in the application.
- Application Settings: Settings that adapt to a single application can be configured in "Application Settings".
Basic Information Settings
To enable the platform to automatically distinguish between your own services and third-party services, you can configure your own services by entering the service's IP address or domain name. You can also use global configuration, which will override the current application configuration. Your own services refer to services provided by your own application. Third-party services are domains other than your own services.
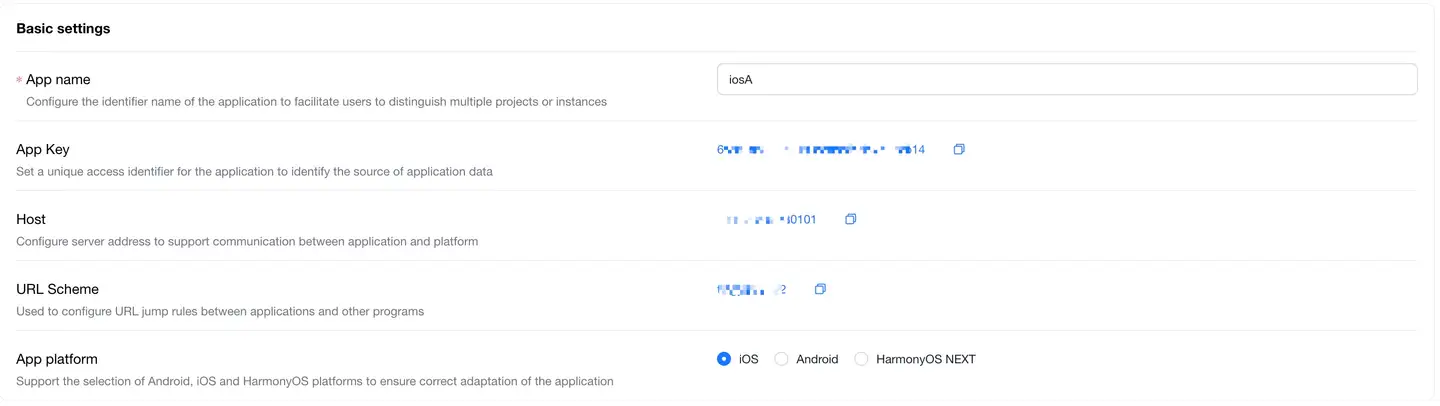
- The application name can be customized, but the generated App Key is fixed and cannot be modified.
- Both host and URL Scheme are provided for convenience when deploying the SDK.
- App platform supports iOS and Android selection.
- After completion, please click the Save Settings button for the configuration to take effect.
- You can enable the view SDK deployment instructions switch in the report to view deployment instructions.
Data Collection and Monitoring
Blacklist and Whitelist Settings
Blacklist Settings can control the collection of URL request data that meets specific conditions. There are three filtering methods: No Filtering, Whitelist Filtering, and Blacklist Filtering. The default is No Filtering.

-
Setting Description
- No Filtering: The SDK collects all URL request data.
- Whitelist Filtering: The SDK only collects URL request data in the whitelist.
- Blacklist Filtering: The SDK collects all URL request data except those in the blacklist.
-
Configuration Rules
- You can enter a regular URL or regular expression. Regular expressions should start and end with a forward slash. For example: To filter the qq.com domain, configure /.qq.com/.
Custom Dimensions
First, configure custom information upload through the SDK API to upload custom dimensions, then set the dimension whitelist. This allows you to filter custom dimensions in App exception analysis and metric queries.
Note: Using general configuration will override the current application configuration.
Performance Optimization and Tracking
Call Chain Tracking Settings
For users using third-party APM server monitoring, after configuring the request headers and jump addresses of the third-party APM, the SDK will add the set request headers to each request and generate a UUID, enabling call chain tracking analysis from the Guanyun platform to the third-party APM.
To configure call chain tracking for the current application, follow the same steps as the general configuration. For details, see Call Chain Tracking General Configuration. After enabling the Use Platform General Configuration switch, the platform general configuration will override the current application's call chain tracking configuration.
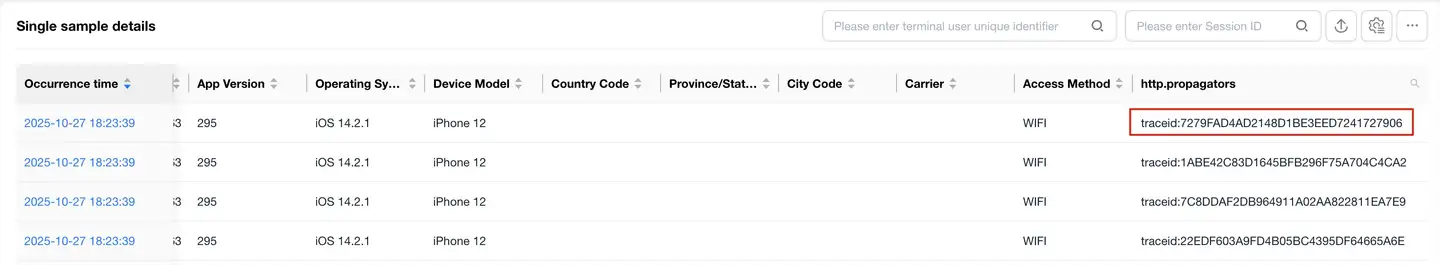
The added request header data will be displayed in the following interfaces.
-
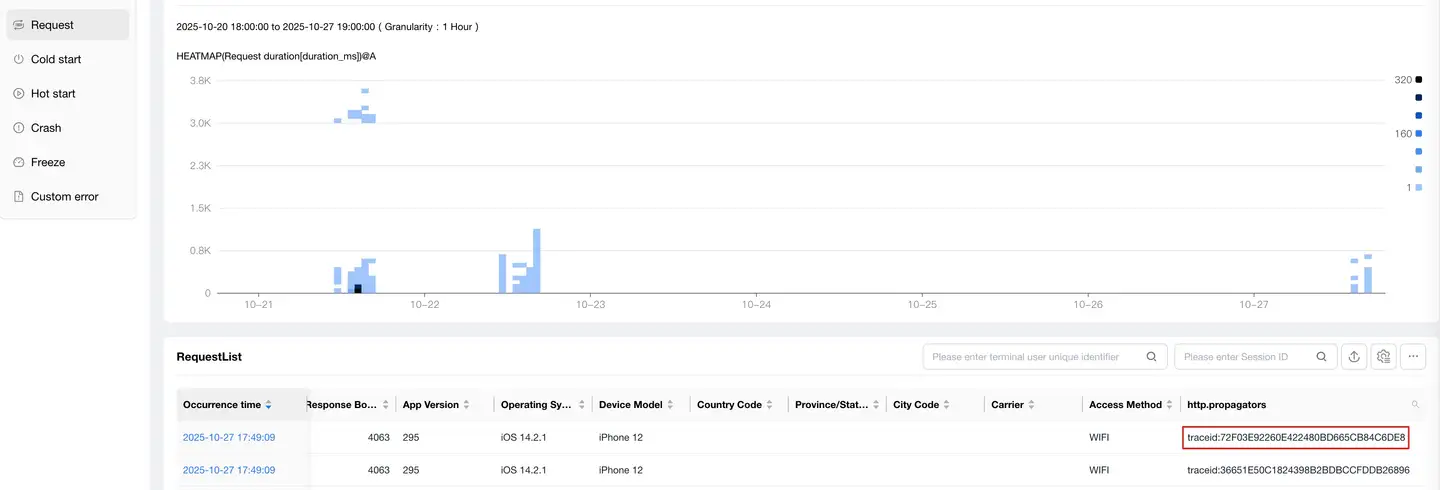
Network Analysis > Slow Request List > Detail List > TraceID
-
User Tracking > Slow Requests > TraceID
-
User Experience > Startup Experience/Page Experience/Action Experience > Exception Statistics and Tracking > Breakdown Chart > Network Requests > TraceID
Link Tracking
Link Tracking Vendor Configuration�
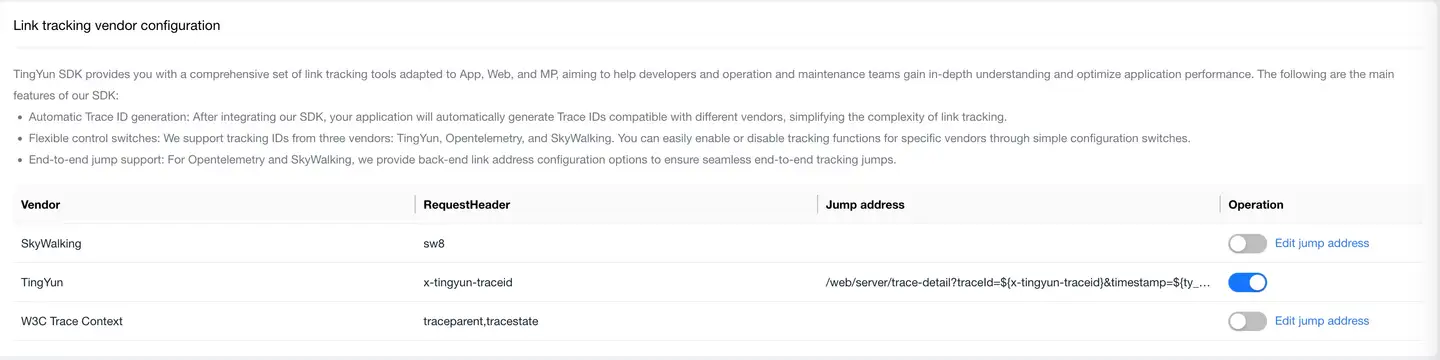
TingYun SDK provides you with a comprehensive set of link tracking tools adapted for App, Web, and MP, designed to help developers and operations teams deeply understand and optimize application performance. Here are the main features of our SDK:
- Automatic Trace ID Generation: After integrating our SDK, your application will automatically generate Trace IDs compatible with different vendors, simplifying the complexity of link tracking.
- Flexible Control Switches: We support tracking IDs from three vendors: TingYun, Opentelemetry, and SkyWalking. You can easily enable or disable tracking functions for specific vendors through simple configuration switches.
- End-to-End Jump Support: For Opentelemetry and SkyWalking, we provide backend link address configuration options to ensure seamless end-to-end tracking jumps.
Custom Link Tracking Configuration
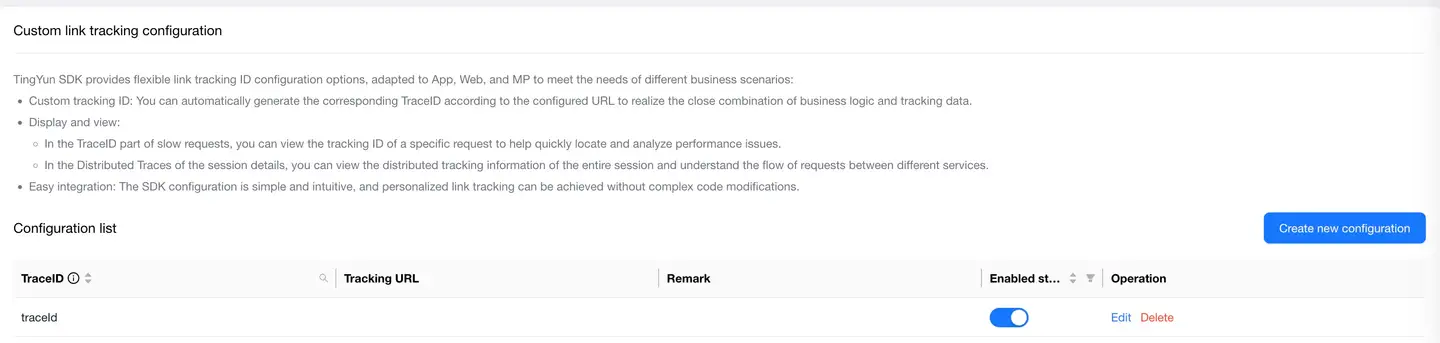
TingYun SDK provides flexible link tracking ID configuration options for App, Web, and MP to meet the needs of different business scenarios:
-
Custom Tracking ID: You can automatically generate corresponding TraceIDs based on configured URLs, achieving tight integration between business logic and tracking data.
-
Display and View:
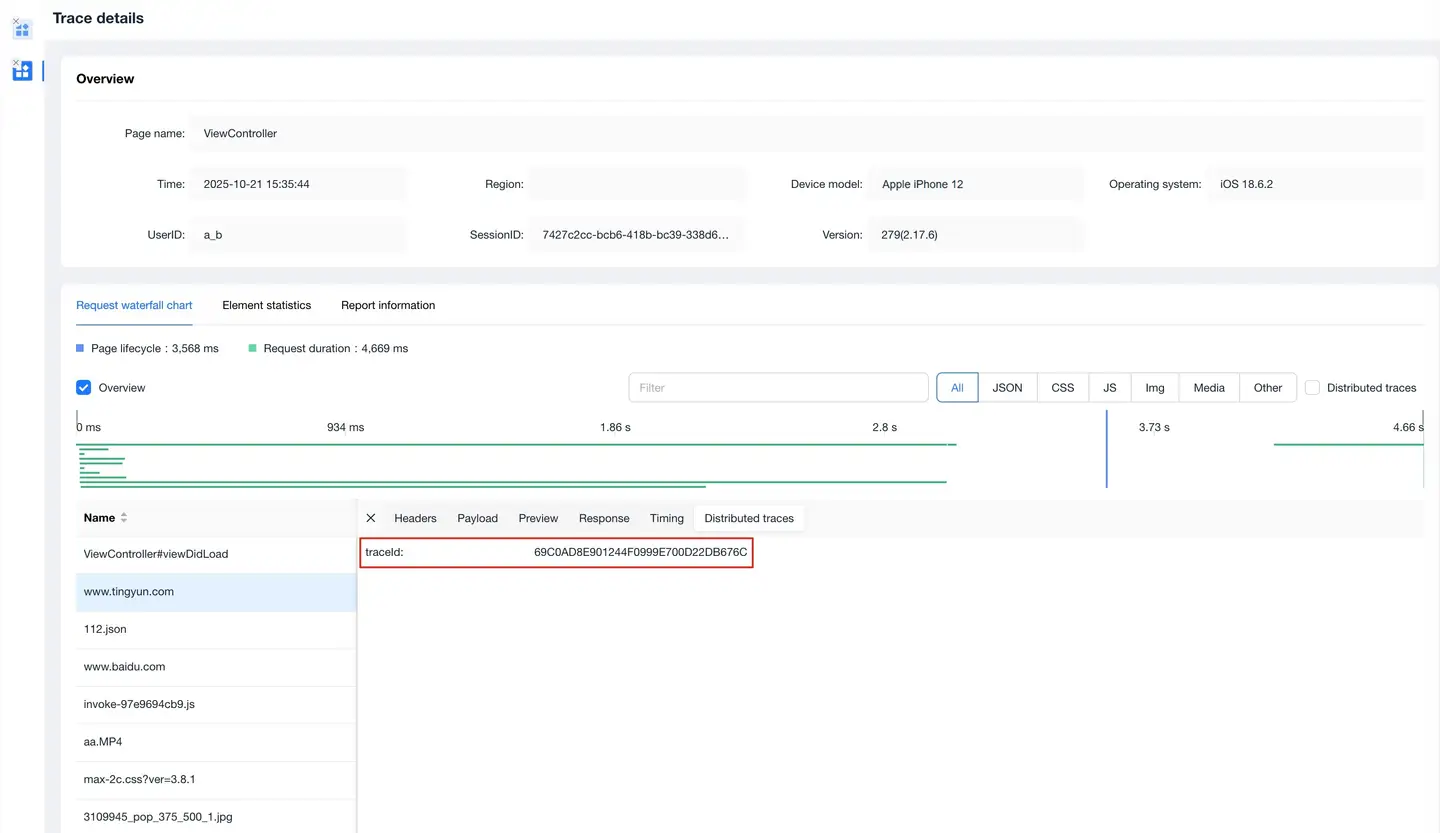
- In the TraceID section of slow requests, you can view the tracking ID for specific requests, helping to quickly locate and analyze performance issues.
- In the Distributed Traces of session details, you can view distributed tracking information for the entire session, understanding how requests flow between different services.
-
Easy Integration: The SDK configuration is simple and intuitive, requiring no complex code modifications to achieve personalized link tracking.
Request Settings
On the Request Settings page, users can make the following settings:
- Add key requests, adding aliases to specified URLs.
- Group requests to build hierarchical relationships.
- Add custom aggregation rules for application requests.
- Collect request parameters.
- Set request blacklists and whitelists.
- Set request error filtering conditions.
After completion, please click the Save All Settings button for the configuration to take effect.
Key Request Settings
The key request setting switch is off by default.
Click the Add Key Request button, enter the complete URL and request alias, then click Confirm to add a key request. The alias supports up to 128 characters, including Chinese and English characters, but not special characters.
In the dropdown menu before the search box, you can switch between searching by URL and by Alias for key requests.

Click the Batch Add button in the upper right corner to batch import URLs and aliases through a CSV template. When uploading files, a single file cannot exceed 500KB and must be in CSV format.
Click the Export List button in the upper right corner to export the key request list data to local storage.
Check the checkboxes in front of multiple key requests, then click the Batch Delete button in the upper right corner to batch delete key requests.
Request Group Settings
The request group setting switch is off by default.
Click the Add Key Group button and enter a group name. The name supports up to 128 characters, including Chinese and English characters, but not special characters.
When selecting Specify URL, expand the host in the left list to select requests, or directly check the checkbox in front of the host to select all requests under the host. Click the right triangle icon in the middle to add them to the right list. The request list only shows interfaces, not aggregated URIs such as /*.jpg, and by default displays the top 2000 URLs by throughput in the last seven days.
If you cannot find the request you want to add to the group in the specified URL, you can add it using the "Wildcard Matching" method. The configuration method is as follows:
- Select Wildcard Matching.
- Fill in the rule in the "Wildcard Rule" input box. For an introduction to wildcards, please refer to the product interface instructions.
- Enter the URL that needs to be matched according to the wildcard in "Text to Match".
- In "Match Result", the "Text to Match" will be automatically verified against the "Wildcard Rule" to see if it can be matched normally.
- Click Confirm to save the group.
Request Aggregation Settings
Request Aggregation Settings allows you to add custom request aggregation rules (such as interfaces carrying specific URL parameters) and supports adding corresponding URL parameters for interfaces. The system uses a regular aggregation rule by default when aggregating page URLs, paths, and request URLs. In addition to regular aggregation, custom aggregation rules can also be used. The request aggregation setting switch is off by default.
The functions of custom aggregation rules are as follows:
- Can split URLs that are aggregated by default according to business requirements.
- Can merge URLs that are separated by default according to business requirements.
- Can split parameters spliced on URLs according to business requirements.
- Can split parameters of request headers/request bodies according to business requirements.
Usage method:
-
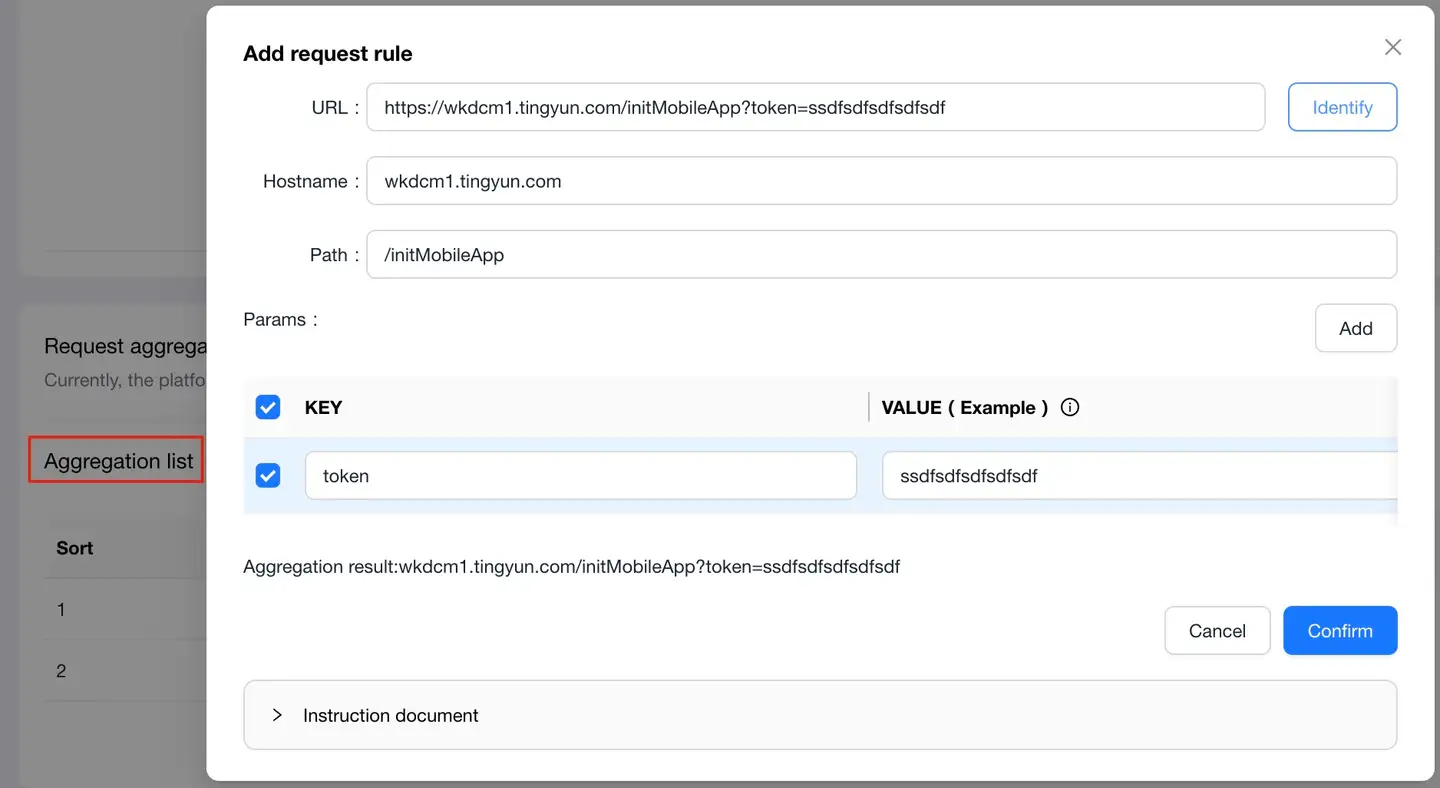
Click the Add Request Rule button, enter the URL or path that needs to adjust the aggregation rule in the URL input box, and click Identify.
-
The system will automatically split the URL or path into hostname, path, and parameters, and will generate several aggregation methods to choose from. You can also make secondary modifications to the rules in the text box. After modification, you can view the final aggregation result below.
- Hostname: Ignores the protocol header by default, can be modified.
- Path: If there are random numbers in the path, the platform will automatically replace the random numbers with "*", which can be modified.
- Params: Check the parameters that need to be appended after the URI, supporting wildcards.
-
Click OK to save.
After selecting a domain name in "Network Requests --> Request Analysis", view the request list. The platform will append the configured URL parameters to the URI, as shown below:

Request Error Filtering
After the Request Error Filtering switch is turned on, error data that meets the conditions will not be recorded, including error count, error tracking information, etc. It is off by default.
Click the Add IP Setting button, configure the URL to filter and the error response code. You can enter a regular URL or regular expression. Regular expressions should start and end with a forward slash. For example: To filter the qq.com domain, configure /.*qq.com*/.

After completion, please click the Save Settings button for the configuration to take effect.
User Experience Evaluation

Threshold Settings
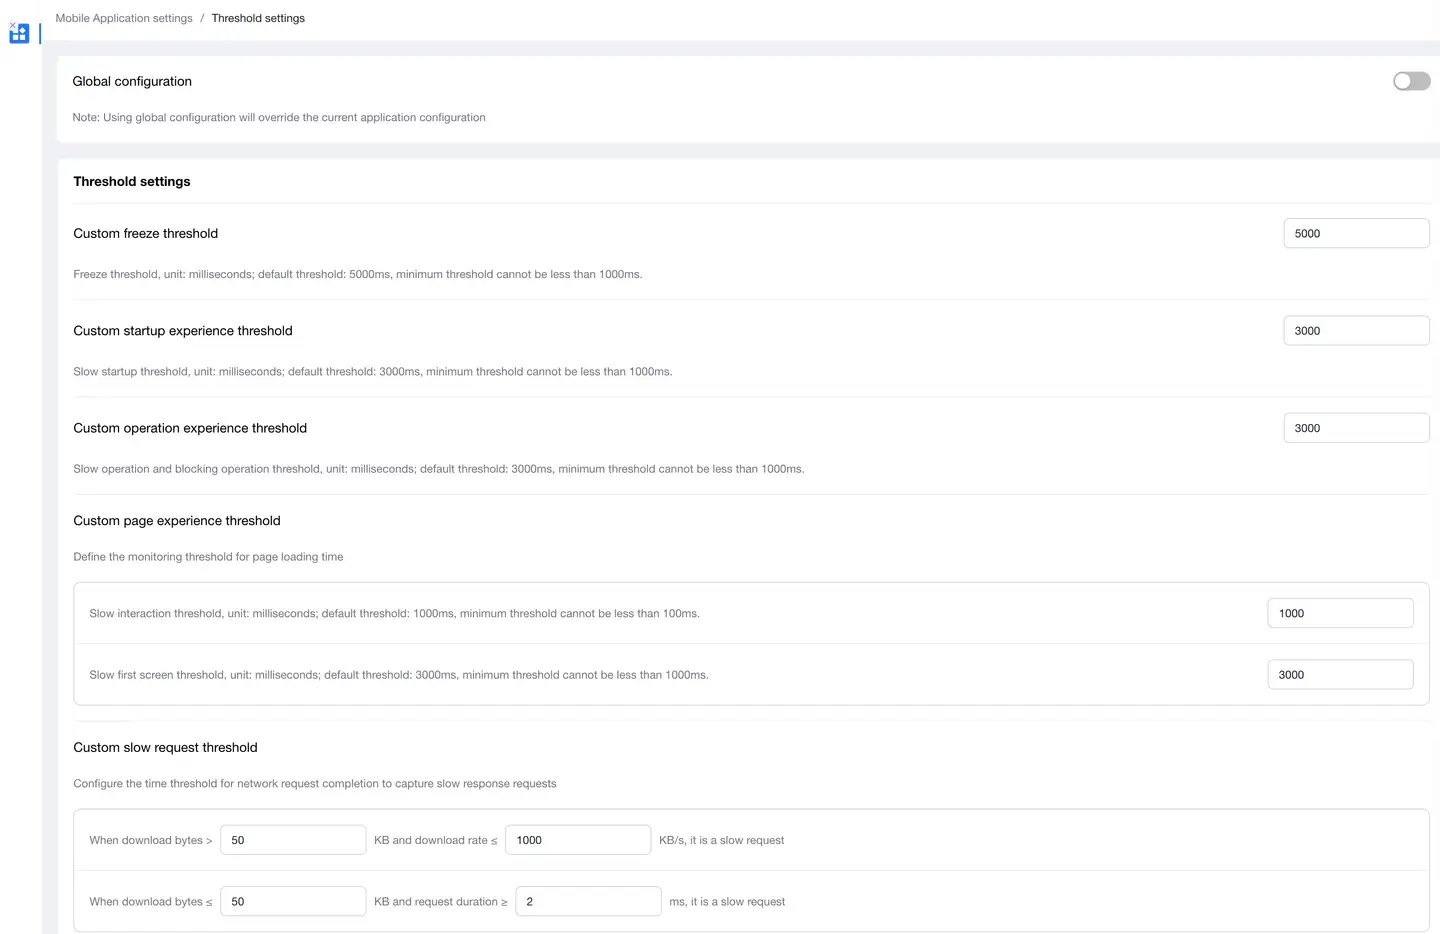
Threshold Settings allows you to customize the slow thresholds for various metrics. The platform will store sample data based on the corresponding thresholds.
-
Configuration Description
- Maximum Crash Trace Collection Count: Refers to the number of steps to trace back from the page where the crash occurred. Select from the dropdown list, including 20, 50, 80, 100, No Limit, and Disable Crash Trace Collection. The default is 20.
- Freeze Threshold: The threshold for determining when an application freezes, in milliseconds. Default threshold: 5000ms, minimum threshold cannot be lower than 1000ms.
- Startup Experience Threshold: Slow startup threshold, in milliseconds. Default threshold: 3000ms, minimum threshold cannot be lower than 1000ms.
- Action Experience Threshold: Slow action and blocking action threshold, in milliseconds. Default threshold: 3000ms, minimum threshold cannot be lower than 1000ms.
- Page Experience Threshold: Two thresholds can be set.
- Slow Interactive Threshold, in milliseconds. Default threshold: 1000ms, minimum threshold cannot be lower than 100ms. When an interaction exceeds the set threshold, the system will record the complete tracking process of that interaction for analysis and optimization.
- Slow First Screen Threshold, in milliseconds. Default threshold: 3000ms, minimum threshold cannot be lower than 1000ms.
- Slow Request Threshold: Two constraint conditions can be configured: download bytes and download rate.
- By default, when the download bytes are greater than 50 KB and the download rate is less than or equal to 50 KB/s, it is judged as a slow request.
- By default, when the download bytes are less than or equal to 50 KB and the request duration is greater than or equal to 2000 ms, it is judged as a slow request.
-
After completion, please click the Save Settings button for the configuration to take effect.
Score Settings
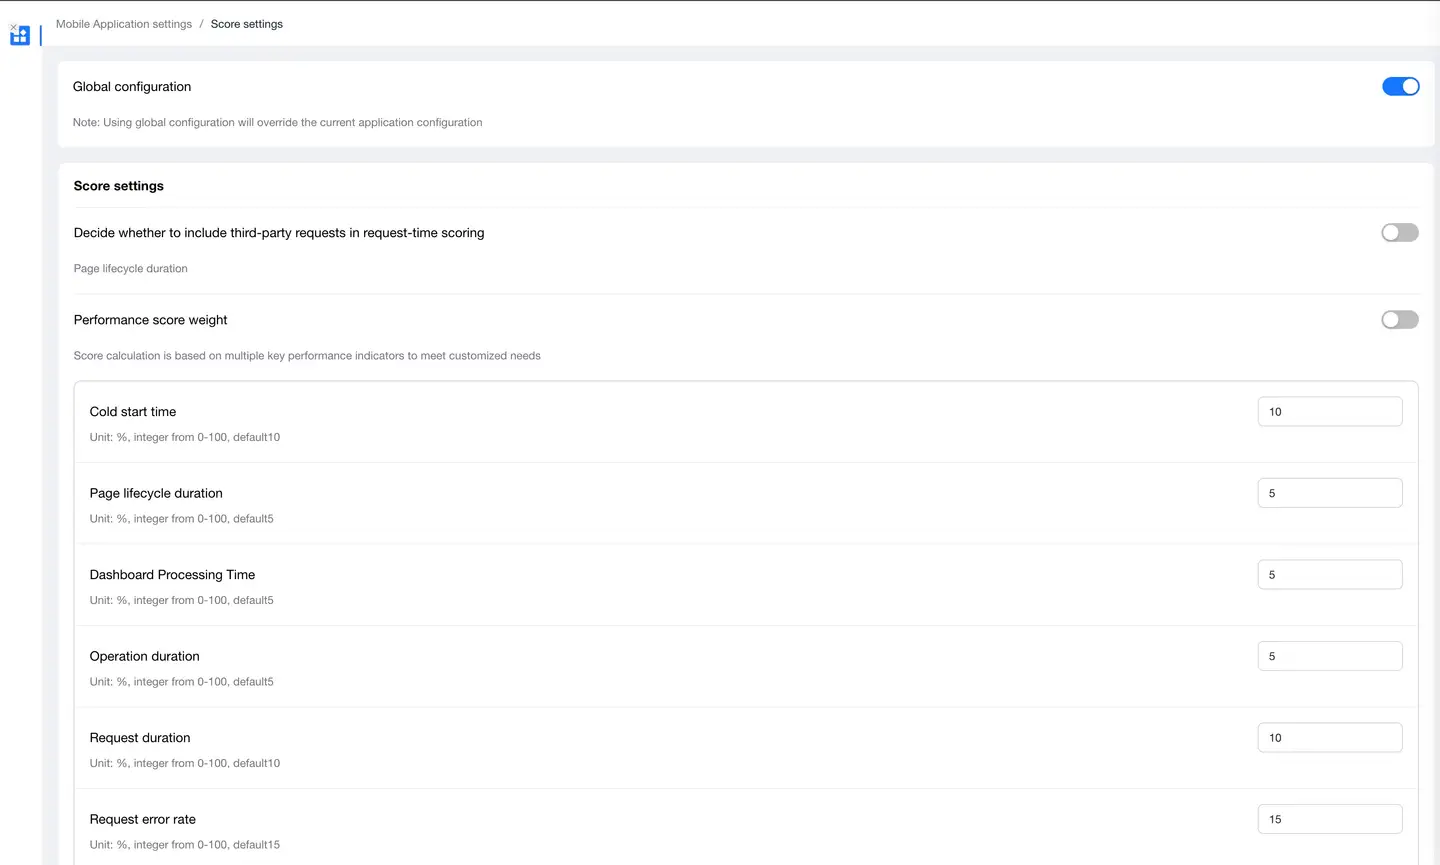
Score settings are used to quantify and measure user experience of applications in the form of scores.
Performance Score Weights
The default performance score weights are: startup time 10%, interactive time 5%, first screen time 5%, operation time 5%, request response time 10%, request error 15%, crash rate 30%, and freeze rate 20%. You can increase or decrease the scoring weight of a certain metric as needed. After setting the weights, continue to set the low threshold, baseline threshold, and high threshold for each metric.
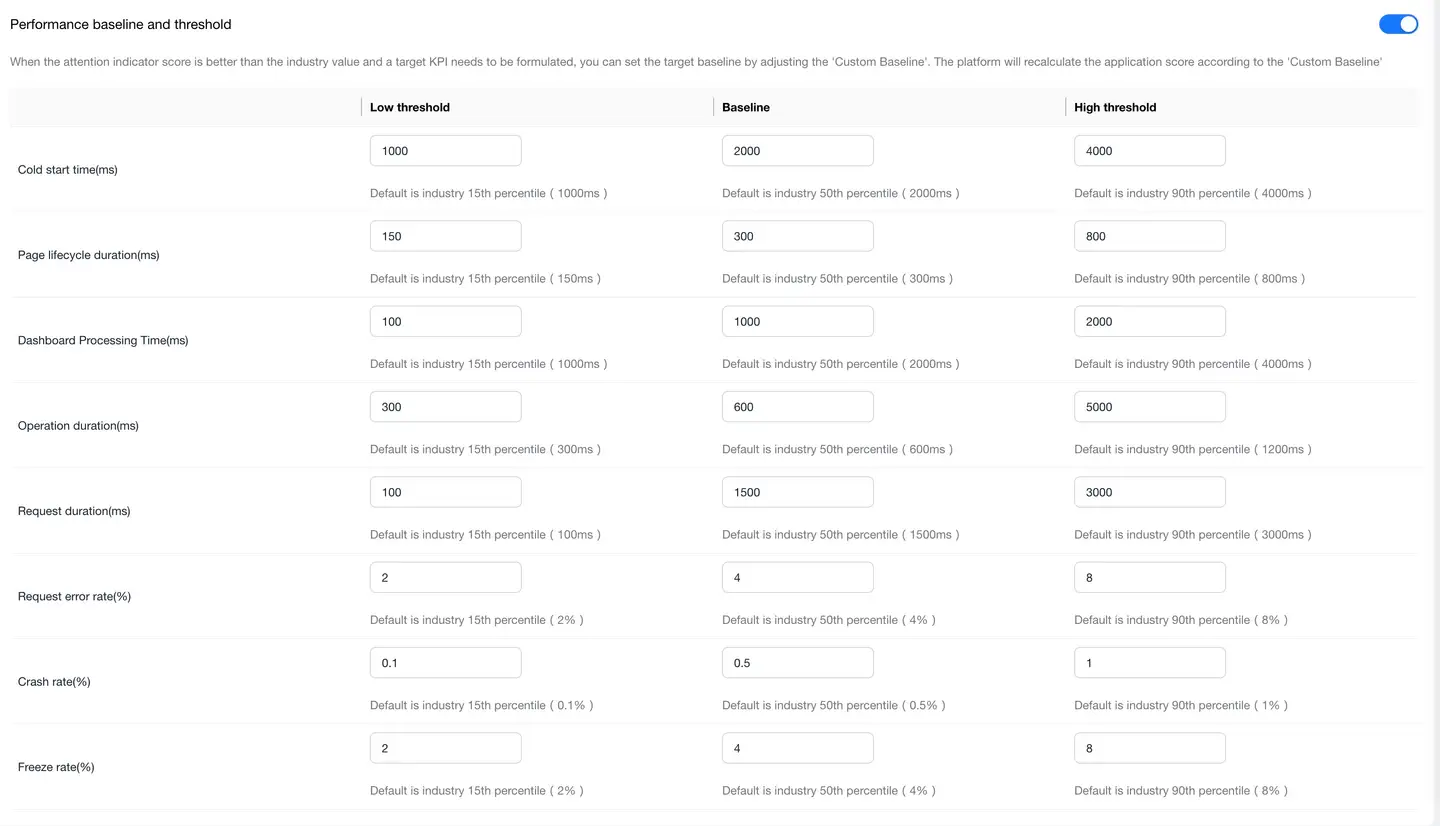
Performance Baselines and Thresholds
Note: When calculating scores, each threshold is automatically obtained by the system and updated once per calendar month.
-
The score calculation method for each of the above metrics is as follows:
- Metric Score = 100*(Metric Average - Industry 90th Percentile Value)/(Industry 10th Percentile Value - Industry 90th Percentile Value)
- The final score of the application is the sum of each metric's score multiplied by its corresponding weight.
-
After completion, please click the Save Settings button for the configuration to take effect.
Product Quality and Resource Monitoring
Exception Analysis Settings
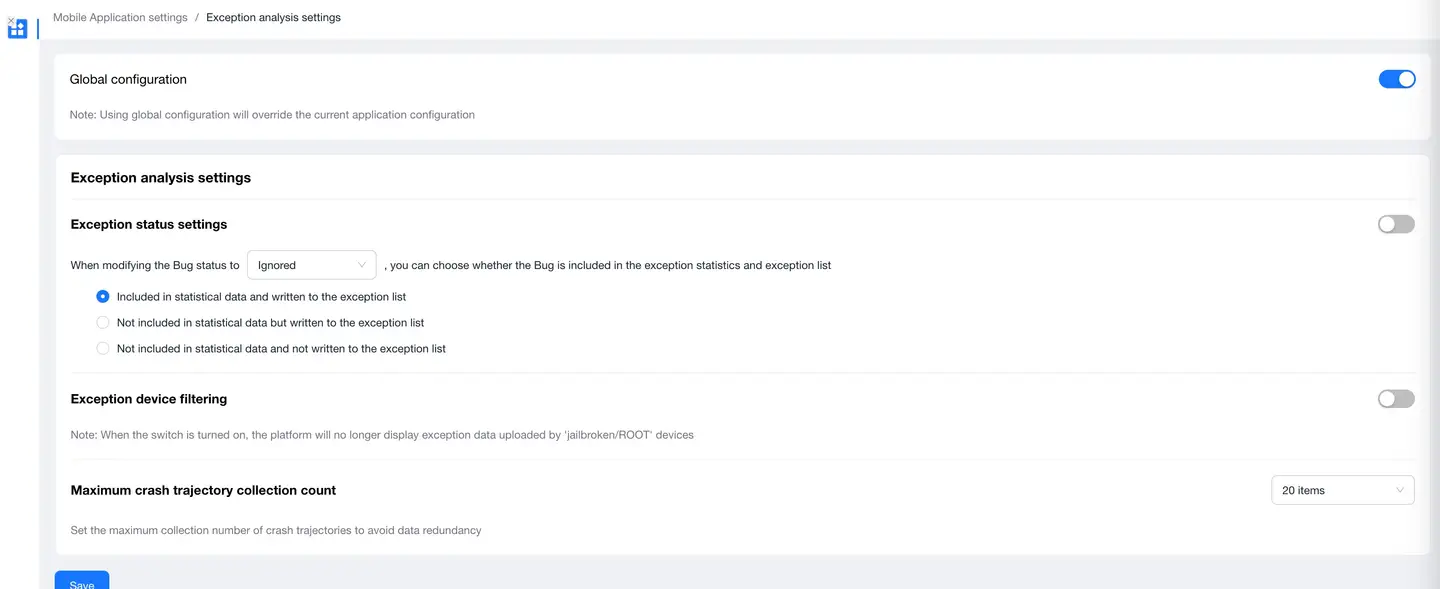
Exception Status Settings
Exception issues (including crashes, freezes, custom errors) status supports three types: "Ignored", "Fixed", and "Ignored or Fixed". You can choose whether to include the exception issue in exception statistics and exception lists based on your own needs.
Exception Metric Settings
Users can change the algorithm and unit of the platform's "Crash Rate", "OOM Rate", and "Freeze Rate" according to business needs. By default, this feature switch is off. The default algorithm for crash rate and OOM rate is "Occurrence Count/Startup Count", with the unit being percentage. The default algorithm for freeze rate is "Freeze Count/Startup Count", with the unit being per thousand. Users can change these according to their statistical needs.
Exception Device Filtering
When the exception device filtering feature is enabled, the platform no longer displays exception data uploaded from "Jailbroken/ROOT" devices, including crashes, freezes, and OOMs. By default, this feature switch is off. Users can also disable exception data collection on jailbroken devices by calling an interface. For details, see the Filter Jailbroken Device Exception Data Collection interface in the SDK interface documentation.
Resource Monitoring
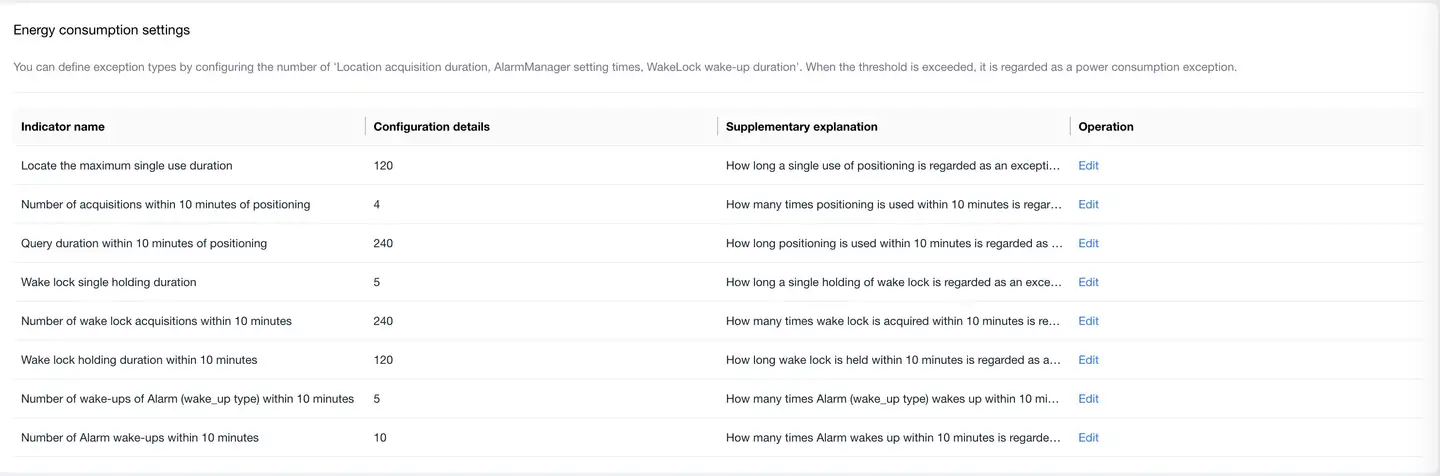
Energy Consumption Settings
You can define exception types by configuring the count of "Location Acquisition Duration, AlarmManager Setting Count, WakeLock Wake Duration". When exceeding the threshold, it is considered a power consumption exception.
CPU Settings
When the application's CPU Usage Rate exceeds the threshold, the SDK will record it as a CPU exception. When a CPU exception occurs, the SDK will collect thread stacks that exceed the Thread CPU Usage Rate Threshold.
- CPU Usage Rate Threshold: When the CPU usage rate of the foreground process exceeds the threshold, it is identified as an exception. Default threshold: 3, minimum value is 1, maximum value is 16
- Thread CPU Usage Rate Threshold: When a thread's CPU usage rate exceeds the threshold, it is identified as an exception. Default threshold: 0.05, minimum value is 0.01, maximum value is 1

Security and Protection

Module Control Switches
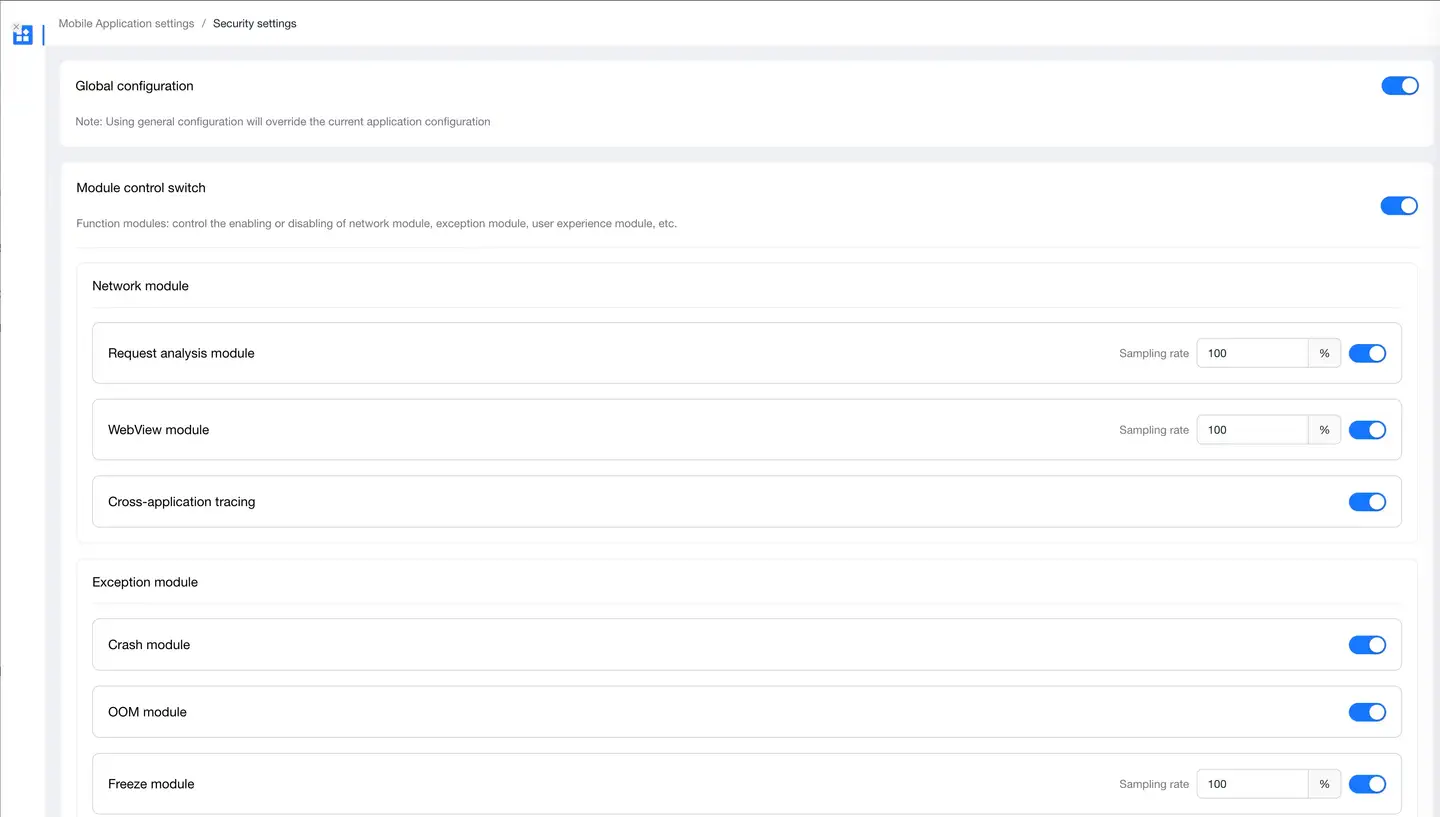
Module control switches are the master switches for each module, controlling whether the SDK collects data for the corresponding module. They are off by default. When turned on, you can individually control whether the SDK collects data for the request analysis module, WebView module, cross-application tracking, crash module, freeze module, user experience module, user statistics module, and network detection.
- Request Analysis Module: After turning off the switch, the SDK no longer embeds code in network libraries, affecting all data display in the "Network Analysis" function.
- WebView Module: After turning off the switch, the SDK no longer injects JS Agents into H5 pages within the application, affecting the display of App H5 page data in the "Web" product line.
- Cross-Application Tracking: After enabling cross-application tracking, the SDK will add TingYun request headers to requests, allowing tracking when cross-application calls occur based on this identifier.
- Crash Module: After turning off the switch, the SDK no longer collects crash data, affecting the display of "Crash" data in exception analysis.
- Freeze Module: After turning off the switch, the SDK no longer collects freeze data, affecting the display of "Freeze" data in exception analysis.
- User Experience Module: After turning off the switch, the SDK no longer collects application startup, operation, and page data, affecting all data display in the user experience function.
- User Statistics Module: After turning off the switch, the SDK no longer collects usage duration data, affecting the data collection of "User Duration" in user statistics and custom error data collection in exception analysis.
- Network Detection Module (off by default): After turning off this switch, the SDK no longer receives network detection tasks, and the network detection function cannot be used. The "Network Delay" and "Packet Loss Rate" metrics in network analysis cannot be collected.
- Log Retrieval Module (off by default): After turning off this switch, the SDK no longer receives log retrieval tasks.
- Cache Size: Log files are stored by day. By default, the cache size for a single log file stored each day is 10MB (storing logs for up to 7 days). You can adjust the storage size of a single log file as needed.
- Log Level: By default, all level logs are obtained. You can manually adjust the level of logs stored as needed.
When the master switch changes from off to on, your previous settings for individual module switches remain unchanged.
After completion, please click the Save Settings button for the configuration to take effect.
In application settings, you can control module switches by specified versions.
Enhanced Security (Application Settings)
A secondary verification method to prevent man-in-the-middle attacks, which can prevent applications from being impersonated by malicious actors.

-
Fill in Content
- For iOS, please fill in "Bundle Identifier".
- For Android, please fill in "SHA1 fingerprint".
-
After completion, please click the Save Settings button for the configuration to take effect.