Crash/Lag/Custom Error
Function Overview
The Exception Analysis module is used to view crashes, lags, and custom errors that occur in the selected App.
Click Exception Analysis in the left navigation bar to enter the exception analysis overview page and view the overall and single sample exception information of the current application.
Function Introduction
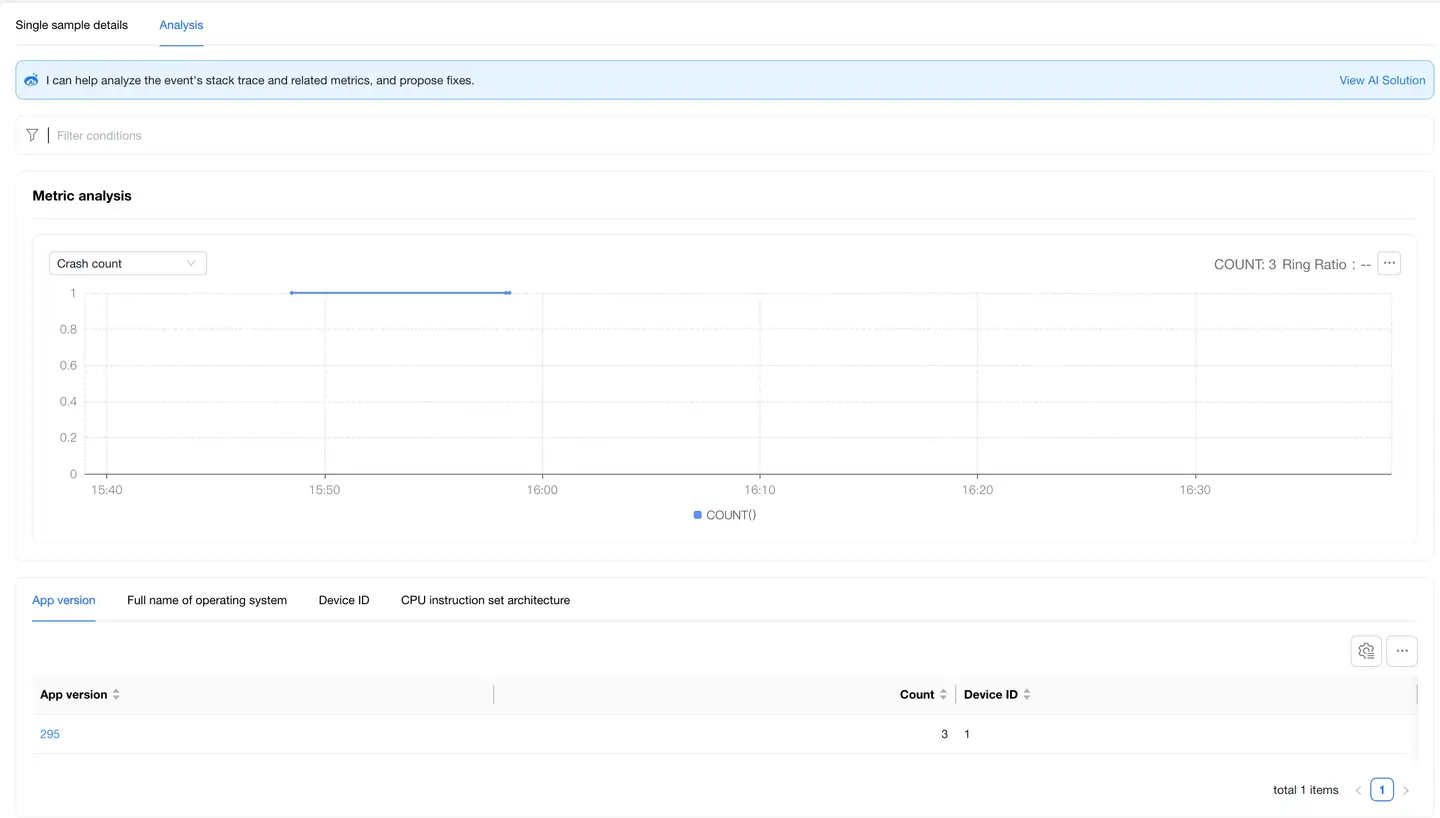
Metric Analysis
The exception analysis overview displays four types of exception data cards:
- Crash: Displays application crash rate, number of launches, number of crashes, and number of affected devices
- Lag: Displays application lag rate, number of active devices, number of lags, and number of affected devices
- Custom Error: Displays application error rate, number of active devices, number of errors, and number of affected devices

The trend analysis chart supports viewing the changing trends of exception times and exception rates, which can be switched by clicking the upper left corner to view metrics.
Dimension Analysis
Provides exception analysis in three dimensions:

Top5 Device Models
Displays the 5 device models with the highest crash rate/lag rate/error rate. Data is sorted by percentage from low to high and shows the number of affected devices and active devices for each device model.
Top5 Operating Systems
Displays the 5 operating systems with the highest crash rate/lag rate/error rate. Data is sorted by percentage from low to high and shows the number of affected devices and active devices for each system version.
Version Distribution
Displays the 5 application versions with the highest crash rate/lag rate/error rate. Data is sorted by percentage from low to high and shows the number of affected devices and active devices for each version.
Exception Management
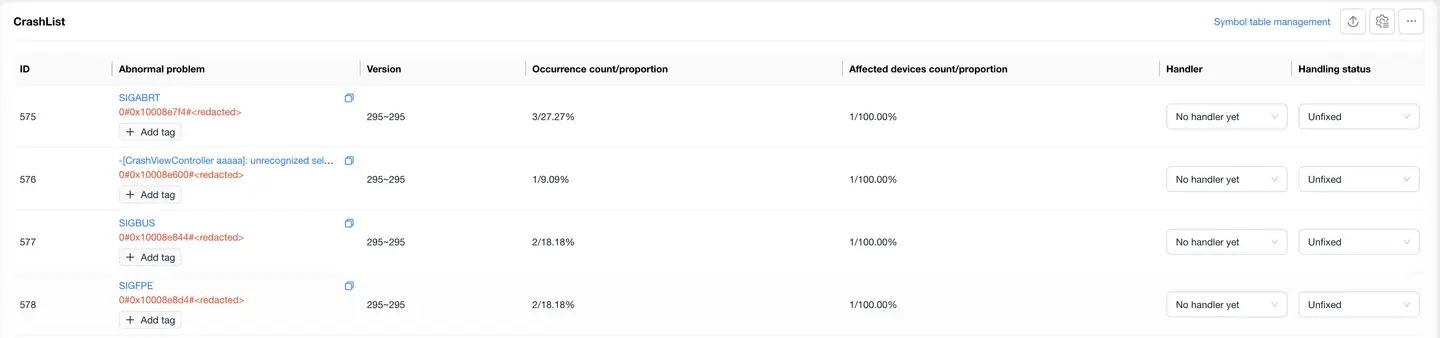
Exception List
The exception list contains three types of data: crash events, lag events (including custom errors and captured errors), and other exception records. The list is aggregated according to exception message and trace information, displaying the following information:
- Exception ID
- Exception Issue
- App Version
- Latest Report Time
- Occurrence Times/Proportion (current type exception times/total exception times)
- Number of Affected Devices/Proportion (current type affected devices/total affected devices)
- Status
Operation Functions
- Click the blue link of the exception issue to enter the exception details page
- Support filtering by the following conditions:
- Handler
- Tag
- Exception Handling Status
- Exception Stack
- Error Type
- Platform Type
- Exception Name
- The lag list additionally supports filtering by main thread lag and ANR
- Multiple tags can be added to exceptions
- Support batch modification of processing status
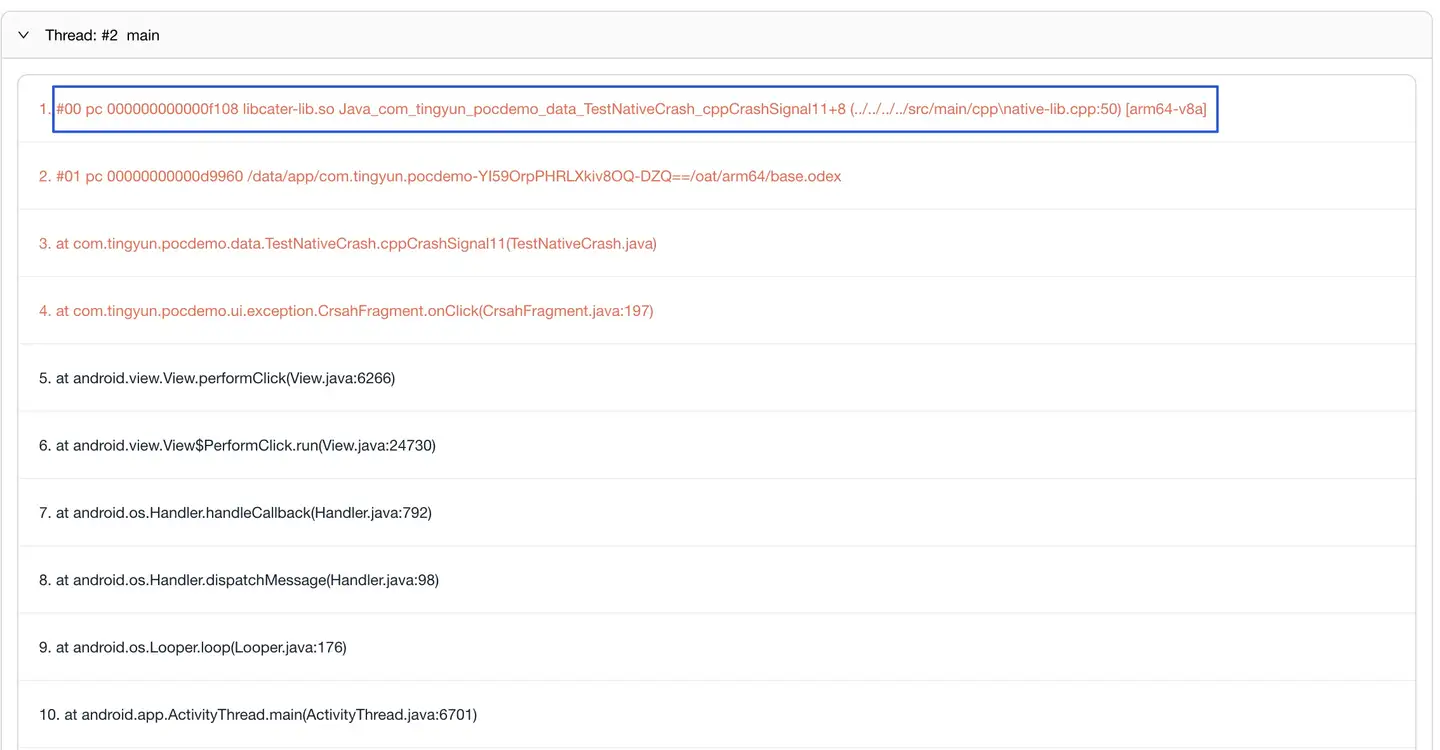
Symbol Table Function
To quickly locate the problem code location, the system uses symbol table files to parse exception stacks:
- Support manual upload: Click Symbol Table Management in the upper right corner
- Support automatic upload
- Only system administrators can perform upload operations
Example effect:
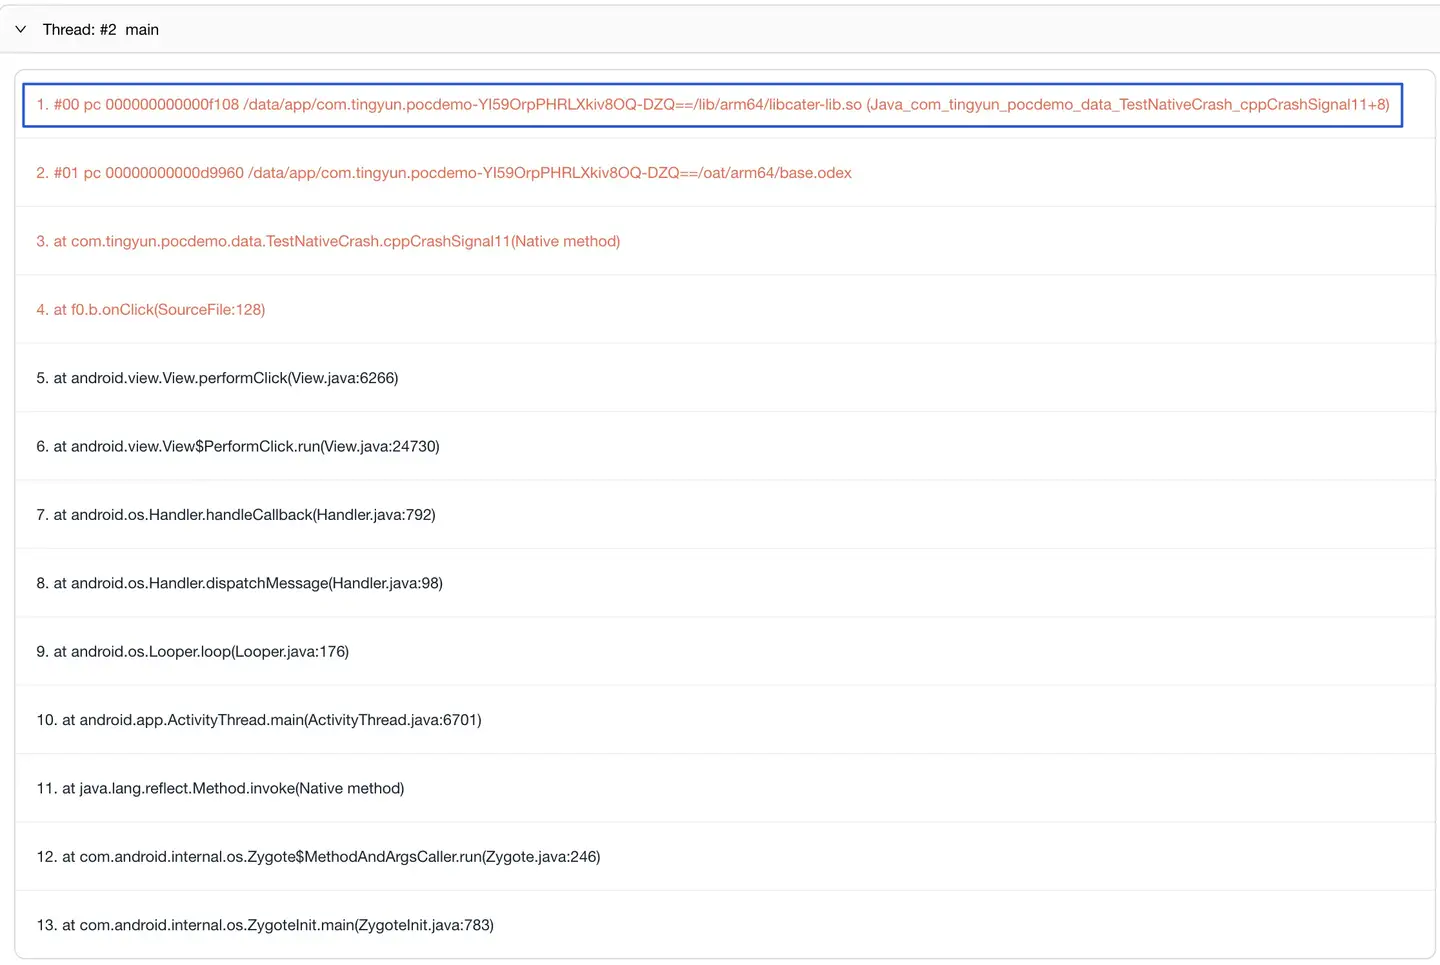
For detailed configuration instructions, see Symbol Table Configuration.
Exception Details
Basic Information
The top of the page displays basic statistical information about the exception:
- Occurrence Times
- Number of Affected Devices
- Fix Status
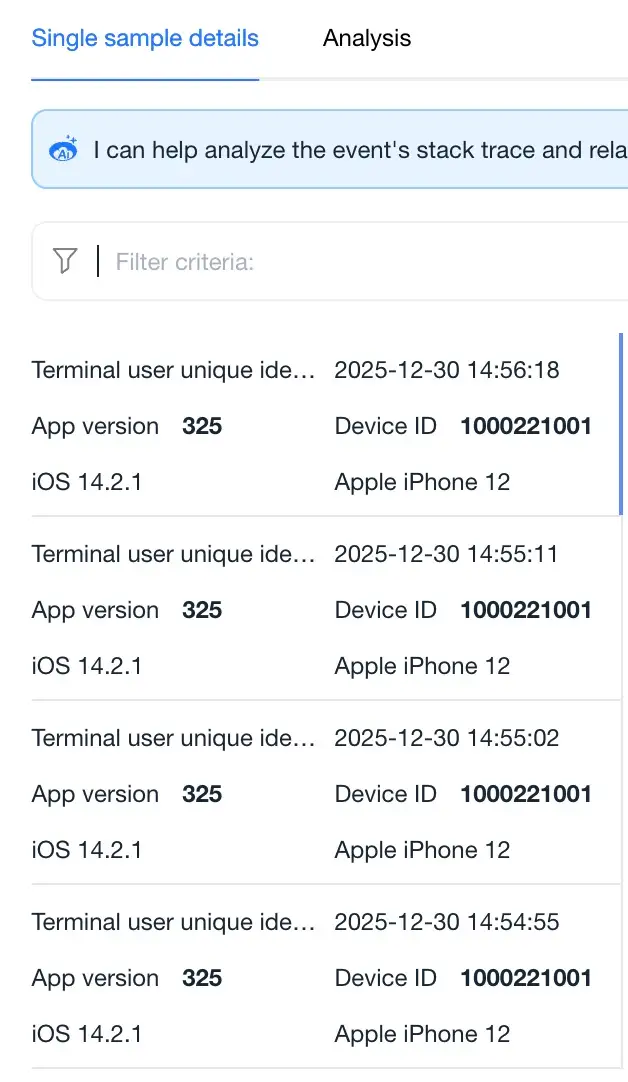
Exception Records
The Exception List tab displays records of each exception occurrence, including the following context information:
- Device Start Time
- Exception Occurrence Time
- User ID
- Device ID
- App Version
- Operating System
- Device Model
Exception Trend
The Exception Trend tab displays through bar charts:
- Crash times trend
- Changes in the number of affected devices
- Support trend comparison analysis
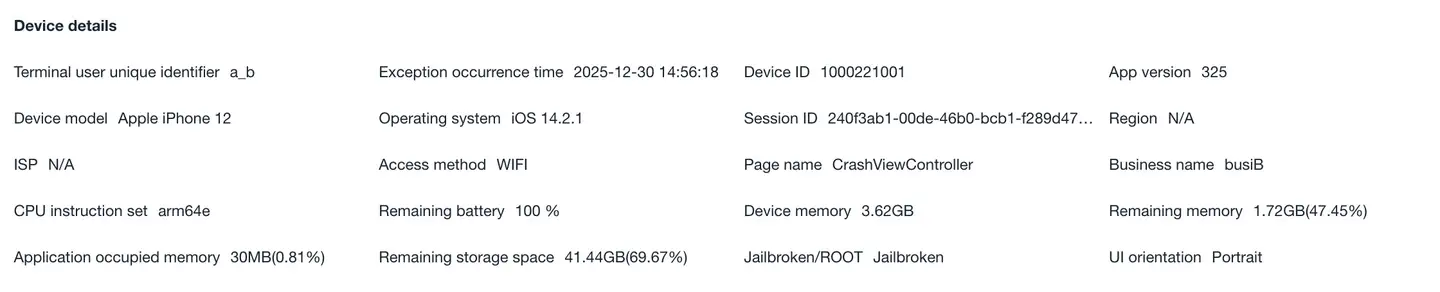
Context Information
Displays the environmental information of crash events:
- User Information
- User ID
- Device ID
- Time Information
- Application Start Time
- Exception Occurrence Time
- Session Duration
- Device Information
- Device Model
- Operating System
- CPU Model
- CPU Instruction Set
- UI Orientation
- System Information
- Device Memory
- Application Memory Usage (%)
- Remaining Memory (%)
- Remaining Storage Space (%)
- Network Information
- Region
- Carrier
- Access Method
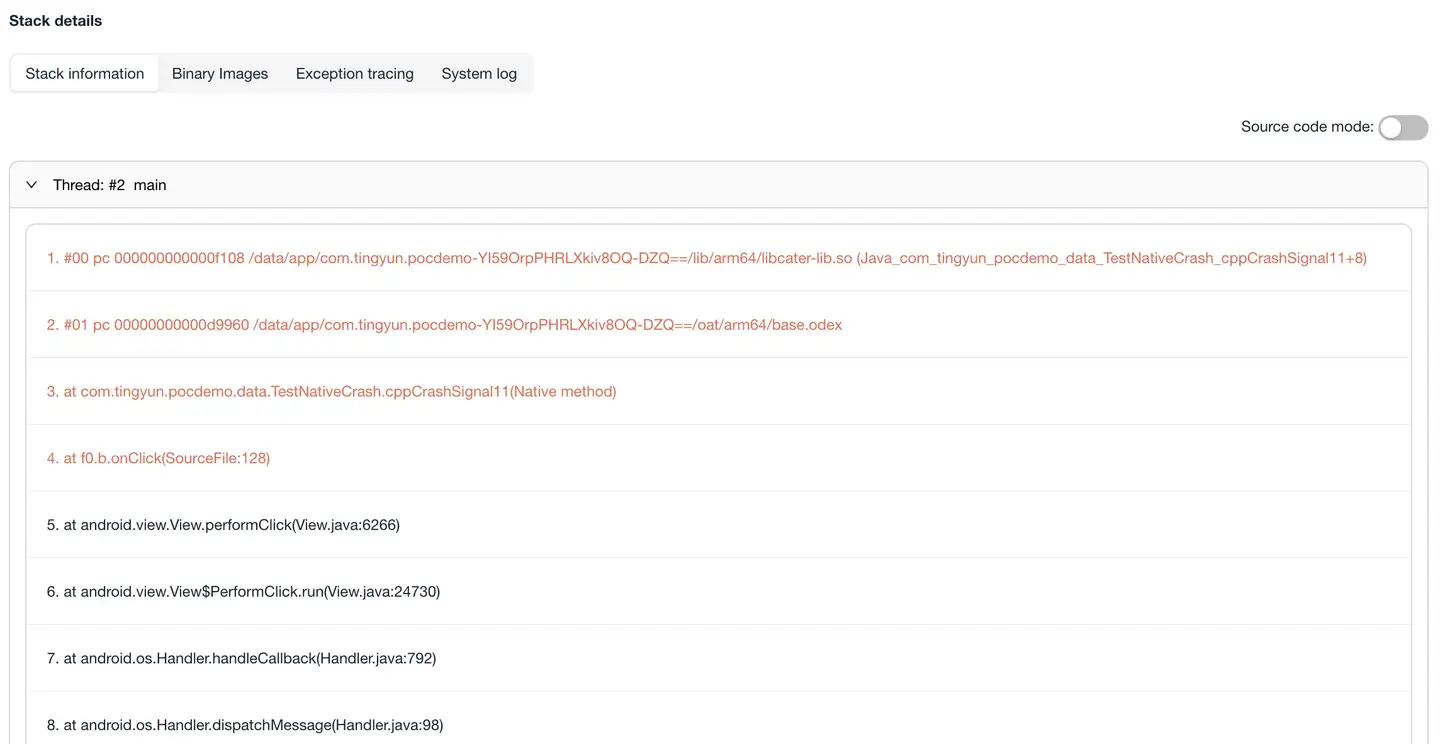
Stack Information
Displays the detailed stack of crash events:
- Shows the source of the crash
- Displays the final crash reason
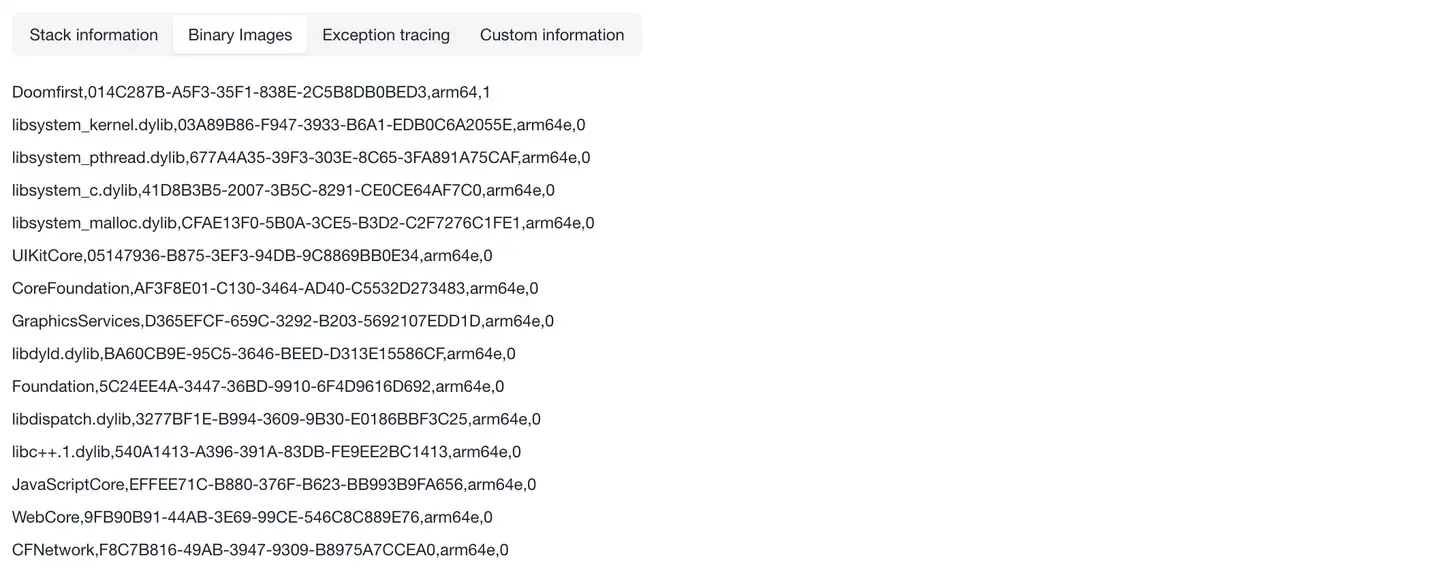
Binary Images: Basic information, specific to iOS applications. Only crashes and lags have this tab.
Custom Information: You can add 10 pieces of custom information with 100 bytes each at any position after the Tingyun SDK starts, such as adding the real user's account and contact information.
Addition method: NBSAppAgent.setUserCrashMessage(String key,String value);

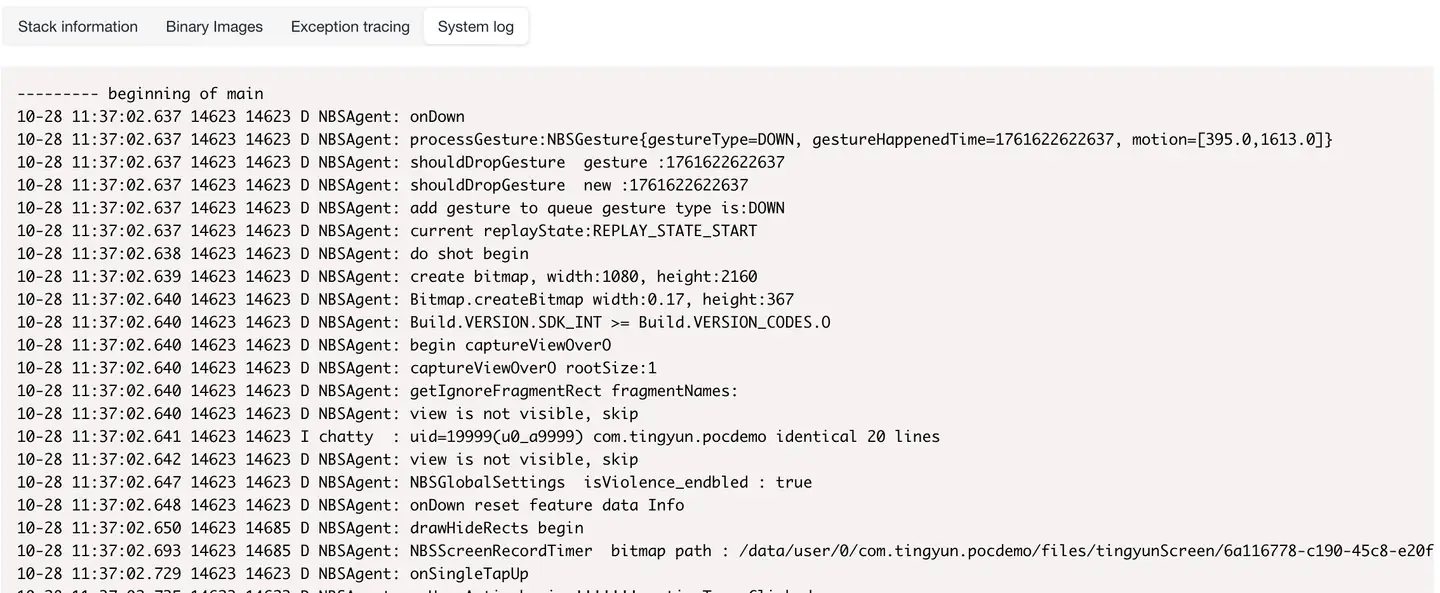
System Log: For Android SDK, users can customize system logs. After definition, a new System Log tab will be added to the Crash Details page.
Lag Details
Lag details add the following functions based on crash details:
- Flame Graph Analysis
- Request Waterfall Chart
- ANR Message
- Stack Information
Flame Graph Analysis
The flame graph helps locate the root cause of lags by analyzing slices of the main thread:
- Collection method: Collects the main thread call stack every 100ms
- Collection content:
- Main thread call stack information
- CPU usage percentage
- Memory usage situation
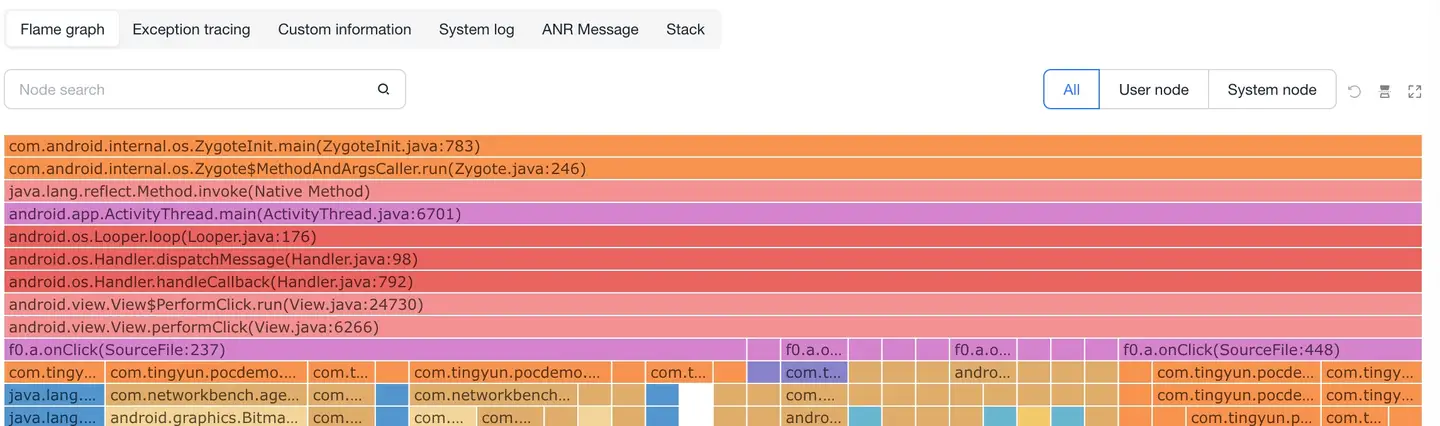
Flame Graph Interpretation
-
Vertical axis (call depth)
- Represents function call relationships
- Lower layer is the parent function of the upper layer
- Grid length represents time consumption
-
Horizontal axis (time order)
- Sorted by loading time
- Grid width represents frequency of occurrence
- The wider the width, the more likely it is the root cause of lag
-
Interactive features
- Node search: Support searching and highlighting call stacks
- Node filtering: Can choose to display user/system nodes
- View flipping: Support switching up and down directions
- Maximize display: Support full-screen viewing
Tooltip Information
Displayed when hovering with the mouse:
- Name: Complete name of the call stack
- Time consumption: Number of calls × Sampling frequency
- Times: Statistics of occurrence times
- Proportion: Number of child calls/Number of parent calls
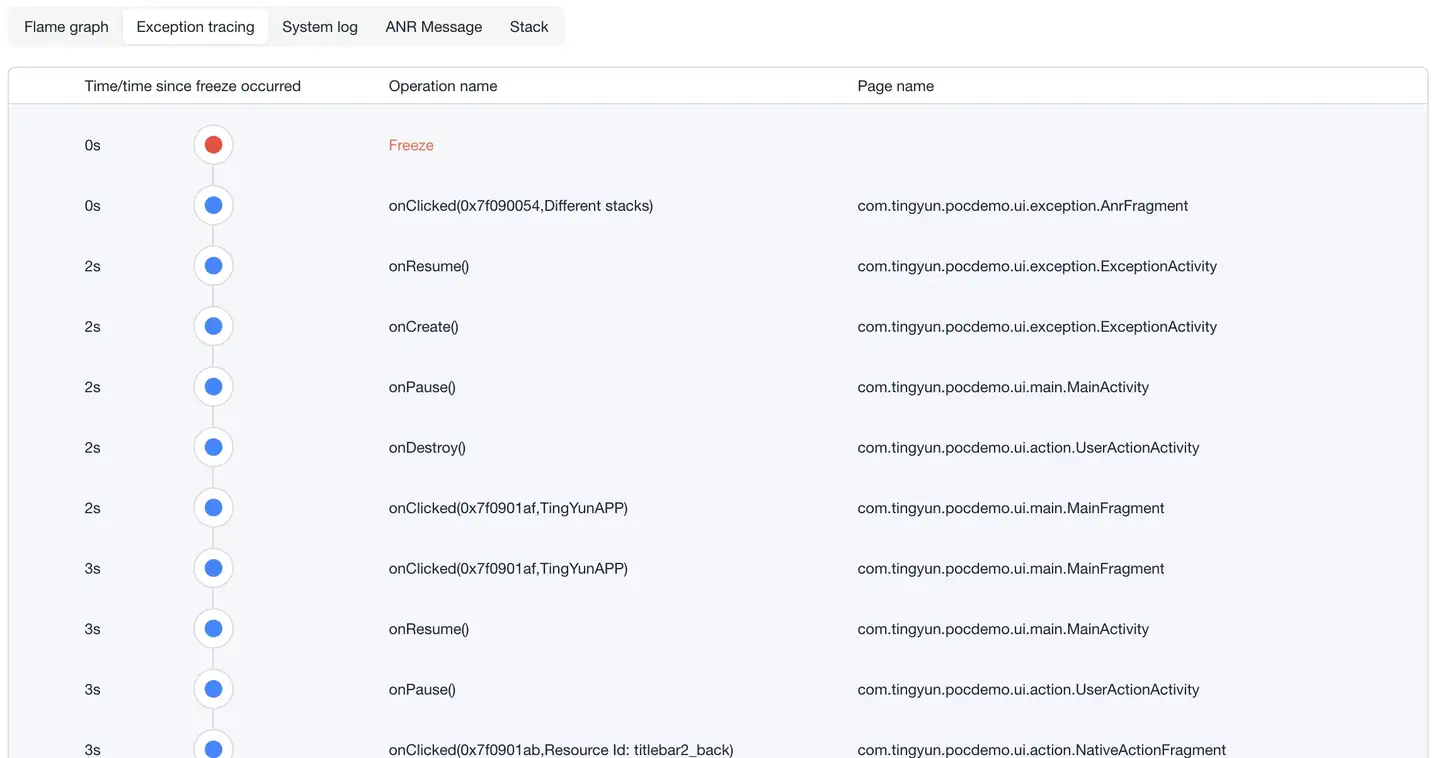
Exception Tracing
Restores the exception occurrence scenario by recording user behavior traces:
- Records the sequence of user operations before the lag
- Displays the complete behavior chain
- Supports scenario restoration analysis
ANR Analysis
ANR Message
Displays detailed information about application not responding.
Stack Information
Displays the stack information of all threads when ANR occurs, helping to locate the root cause of the problem.