Energy Consumption
The energy consumption analysis function helps developers monitor the power consumption of applications in real-time and provides detailed power consumption metrics, reasons for power consumption, and abnormal power consumption analysis data. The usage scenarios and value of this function are as follows:
-
Identifying Energy Bottlenecks: Through energy consumption analysis, you can understand which features, modules, or operations in your application are the main sources of energy consumption. This helps identify energy bottlenecks in your application and determine key points that need optimization.
-
Optimizing Battery Life: Energy consumption analysis can help you understand your application's energy consumption in different usage scenarios. By identifying high-energy operations or optimizing low-power strategies, you can reduce your application's energy consumption and extend the battery life of mobile devices.
-
Hardware Resource Management: Energy consumption analysis helps manage the resources used by your application more effectively, such as GPS, network, and sensors. By understanding your application's energy consumption patterns, you can develop appropriate resource management strategies, optimize resource usage, and reduce unnecessary energy consumption and resource waste.
-
Improving User Experience: Excessive power consumption may cause performance issues in mobile applications, such as lag and response delays. Through energy consumption analysis, you can discover performance issues related to power consumption and take corresponding measures to improve your application's performance, providing a smoother user experience.
-
Enhancing Application Quality: By conducting energy consumption analysis, you can discover potential problems and bottlenecks, and improve the design and code implementation of your application. This helps enhance application quality, reduce crashes, lags, and other issues, and improve the reliability and stability of your application.
Data upload frequency: Data is uploaded every 5 minutes.
Note: Energy consumption analysis only supports Android.
Metric Analysis
Filter Conditions
You can filter data by dimensions such as application version, device, operating system, and channel.
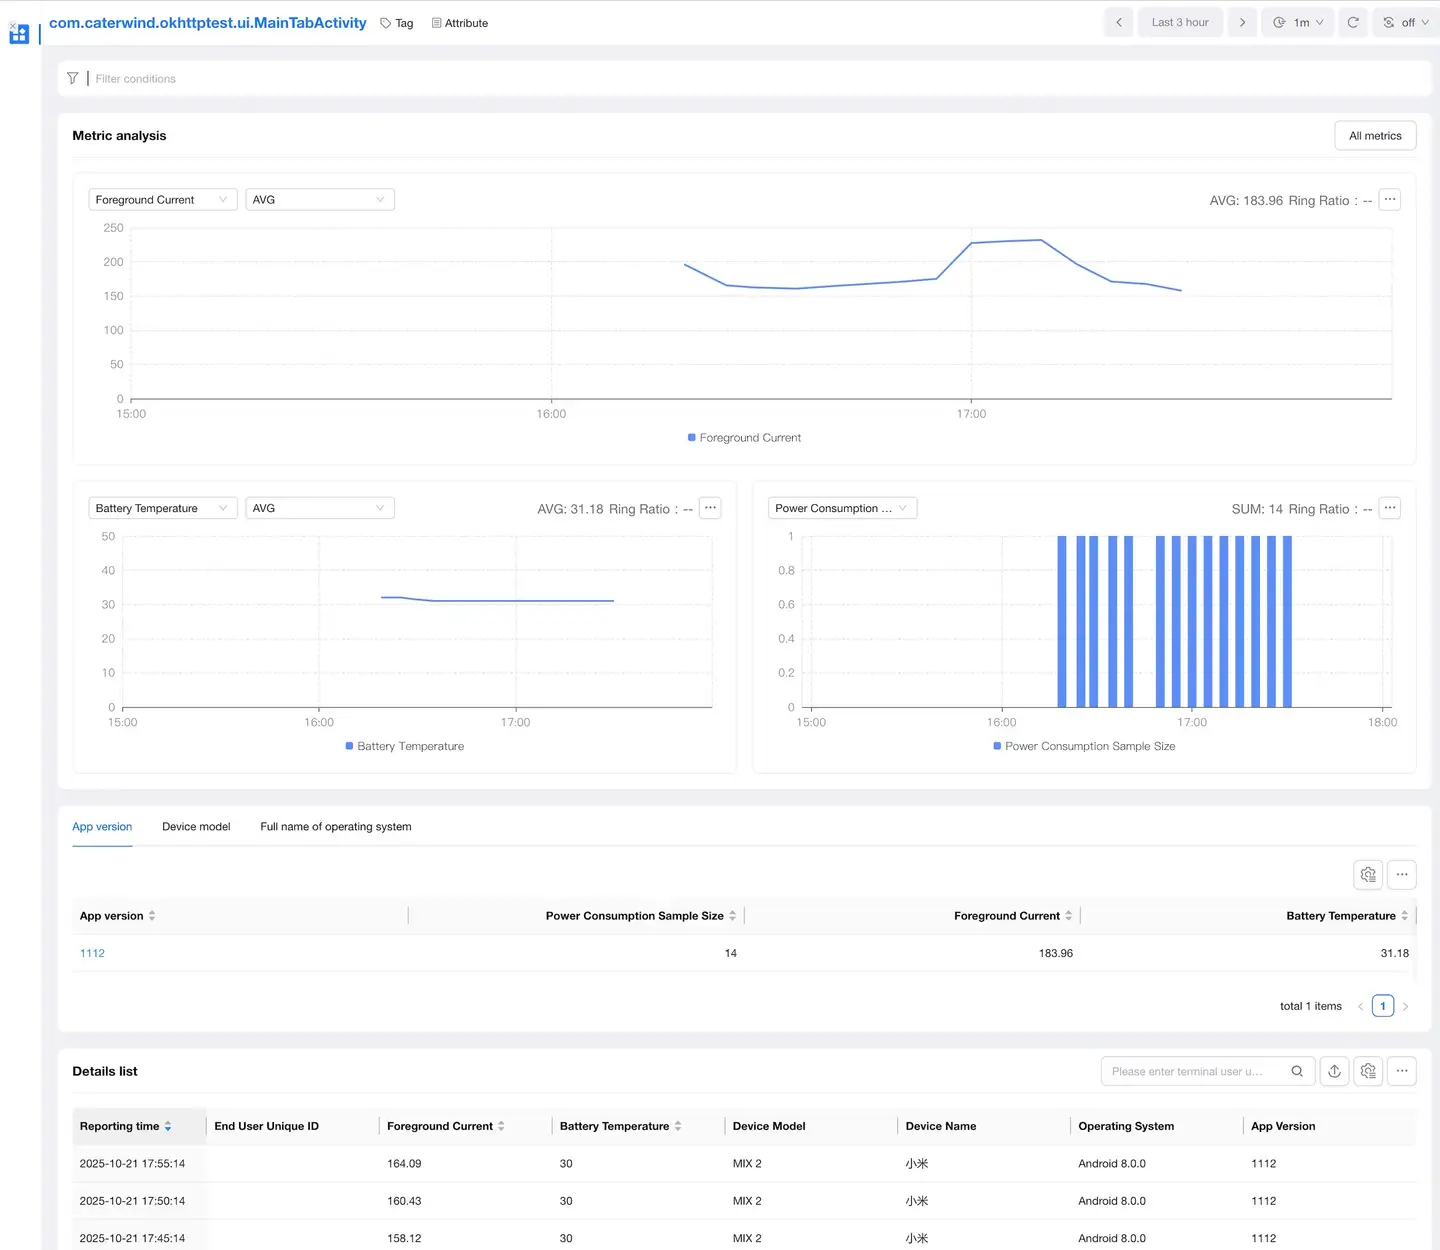
Trend Analysis
Displays trend charts of power consumption metrics "foreground current and battery temperature" under filter conditions. The trend chart displays the average value by default. You can filter out any percentile value of "25, 50, 75, 90, 99" in the trend chart on the right. You can export the data in the trend chart.
Metric description:
| Metric | Description |
|---|---|
| Foreground Current Value | Power value is the core indicator of device power consumption, and power value is determined by voltage and current. Generally, the voltage value of the device is in a stable state, so the current value trend can reflect the power consumption status of the device. When the App is in the foreground, the main source of power consumption is the App. When the sample size is large enough and bad cases are eliminated, when the App is in the foreground, the current can be used to measure the App's power consumption. |
| Battery Temperature | The battery temperature of the device; the higher the battery temperature, the higher the device power consumption. |
Data List
The data list shows the values of foreground current and battery temperature in various segments for each page. You can filter and search by page name and export the list data.

Details Page
Displays all detailed data of foreground current and battery temperature for a specific page.
- Dimension Analysis: You can filter and analyze by dimensions such as application version, device, operating system, and channel.
- Trend Analysis: Displays the trend chart of power consumption metrics for a specific page.
- Details List: Displays detailed power consumption data for a specific page.
Attribution Analysis
Filter Conditions
You can filter data by dimensions such as application version, device, operating system, and channel.
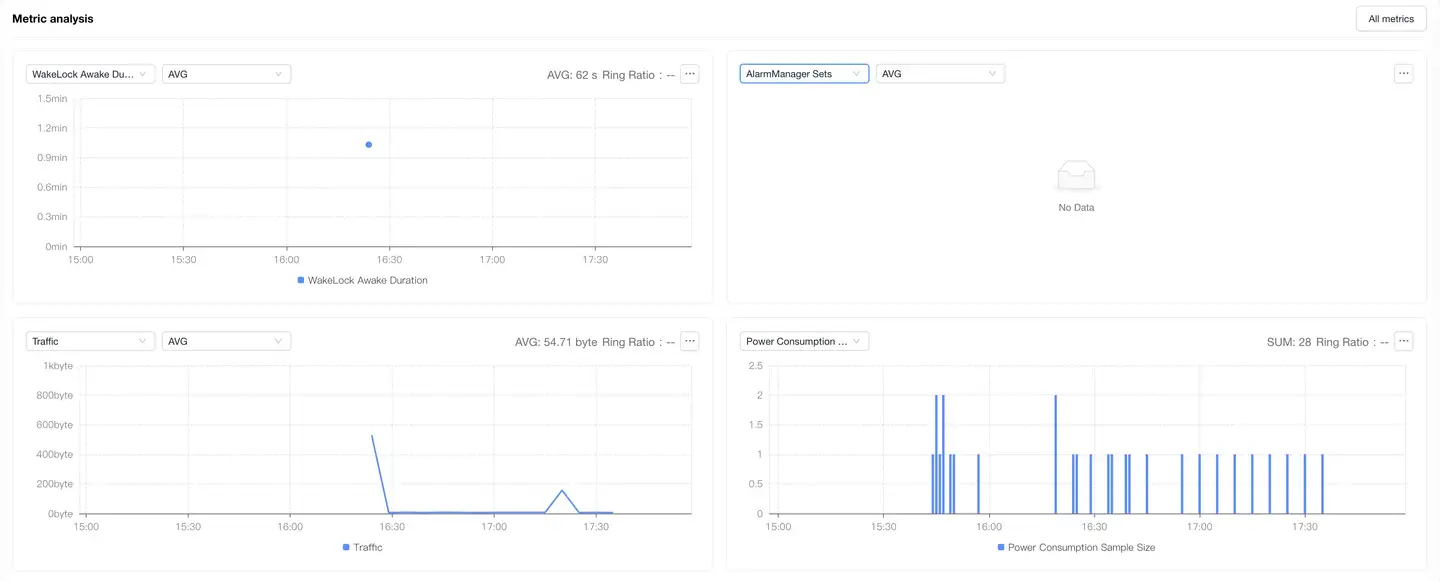
Trend Analysis
Displays trend charts of power consumption attribution metrics "traffic, Location acquisition duration, AlarmManager setting times, WakeLock wake-up duration" under filter conditions. The trend chart displays the average value by default. You can filter out any percentile value of "25, 50, 75, 90, 99" on the right. On the right side of the trend, you can filter data by different dimensions to view the distribution of power consumption attribution metrics.
Metric description:
| Metric | Description |
|---|---|
| Traffic | Traffic usage, including mobile traffic and Wi-Fi traffic. |
| Location Acquisition Duration | Location service usage duration. |
| AlarmManager Setting Times | Number of WakeUp type Alarm triggers. |
| WakeLock Wake-up Duration | The length of time WakeLock is held, the time interval between PowerManager's releaseWakeLock() and acquireWakeLock(). |
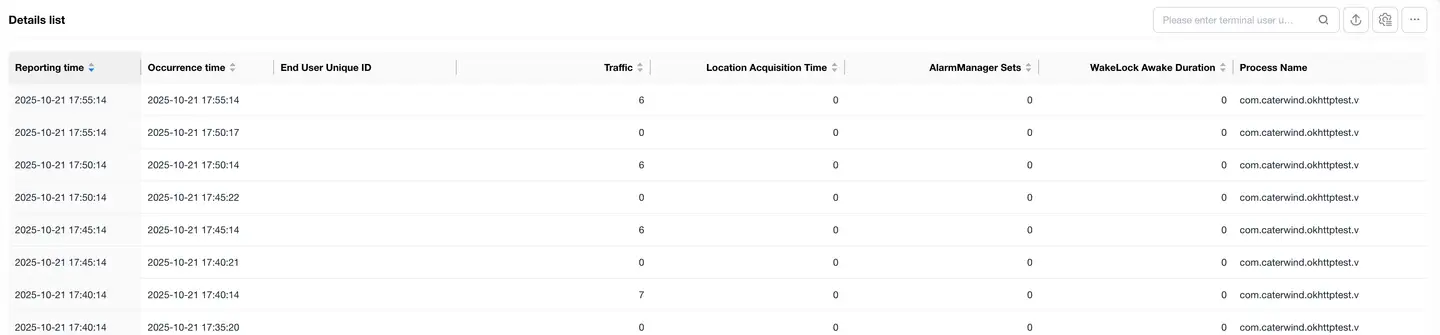
Details List
Displays detailed data of power consumption attribution metrics; list data supports export. You can click the + on the left to expand and view the context information of each power consumption attribution data "occurrence time, UserID, device ID, application version, device model, operating system, region, carrier, access method, CPU model, CPU instruction set, process name"

Abnormal Analysis
Filter Conditions
You can filter data by dimensions such as application version, device, operating system, and channel.
Trend Analysis
Power consumption abnormality: The three metrics of Location acquisition duration, AlarmManager setting times, and WakeLock wake-up duration exceed the threshold.

The trend analysis displays trend charts of power consumption abnormality metrics "abnormal times, abnormal rate, affected device count, affected device proportion".
Metric description:
| Metric | Description |
|---|---|
| Abnormal Times | Number of power consumption abnormalities that occurred under filter conditions. |
| Abnormal Rate | Number of power consumption abnormalities under filter conditions / total number of launches under filter conditions. |
| Affected Device Count | Number of devices that experienced power consumption abnormalities under filter conditions (deduplicated). |
| Affected Device Proportion | Number of devices that experienced power consumption abnormalities under filter conditions (deduplicated) / number of active devices under filter conditions (deduplicated). |
Abnormal List
Displays detailed data of power consumption abnormalities, the list supports export; abnormal issues are categorized and aggregated according to the first line of the App call stack in the collected abnormal thread stack.
You can filter data by the following dimensions:
Filter dimensions: abnormal stack, abnormal ID, userID, handler, tag, abnormal type, abnormal status

You can click on the abnormal issue to enter the abnormal details.
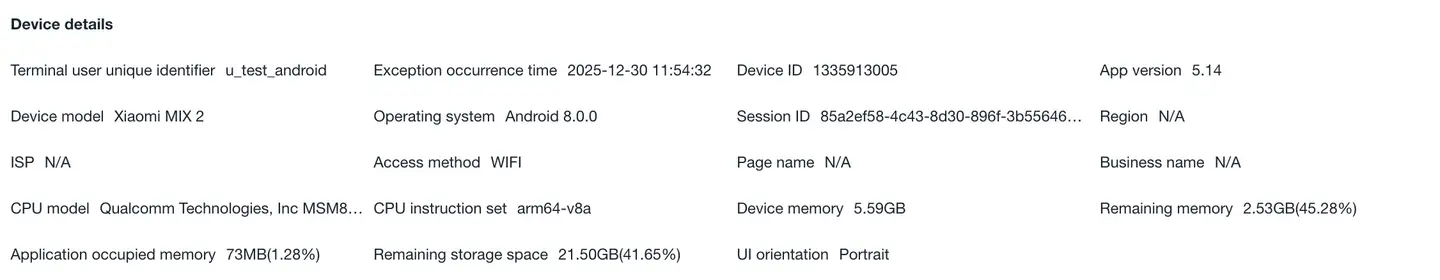
Abnormal Details
Displays the detailed information of each power consumption abnormal issue, mainly:
- Abnormal type, information

- Context information: UserID, abnormal occurrence time, session duration, device ID, application version, device model, operating system, region, carrier, access method, CPU model, CPU instruction set, device memory, remaining memory, application memory usage, remaining storage space, UI orientation.
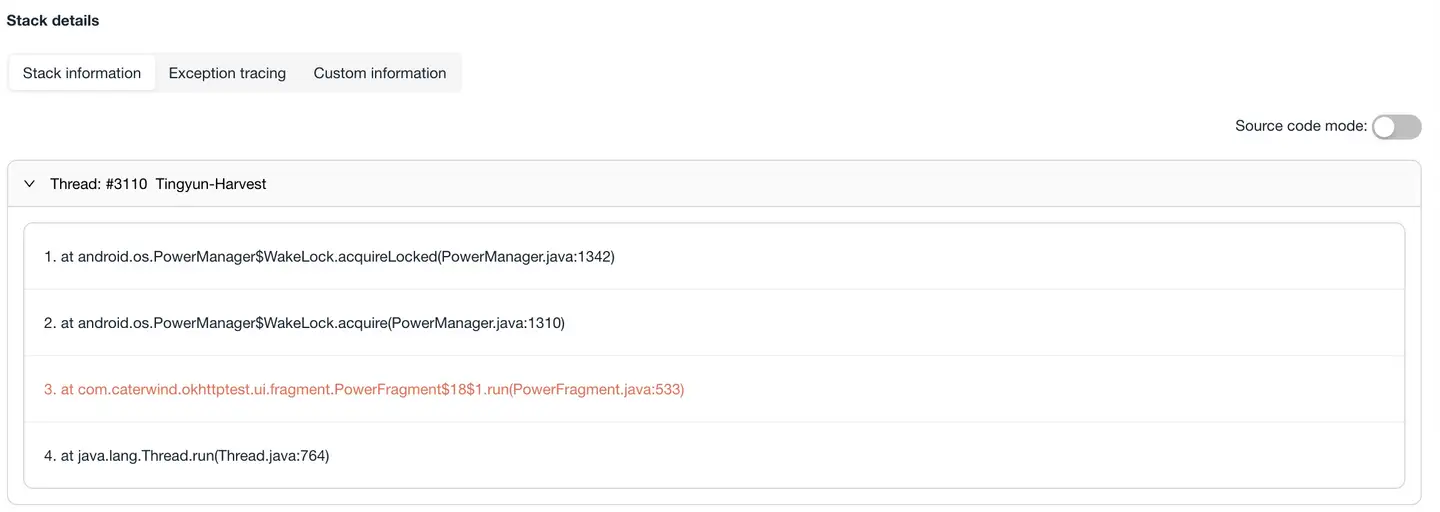
- Stack information: Thread call stack information where the abnormality occurred.
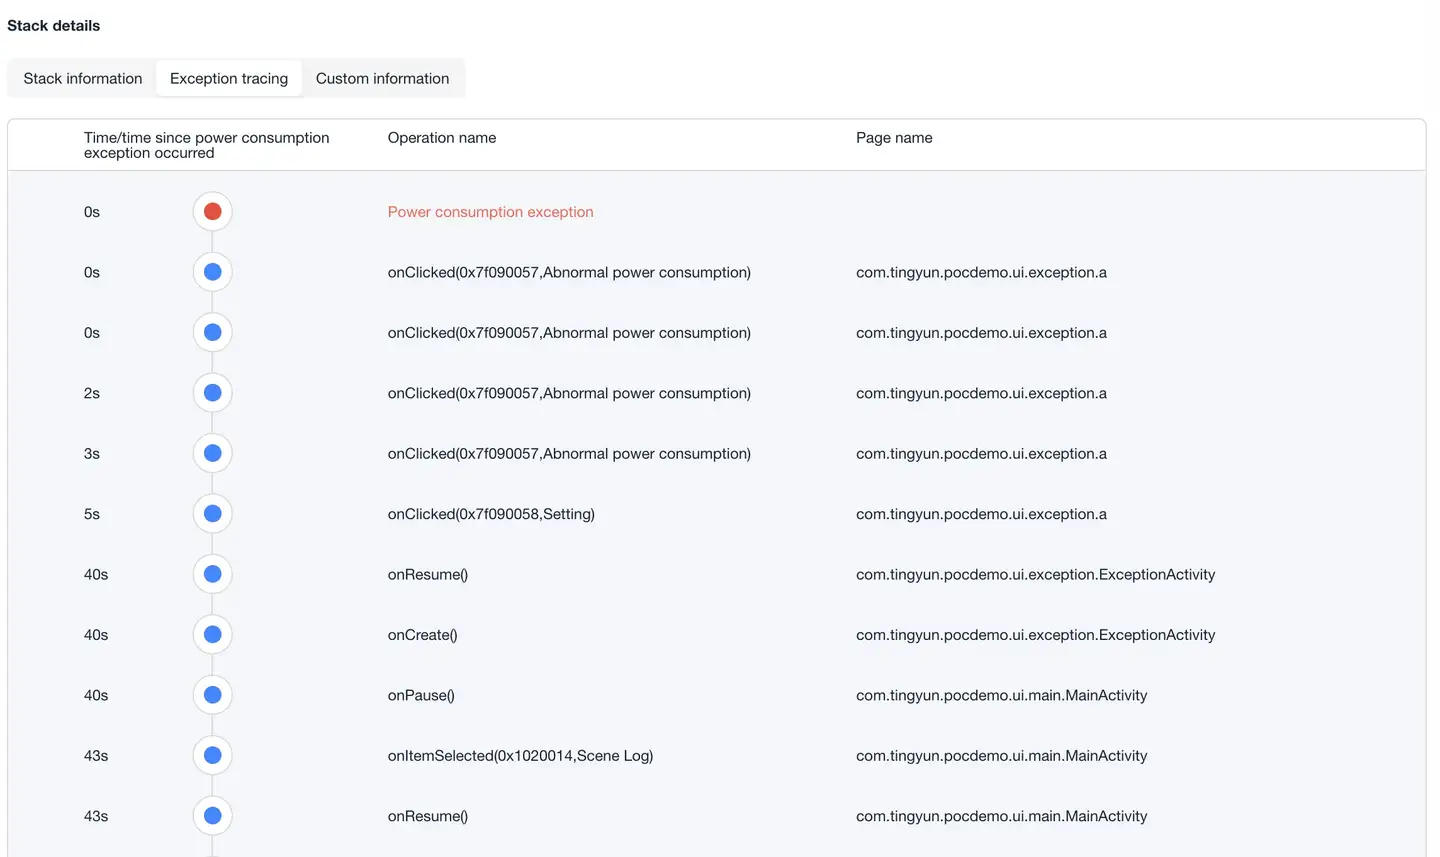
- Abnormal tracing: The trace triggered when the abnormality occurred.
- Custom information: Information set by calling
NBSAppAgent.setUserCrashMessage(String key,String value);

Power Consumption Abnormality Threshold Setting
Click "Application List" - "Settings" - "Energy Consumption Settings" to enter the energy consumption settings page. You can change the threshold for power consumption abnormalities according to your actual needs.

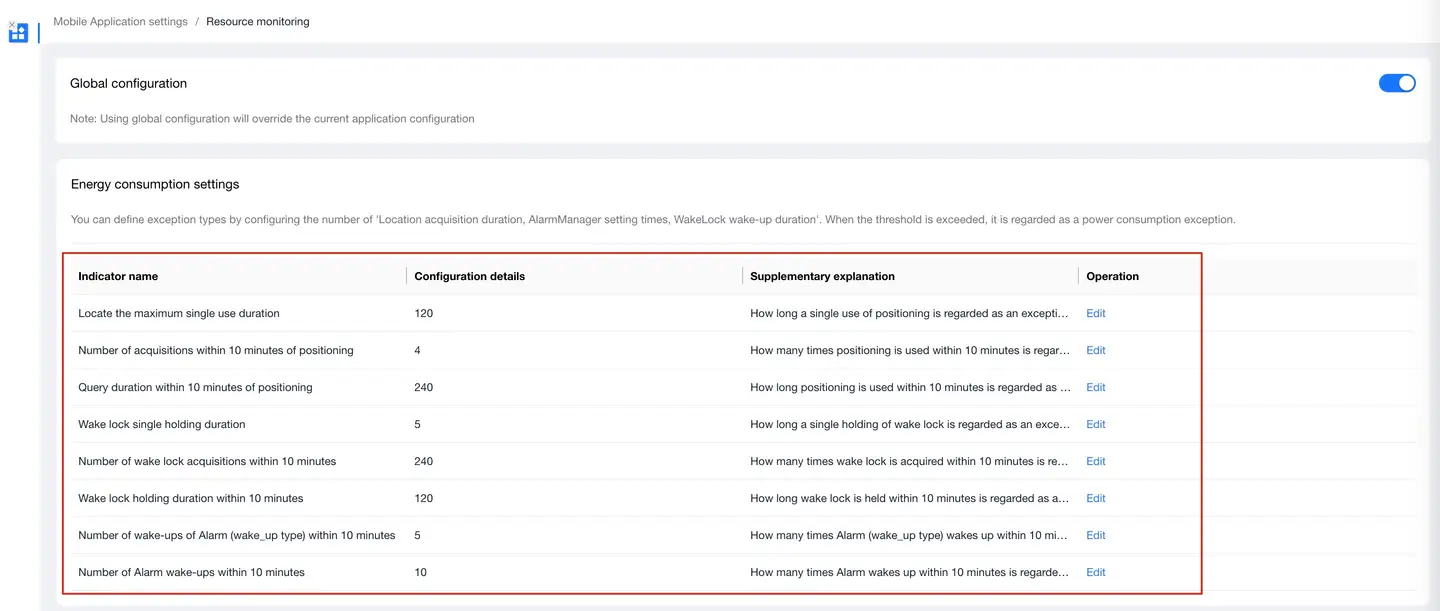
Default thresholds:
| Metric Name | Configuration Details | Auxiliary Description |
|---|---|---|
| Maximum duration of single location use | 120 | How long a single use of location is reported as abnormal, in seconds. |
| Number of location acquisitions within 10 minutes | 4 | How many times location is used within 10 minutes is reported as abnormal. |
| Location query duration within 10 minutes | 240 | How long location is used within 10 minutes is reported as abnormal, in seconds. |
| Single wake lock holding duration | 5 | How long a single wake lock is held is reported as abnormal, in seconds. |
| Number of wake lock acquisitions within 10 minutes | 240 | How many times wake lock is acquired within 10 minutes is reported as abnormal. |
| Wake lock holding duration within 10 minutes | 120 | How long wake lock is held within 10 minutes is reported as abnormal, in seconds. |
| Number of Alarm (wake_up type) wake-ups within 10 minutes | 5 | How many times Alarm (wake_up type) wakes up within 10 minutes is reported as abnormal. |
| Number of Alarm wake-ups within 10 minutes | 10 | How many times Alarm wakes up within 10 minutes is reported as abnormal. |
Energy Consumption Analysis Metric Collection Support Matrix
| Metric | Supported System Version |
|---|---|
| Foreground Current | Android 5+ |
| Battery Temperature | Android 5+ |
| AlarmManager | Android 5+ |
| WakeLock | Android 5+ |
| Traffic | Android 6+ |
| LocationManager | Android 5 ~ 12 |