CPU Analysis
The CPU analysis function can monitor the CPU usage of online applications in real-time, helping developers identify application performance bottlenecks and optimize application CPU usage by providing detailed CPU metrics and CPU exception counts. This reduces resource consumption when the application runs in the foreground or background, improves application response speed and fluency, enhances user experience, extends device battery life, and reduces heat generation.
CPU Exception: Continuous high CPU consumption by an application in the foreground or background over a period of time. Prolonged high CPU consumption by applications can lead to faster battery drain and device heating.
Metric Analysis
Filter Conditions
You can filter data by dimensions such as application version, device, operating system, channel, and business scenario.
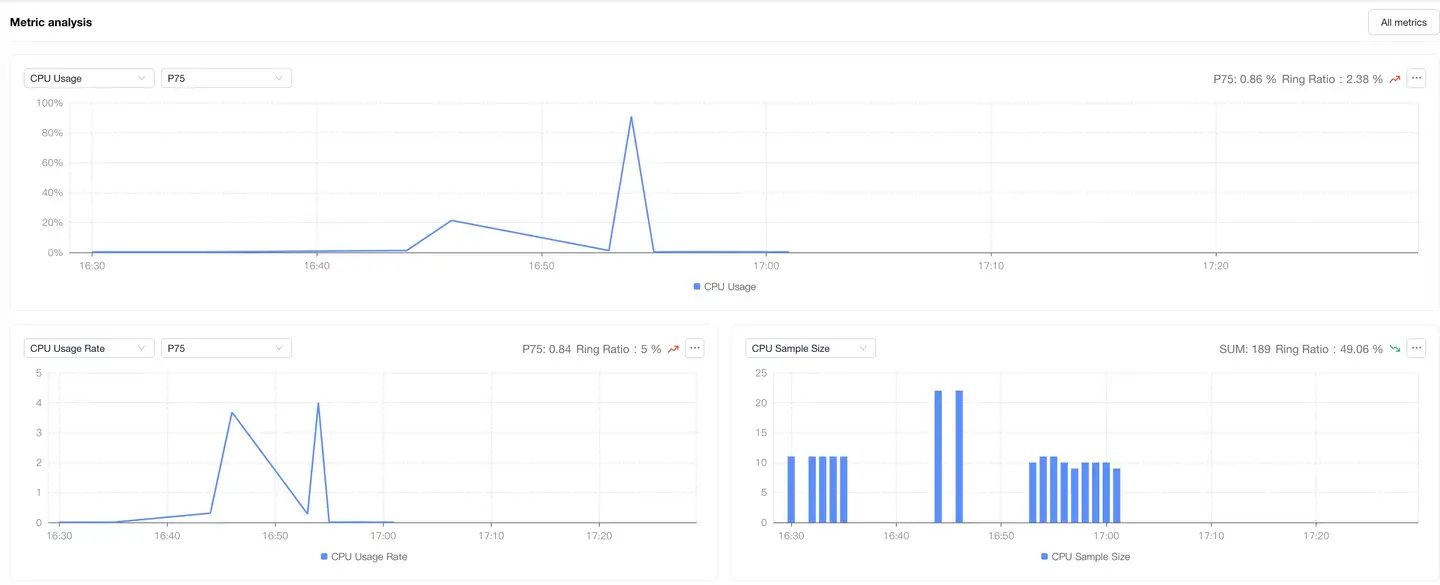
Trend Analysis
Displays trend charts of CPU usage rate, CPU usage speed, and sample size under filter conditions. The trend chart displays average values by default. You can filter out trend charts of CPU usage rate and CPU usage speed for any percentile value of "25, 50, 75, 90, 99" on the right. The distribution chart shows metric data filtered by dimensions such as application version, device, operating system, channel, and business scenario. Supports exporting data from trend distribution charts.
| Metric | Description |
|---|---|
| CPU Usage Rate | Refers to the ratio of the time the CPU processes tasks within a certain time interval to the total time of that interval. Calculation formula: Application process CPU time / Device CPU core frequency time * 100% |
| CPU Usage Speed | The ratio of CPU time consumed by the application process to the collection time within a specific time interval (1 minute). For multi-core systems, the maximum usage speed equals the number of CPU cores. Calculation formula: Application process CPU time / Collection time |

Thread CPU Usage Rate
Displays the CPU usage rate of each thread, supports exporting CPU usage rate data for each thread.

Exception Analysis
Filter Conditions
You can filter data by dimensions such as application version, device, operating system, channel, and business scenario.
Trend Analysis
Displays trend charts of exception metrics "Exception Count, Exception Rate, Affected Device Count, Affected Device Percentage" under filter conditions; supports exporting data from trend charts.
| Metric | Description |
|---|---|
| Exception Count | Total number of CPU exceptions triggered; a CPU exception is recorded when the CPU usage speed exceeds the threshold within 30s |
| Exception Rate | CPU Exception Count / Total Launch Count |
| Affected Device Count | Number of devices experiencing CPU exceptions |
| Affected Device Percentage | Number of devices experiencing CPU exceptions / Total active devices |

Exception List
Displays detailed data of CPU exceptions, the list supports export; exception problems are categorized and grouped by high-frequency call stacks and thread names; you can upload DSYM/mapping files to symbolize/deobfuscate CPU exception stacks.
You can filter data by the following dimensions:
Filter dimensions: Exception Stack, Exception ID, userID, Handler, Tag, Exception Type, Exception Status

Exception Details
Displays detailed information for each exception problem, supports exception sharing.
Overview

Single Sample Call Tree
Displays details of each CPU exception problem "Exception Device Details and Stack Details"
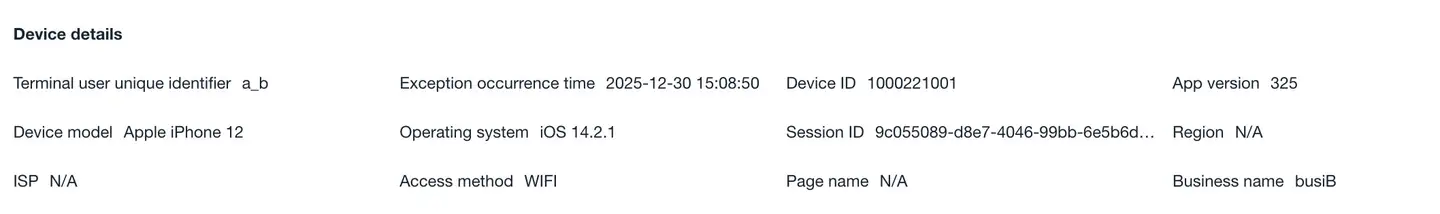
- Device Details
Displays context information when the exception occurs.
-
Stack Details
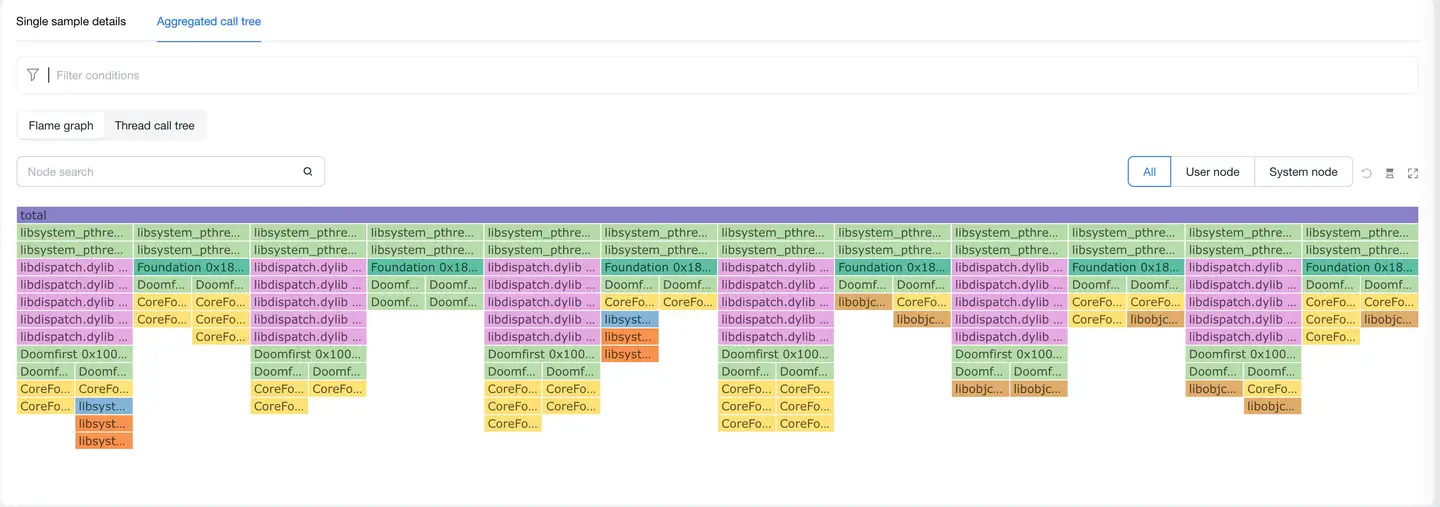
- Flame Graph
Aggregates collected thread stack information into a flame graph; supports node search and user/system node filtering.
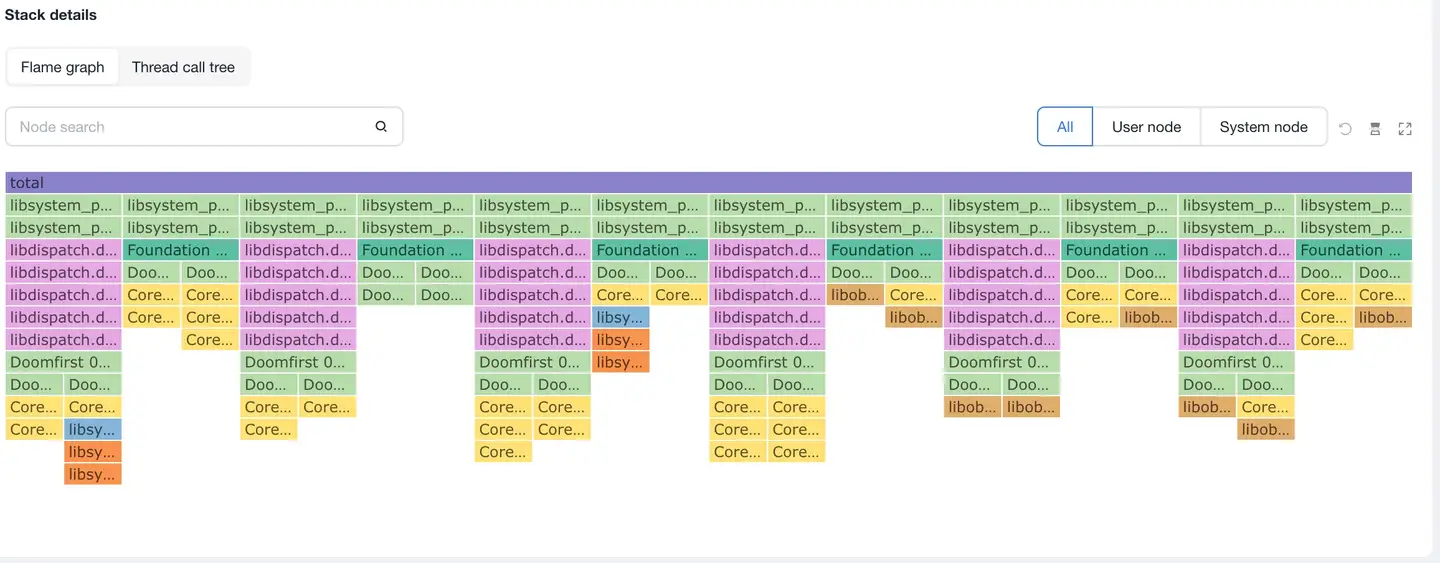
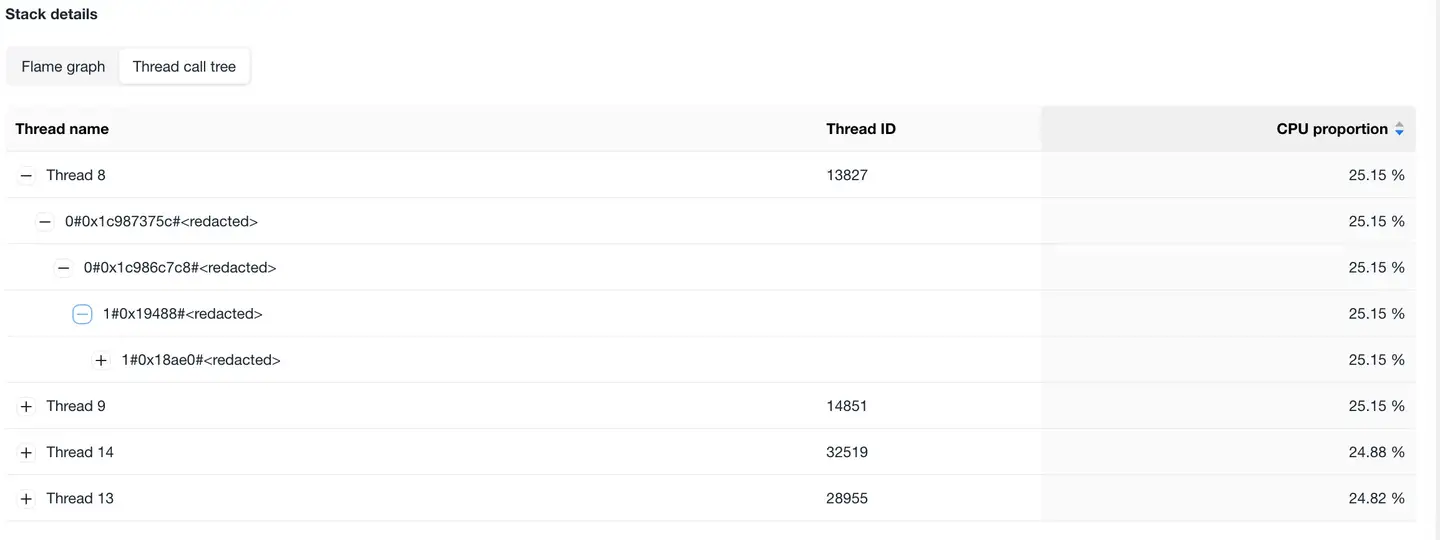
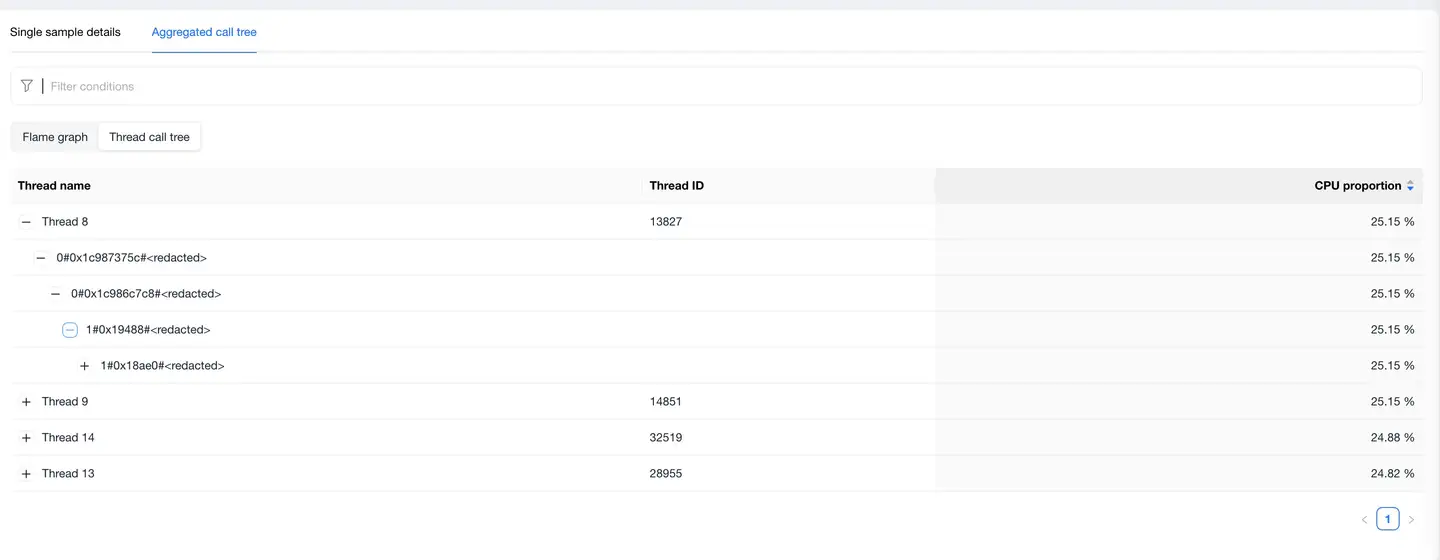
- Thread Call Tree
Aggregates collected thread stack information into a call tree, with "CPU Percentage" on the right representing the ratio of thread CPU usage rate to application CPU usage rate. The higher the value, the more CPU the thread occupies. After expanding each thread tree, you can view specific function calls to analyze exception problems.
Summary Call Tree
Aggregates all single sample CPU exception data into flame graphs and call trees for display.
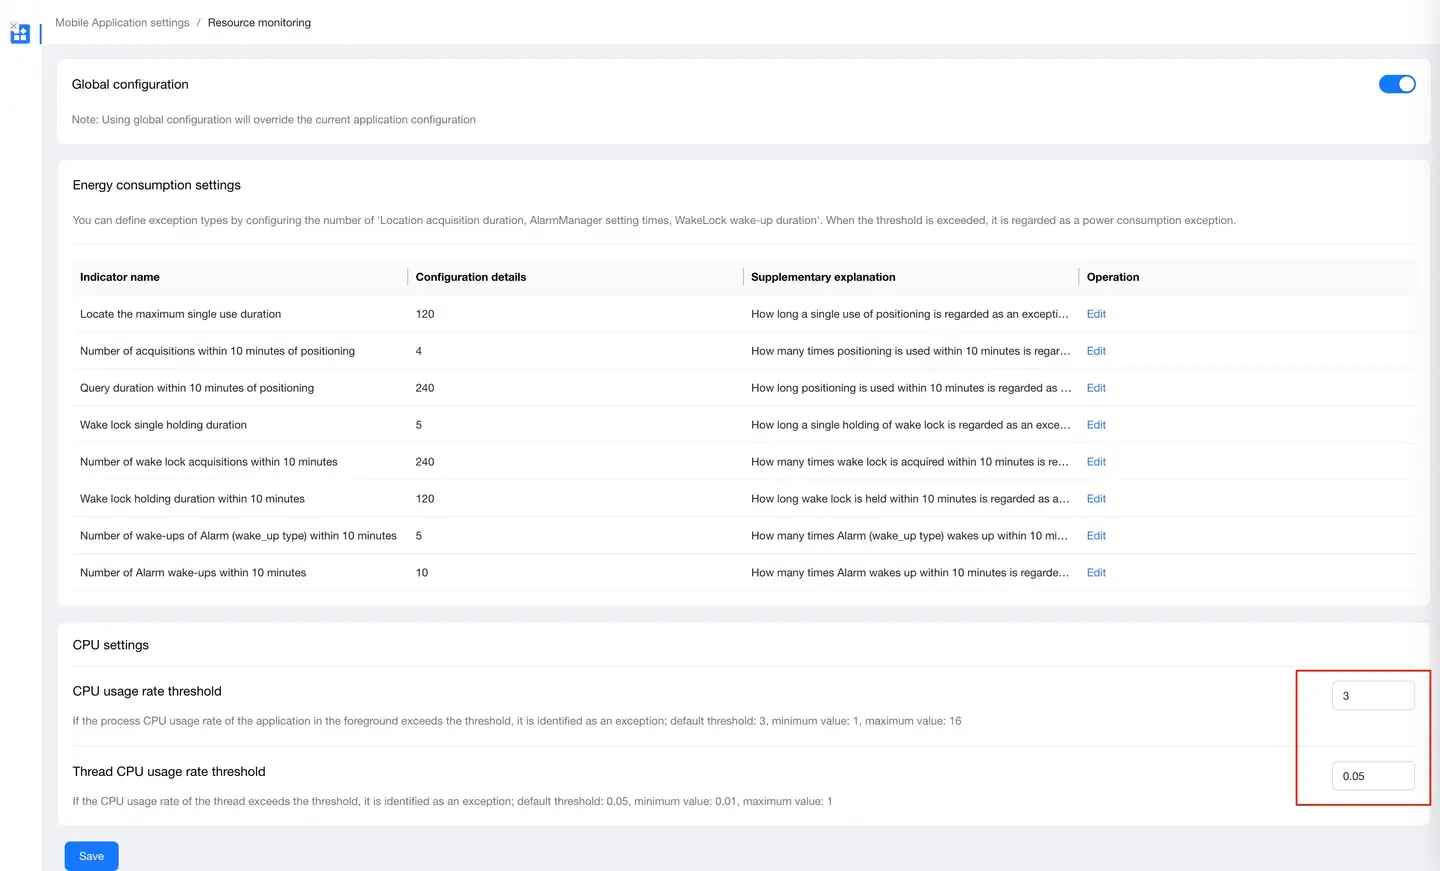
CPU Exception Threshold Settings
Click "Application List" - "Settings" - "Resource Monitoring" to enter the CPU settings page, where you can change the CPU exception threshold according to your actual needs.