Application Overview
Click on an application in the Application List page to enter the Overview page, which displays the application's score and performance metric values for the selected time period.
Application Score
The left side displays the application's score in a pie chart, while the right side shows the performance metrics that participate in the score calculation "crash rate, freeze rate, request error rate, request duration, first screen duration, startup time, interactive time, operation time" as well as the period-over-period comparison for each metric. You can move your mouse over the pie chart to view each performance metric's own score and its contribution to the pie chart.

Pie chart popup data description: The first line is the performance metric name, the second line is the score contribution of the performance metric to the application score, the third line is the performance metric's own score, and the fourth line is the performance metric value.

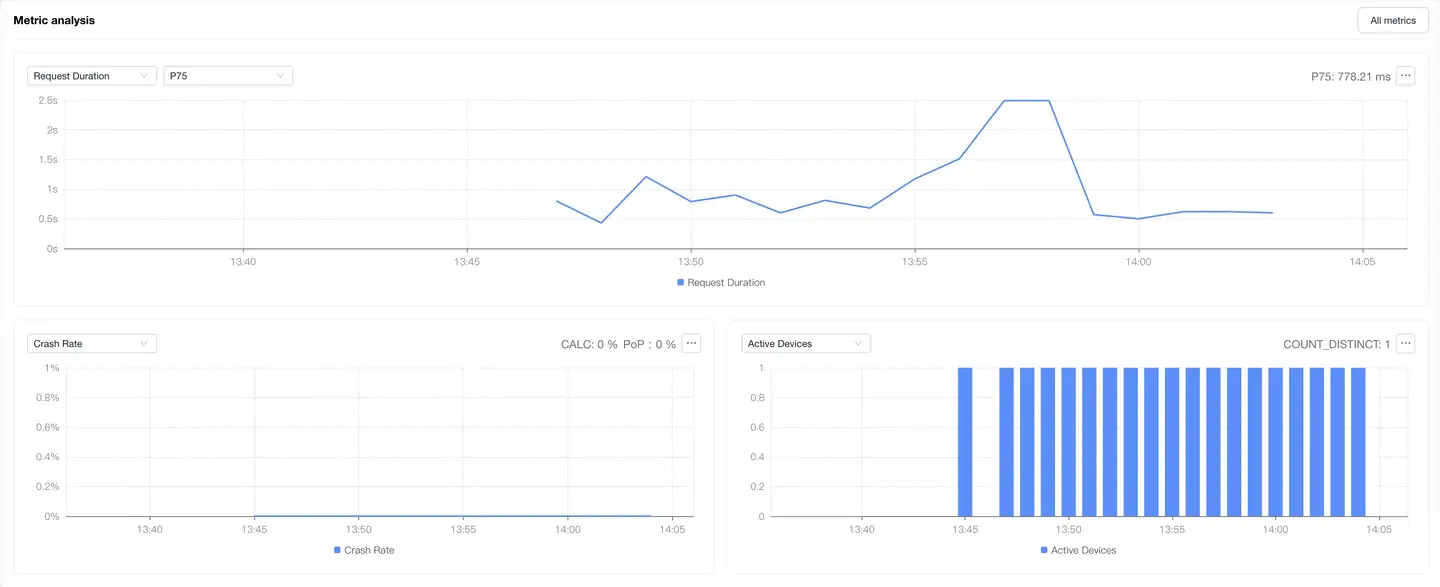
Metrics Analysis
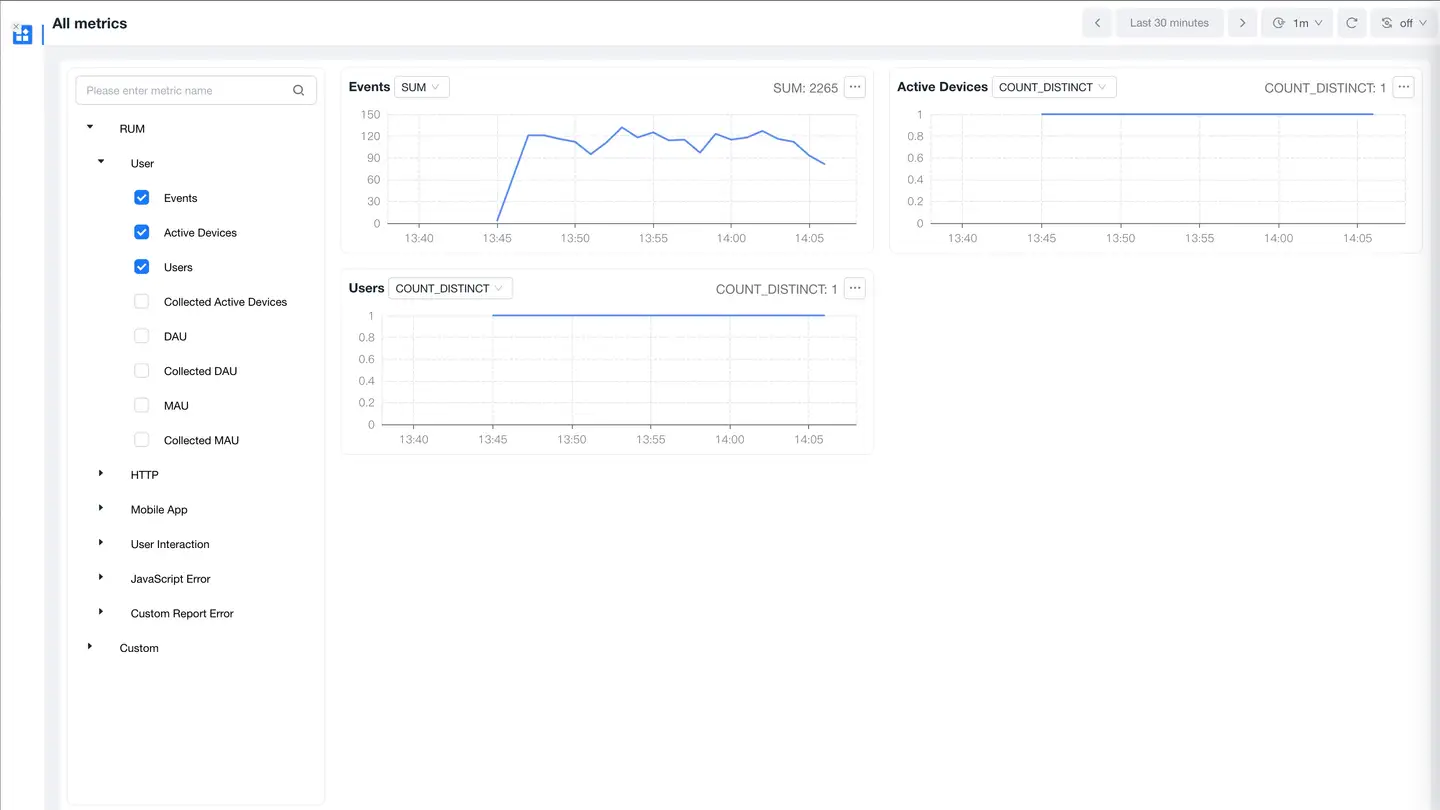
Displays trend charts of performance metrics. You can filter and analyze performance metrics as needed. Time-based performance metrics support average, P50, P75, P95, and P99 analysis, with P75 displayed by default. It supports analysis of active device count and startup count. Click on All Metrics on the right to enter the Metrics System page, which displays attribute information for each metric and supports metric search.
All Metrics
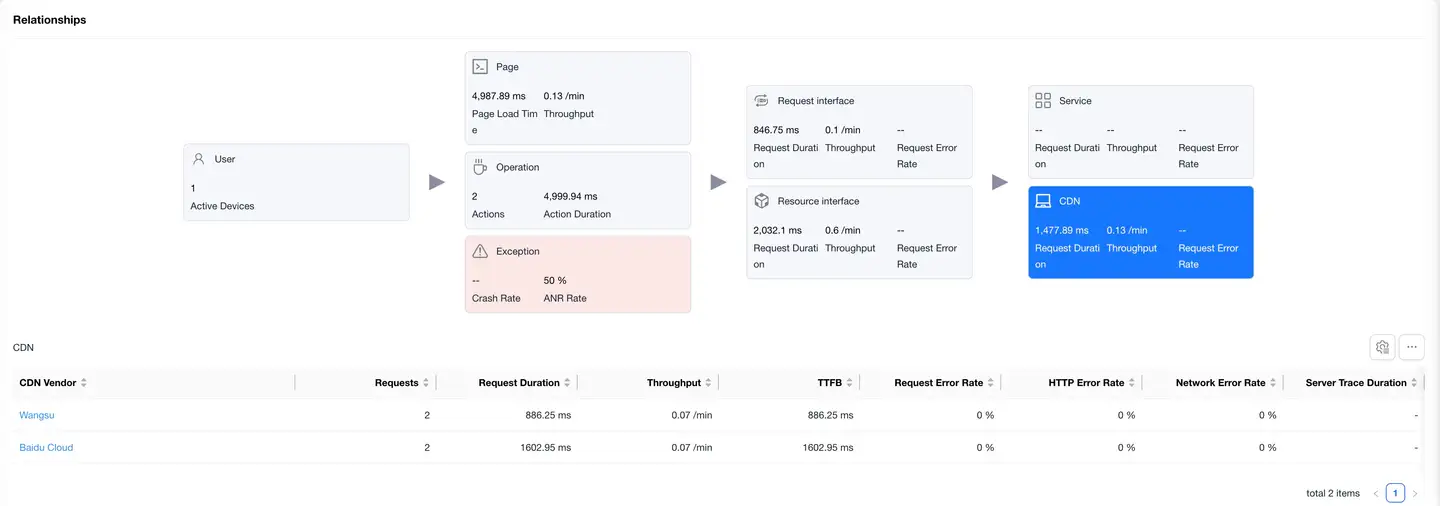
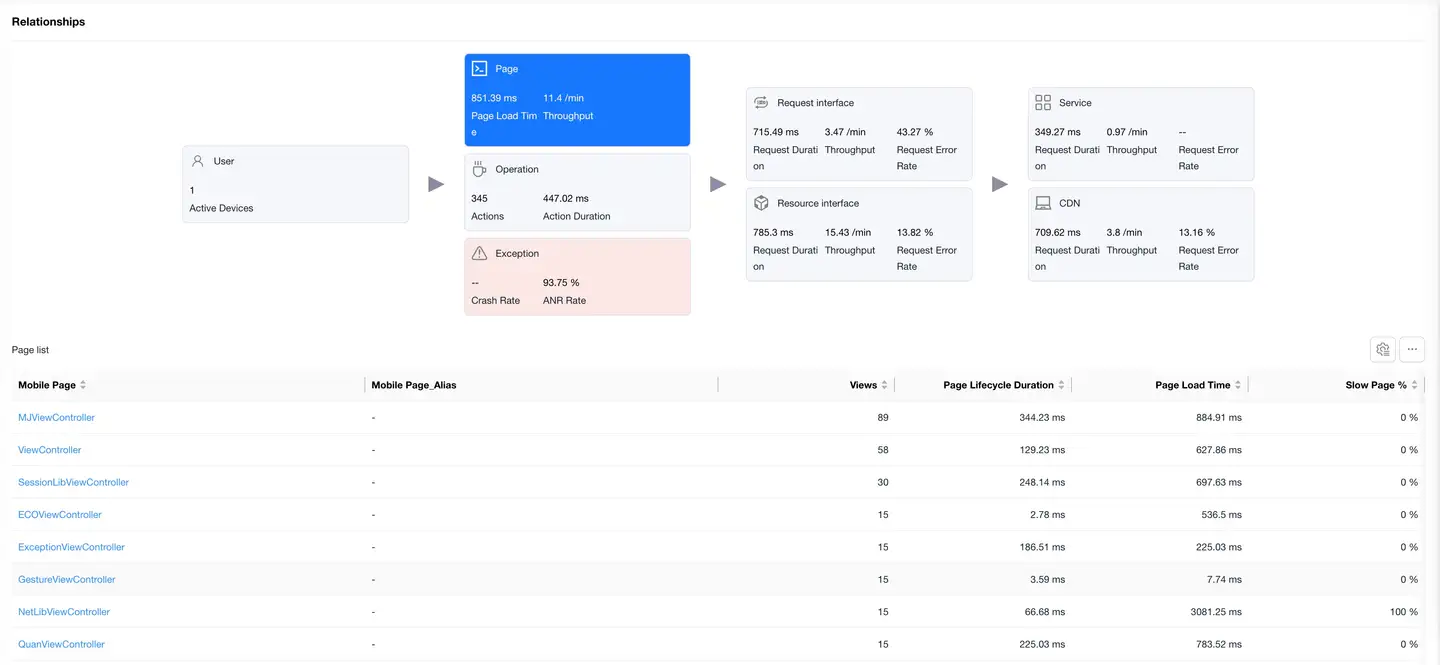
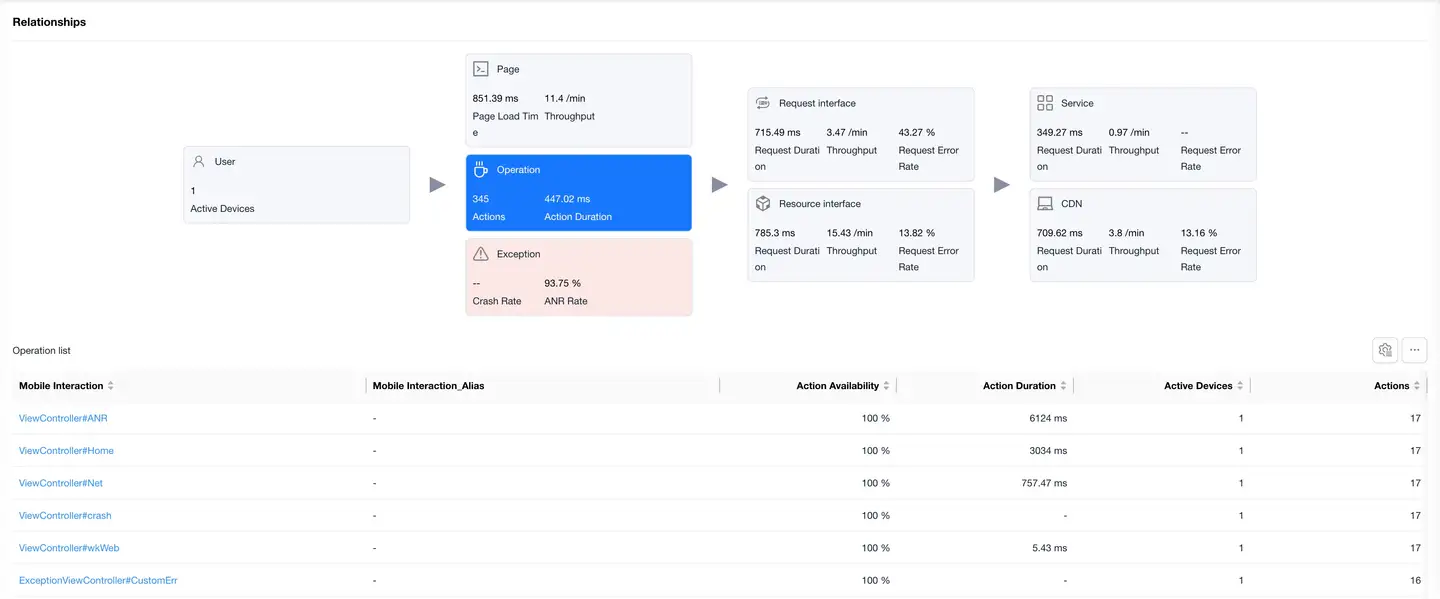
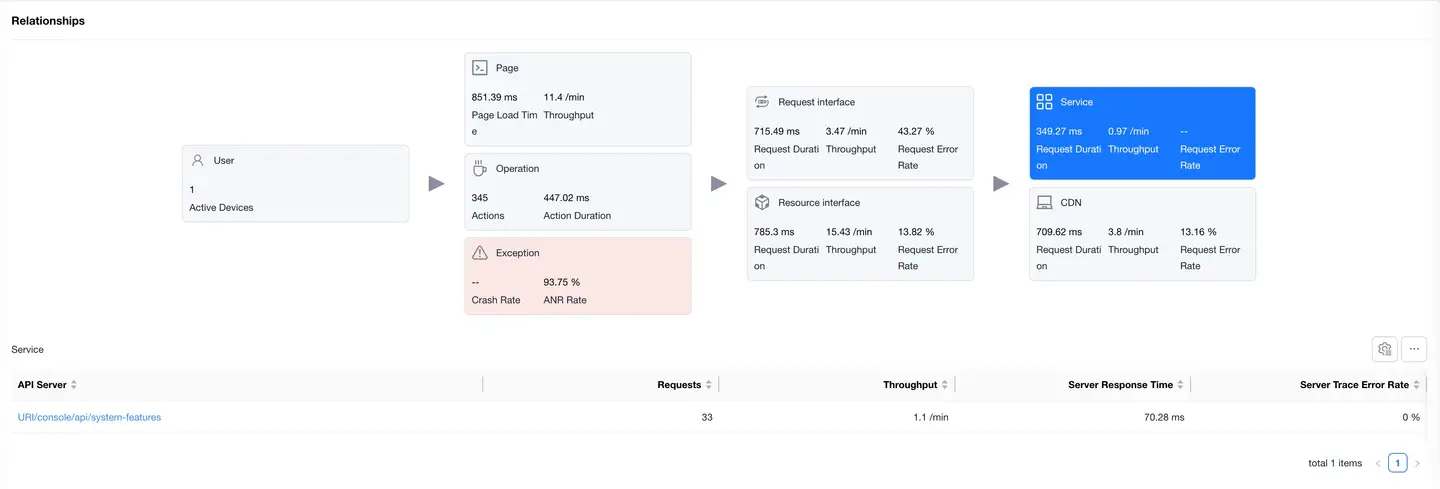
Relationship Topology
Displays the complete link between user experience and backend services, helping to analyze performance bottlenecks.
Pages
Select the Pages card to display the page performance data list. The list shows data including Mobile Page, Visit Count, Page Lifecycle Duration, Page Load Duration, Slow Page Percentage. Click on a page in the list to enter the Page Detail Analysis, which displays detailed data for that page.
Actions
Select the Actions card to display the action performance data list. The list shows data including Mobile Action, Action Availability, Action Count, Request Count, Average Request Count, Active Device Count, Request Error Rate, Slow Action Percentage, Actions Per Minute, Failed Action Count, Failed Action User Count, Action Failure Rate. Click on an action in the list to enter the Action Detail Analysis, which displays detailed data for that action.
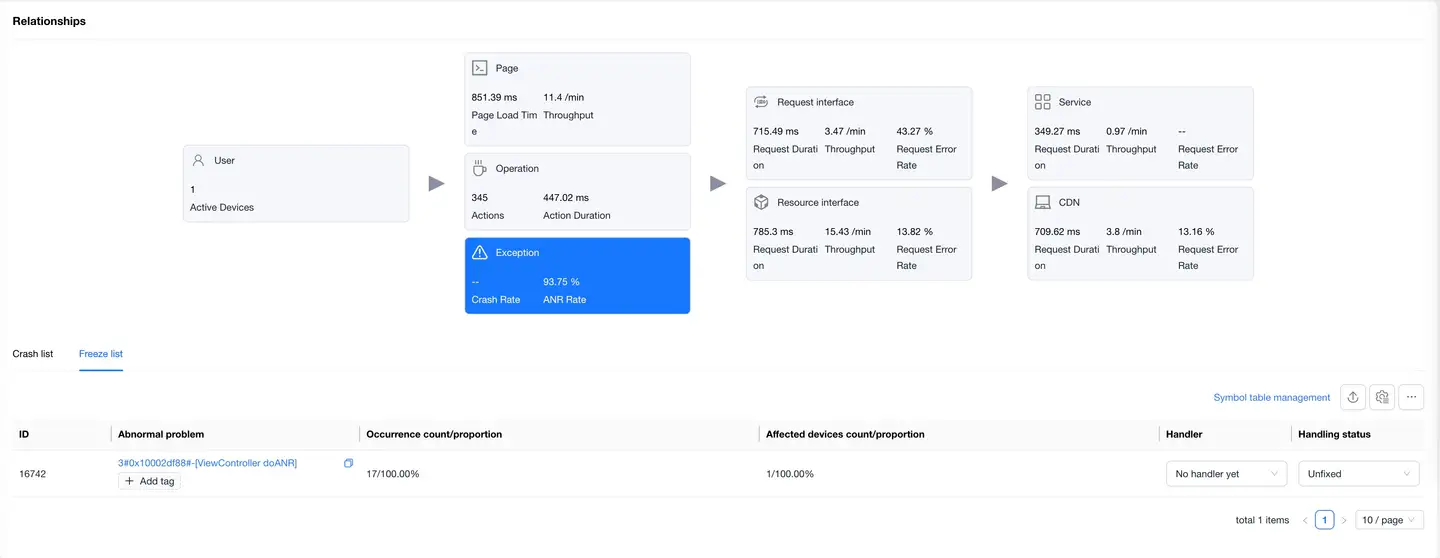
Exceptions
Select the Exceptions card to display the crash/freeze list. The list shows data including Exception ID, Exception Issue, Version, Occurrence Count/Percentage, Affected Device Count/Percentage, Handler, Handling Status. The list supports export and customizable headers, which you can configure as needed. Click on an exception issue to enter the Exception Detail Analysis, which displays detailed data for that exception.
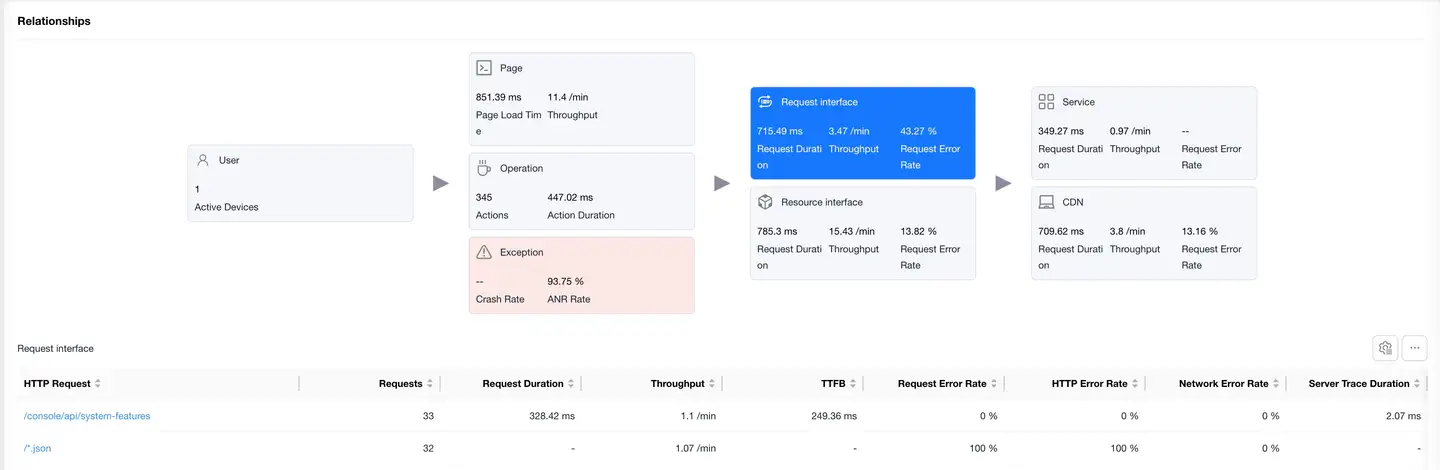
Request Interfaces
Select the Request Interfaces card to display the list of requests with "mime-type as text or json". The list shows data including HTTP Request, Request Count, Request Duration, Requests Per Minute, TTFB, Request Error Rate, Network Error Rate, Server-side Trace Duration, Slow Request Count, Slow Request Percentage, DNS Duration, TCP Duration, SSL Duration, Server Response Duration, Remaining Package Duration, Server-side Trace Error Rate, Upstream Traffic Consumption, Downstream Traffic Consumption, Availability. Click on an HTTP request to enter the Request Detail Analysis, which displays detailed data for that HTTP request.
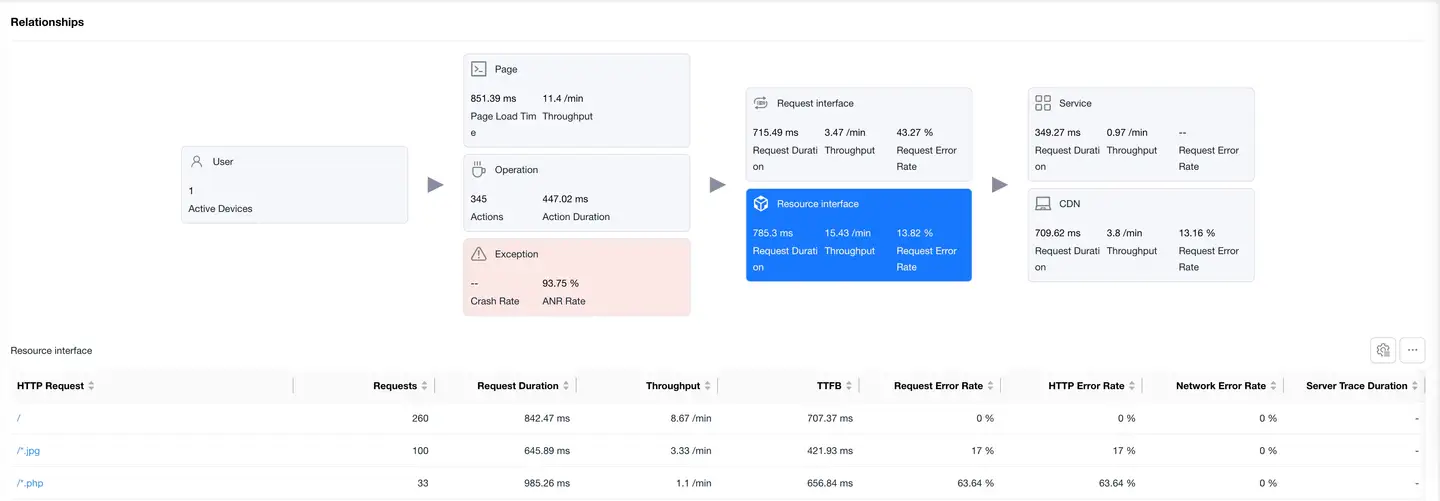
Resource Interfaces
Select the Resource Interfaces card to display the resource request data list. The list shows data including HTTP Request, Request Count, Request Duration, Requests Per Minute, TTFB, Request Error Rate, Network Error Rate, Server-side Trace Duration, Slow Request Count, Slow Request Percentage, DNS Duration, TCP Duration, SSL Duration, Server Response Duration, Remaining Package Duration, Server-side Trace Error Rate, Upstream Traffic Consumption, Downstream Traffic Consumption, Availability. Click on an HTTP request to enter the Request Detail Analysis, which displays detailed data for that HTTP request.
Services
Select the Services card to display the backend service list "requires backend to embed TingYun APM Agent". The list shows data including Backend Service, Request Count, Requests Per Minute, Server Response Duration, Server-side Trace Error Rate.
CDN
Select the CDN card to display the CDN vendor data list. The list shows data including CDN Vendor, Request Count, Request Duration, Requests Per Minute, TTFB, Request Error Rate, Network Error Rate, Server-side Trace Duration, Slow Request Count, Slow Request Percentage, DNS Duration, TCP Duration, SSL Duration, Server Response Duration, Remaining Package Duration, Server-side Trace Error Rate, Upstream Traffic Consumption, Downstream Traffic Consumption, Availability. Click on a CDN vendor name to enter the CDN Detail Analysis, which displays detailed data for that CDN vendor.