Action Analysis
User actions are an important component of the user experience module. Action experience analysis monitors the availability and performance of "actions" during real user usage, playing a crucial role in analyzing real end-user experience and performance. Action experience analysis provides customers with trend data displays of action availability and performance during real user operations (including action duration, blocking time, and multi-dimensional distribution charts of system versions, devices, and regions), as well as exception data analysis and tracking during operations (including slow actions, frozen actions, error actions, crashes, HTTP errors, network errors, and detailed samples of various exceptions). This has completely revolutionized the standards and methods used by APM vendors in the market to measure user experience, upgrading our product positioning from "development and operations performance analysis tools" to a business success value-oriented "user experience management platform". At the same time, the value has expanded from helping development and operations prevent risks, discover and solve performance problems, and promote internal cooperation, to helping businesses proactively ensure and optimize user experience, thereby enhancing brand favorability, user retention, business conversion rates, business achievement numbers, and business amounts.
Metrics Description
- Action Name: The specific method name of the action (Android: class name + control ID; iOS: class name + method name).
- Page: The page name to which the action belongs (Android: Activity or Fragment name; iOS: VC name).
- Action Count: The total number of times the action was executed.
- Action Duration: The total duration of the action (including the execution time of asynchronous methods).
- Blocking Duration: The execution time of the entry function during the action (users cannot perform any operations during the blocking process).
- Failed Actions: Actions where the request error rate reaches 100% during the operation (if an operation issues three requests and all three requests experience errors, then this operation is considered an error operation).
- Crash Actions: Actions during which the application crashes/exits unexpectedly.
- Smooth Actions: Actions whose duration does not reach the set threshold (default threshold is 3s).
- Slow Actions: Actions whose duration exceeds the set threshold (default threshold is 3s).
- Frozen Actions: Actions whose blocking duration exceeds the set threshold (default threshold is 3s).
- Available Action Count: Total action count - Failed action count - Crash action count.
- Availability = Available action count / Total action count
- Smooth Action Percentage = Smooth action count / Total action count
- Slow Action Percentage = Slow action count / Total action count
- Frozen Action Percentage = Frozen action count / Total action count
- Crash Action Percentage = Crash action count / Total action count
- Failed Action Percentage = Failed action count / Total action count
Action Types
Android
Click Events:
- onClick
- onItemClick
- ItemSelected
- PageSelected
iOS
Operation events other than system events:
- UITapGestureRecognizer (Single tap)
- UIPinchGestureRecognizer (Pinch with two fingers)
- UISwipeGestureRecognizer (Swipe)
- UIPanGestureRecognizer (Drag)
- UIScreenEdgePanGestureRecognizer (Swipe from right edge to left)
- UILongPressGestureRecognizer (Long press)
Controls:
- UITableView-didSelectRowAtIndexPath
- UICollectionView-didSelectItemAtIndexPath
- UIPickerView-didSelectRow
Actions
The action analysis function can monitor the online application action experience performance in real-time, helping developers quickly locate problems and optimize user experience.
Filter Conditions
You can filter by device name, device model, App version, operating system, operating system major version, region, carrier, and access method.
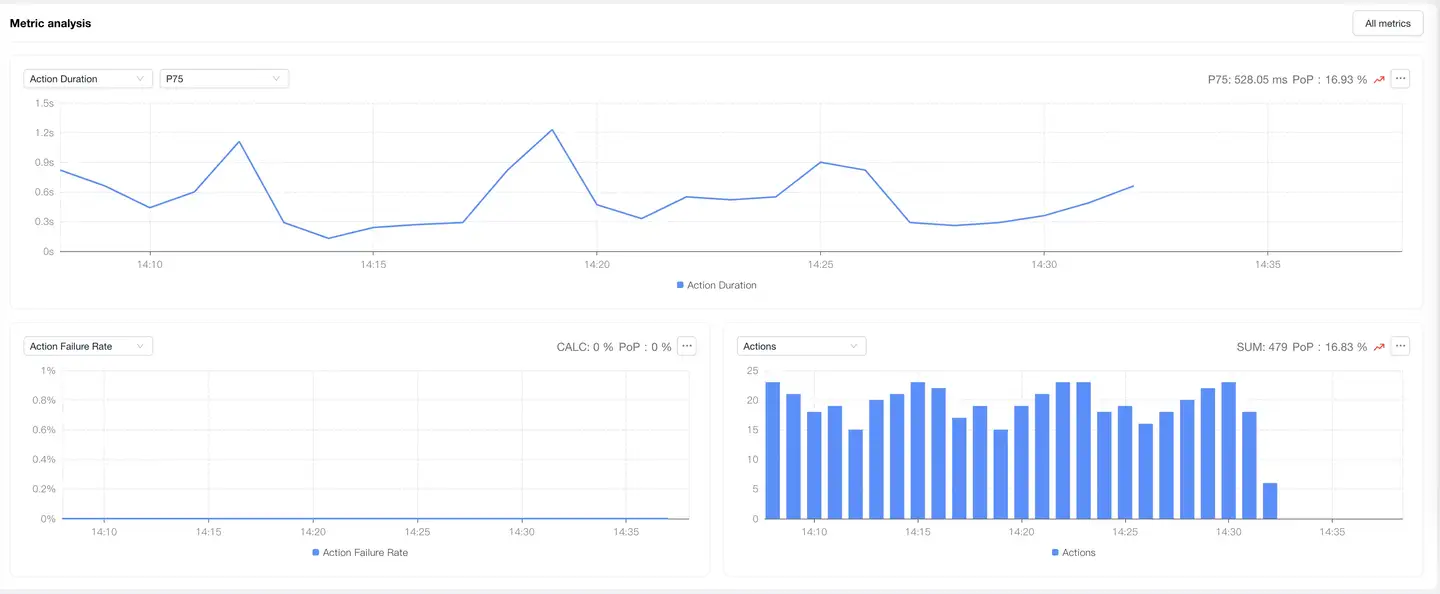
Metrics Analysis
Displays trend charts of action performance metrics under filter conditions. You can filter and analyze performance metrics as needed. Time-based performance metrics support AVG, P50, P75, P95, and P99 value analysis, with P75 displayed by default.
Dimension Analysis
Displays the distribution of action performance by region. The map can be drilled down to province/state level. After drilling down on the map, the corresponding region is added to the filter conditions, and all modules on the page display performance data after filtering. You can select action performance metrics on the left to analyze their performance across different regions. The list supports customizable headers.
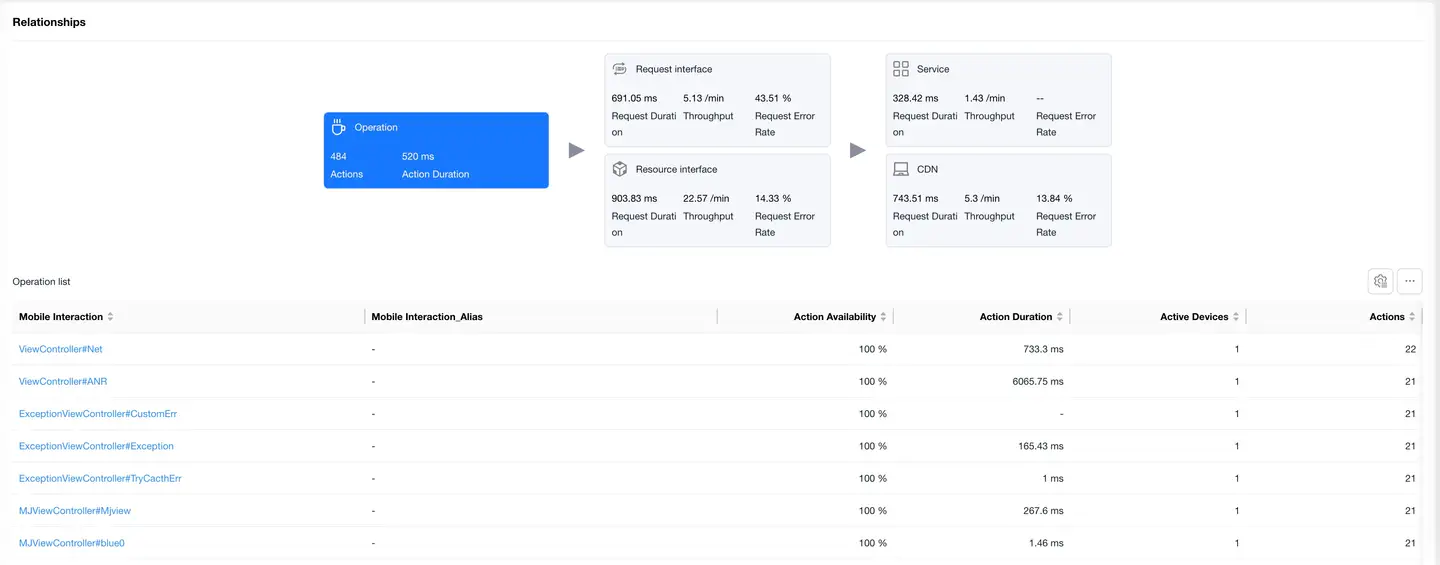
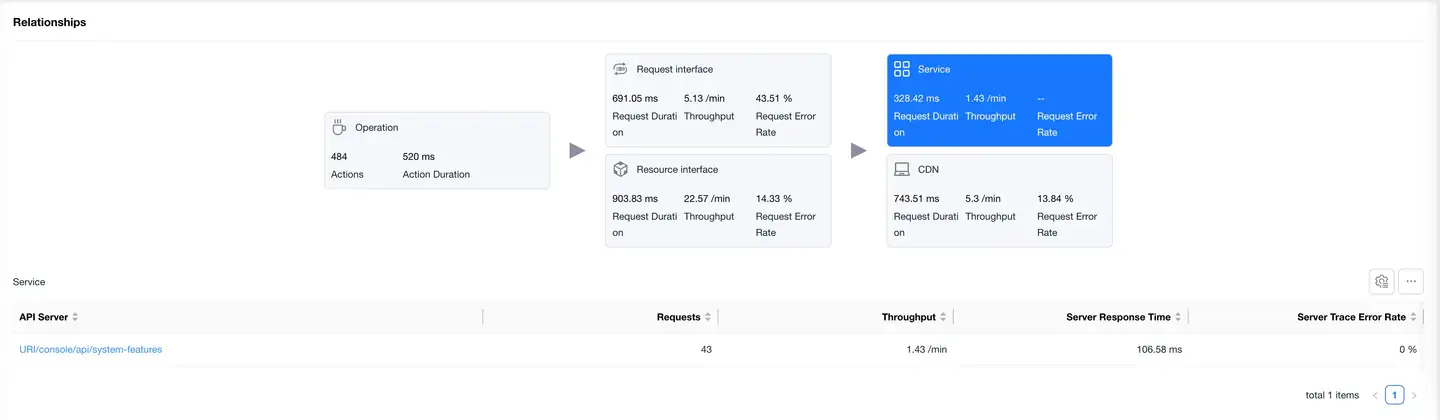
Relationship Topology
Displays the complete link between application action experience and backend services, helping to analyze performance bottlenecks.
Actions
The Actions card is selected by default, with the action performance data list displayed at the bottom. The list shows data including Mobile Action, Action Availability, Action Count, Request Count, Average Request Count, Action Duration, Active Device Count, Request Error Rate, Slow Action Percentage, Actions Per Minute, Failed Action Count, Failed Action User Count, Action Failure Rate. Click on an action in the list to enter the Action Details, which displays detailed data for that type of action.
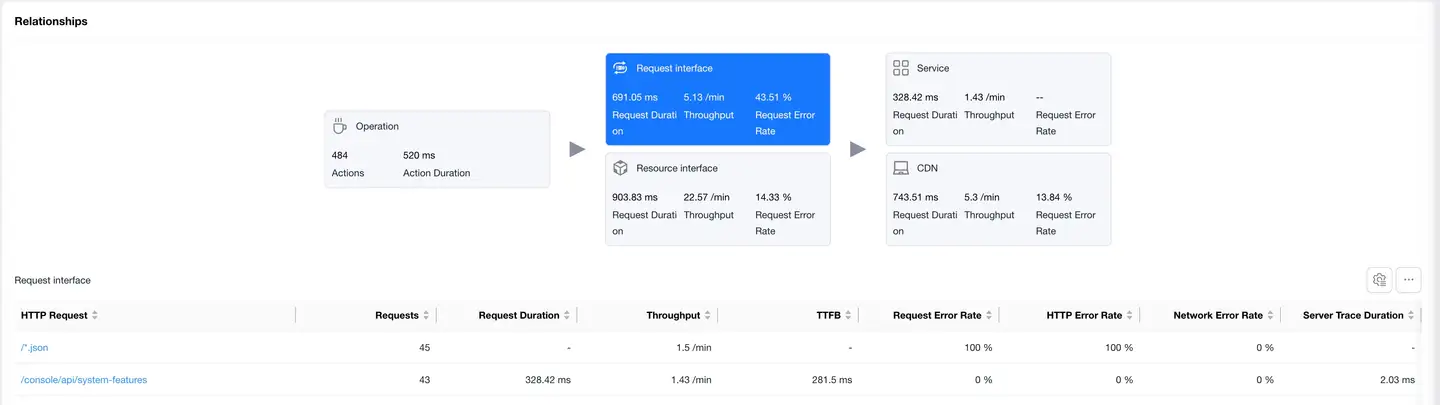
Request Interfaces
Select the Request Interfaces card to display the list of requests with "mime-type as text or json". The list shows data including HTTP Request, Request Count, Request Duration, Requests Per Minute, TTFB, Request Error Rate, Network Error Rate, Server-side Trace Duration, Slow Request Count, Slow Request Percentage, DNS Duration, TCP Duration, SSL Duration, Server Response Duration, Remaining Package Duration, Server-side Trace Error Rate, Upstream Traffic Consumption, Downstream Traffic Consumption, Availability. Click on an HTTP request to enter the Request Detail Analysis, which displays detailed data for that HTTP request.
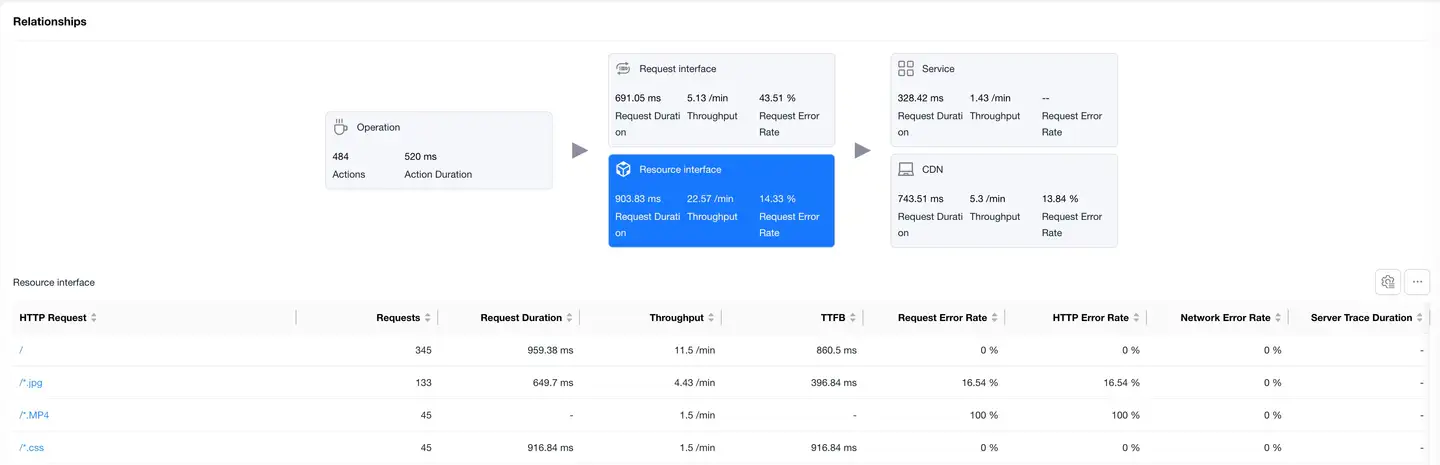
Resource Interfaces
Select the Resource Interfaces card to display the resource request data list. The list shows data including HTTP Request, Request Count, Request Duration, Requests Per Minute, TTFB, Request Error Rate, Network Error Rate, Server-side Trace Duration, Slow Request Count, Slow Request Percentage, DNS Duration, TCP Duration, SSL Duration, Server Response Duration, Remaining Package Duration, Server-side Trace Error Rate, Upstream Traffic Consumption, Downstream Traffic Consumption, Availability. Click on an HTTP request to enter the Request Detail Analysis, which displays detailed data for that HTTP request.
Services
Select the Services card to display the backend service list "requires backend to embed APM Agent". The list shows data including Backend Service, Request Count, Requests Per Minute, Server Response Duration, Server-side Trace Error Rate.
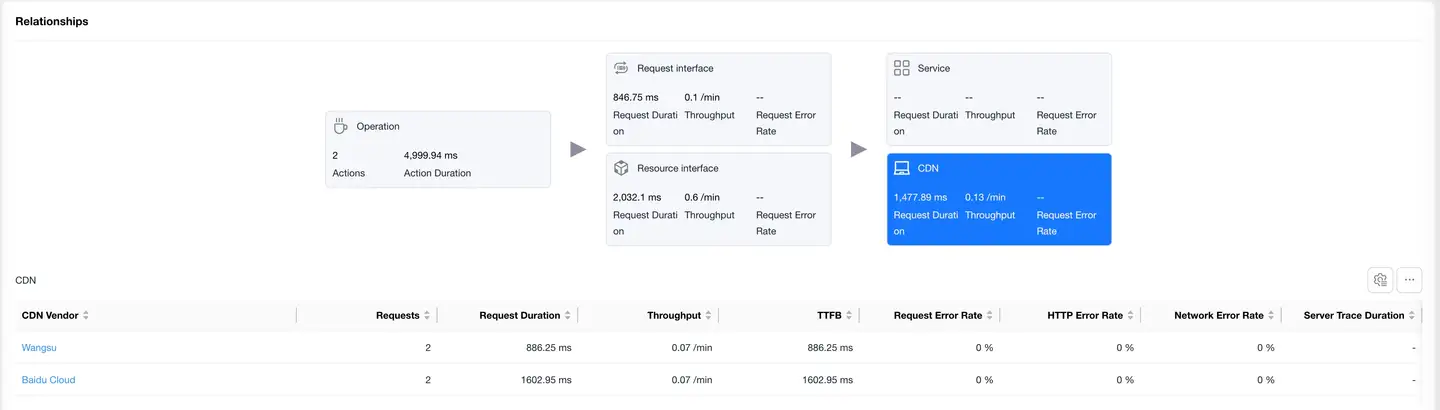
CDN
Select the CDN card to display the CDN vendor data list. The list shows data including CDN Vendor, Request Count, Request Duration, Requests Per Minute, TTFB, Request Error Rate, Network Error Rate, Server-side Trace Duration, Slow Request Count, Slow Request Percentage, DNS Duration, TCP Duration, SSL Duration, Server Response Duration, Remaining Package Duration, Server-side Trace Error Rate, Upstream Traffic Consumption, Downstream Traffic Consumption, Availability. Click on a CDN vendor name to enter the CDN Detail Analysis, which displays detailed data for that CDN vendor.
Action Details
Filter Conditions
You can filter by device name, device model, App version, operating system, operating system major version, region, carrier, and access method.
Metrics Analysis
Displays trend charts of application action performance metrics under filter conditions. You can filter and analyze performance metrics as needed. Time-based performance metrics support average, P50, P75, P95, and P99 analysis, with P75 displayed by default.
Dimension Analysis
Displays the distribution of action performance by region. The map can be drilled down to province/state level. After drilling down on the map, the corresponding region is added to the filter conditions, and all modules on the page display performance data after filtering. The list on the right supports customizable headers.
Relationship Topology
Displays the complete link between a single application action experience and backend services, helping to analyze performance bottlenecks.
- Request Interfaces
Select the Request Interfaces card to display the list of requests with "mime-type as text or json". The list shows data including HTTP Request, Request Count, Request Duration, Requests Per Minute, TTFB, Request Error Rate, Network Error Rate, Server-side Trace Duration, Slow Request Count, Slow Request Percentage, DNS Duration, TCP Duration, SSL Duration, Server Response Duration, Remaining Package Duration, Server-side Trace Error Rate, Upstream Traffic Consumption, Downstream Traffic Consumption, Availability. Click on an HTTP request to enter the Request Detail Analysis, which displays detailed data for that HTTP request.
- Resource Interfaces
Select the Resource Interfaces card to display the resource request data list. The list shows data including HTTP Request, Request Count, Request Duration, Requests Per Minute, TTFB, Request Error Rate, Network Error Rate, Server-side Trace Duration, Slow Request Count, Slow Request Percentage, DNS Duration, TCP Duration, SSL Duration, Server Response Duration, Remaining Package Duration, Server-side Trace Error Rate, Upstream Traffic Consumption, Downstream Traffic Consumption, Availability. Click on an HTTP request to enter the Request Detail Analysis, which displays detailed data for that HTTP request.
- Services
Select the Services card to display the backend service list "requires backend to embed APM Agent". The list shows data including Backend Service, Request Count, Requests Per Minute, Server Response Duration, Server-side Trace Error Rate.
- CDN
Select the CDN card to display the CDN vendor data list. The list shows data including CDN Vendor, Request Count, Request Duration, Requests Per Minute, TTFB, Request Error Rate, Network Error Rate, Server-side Trace Duration, Slow Request Count, Slow Request Percentage, DNS Duration, TCP Duration, SSL Duration, Server Response Duration, Remaining Package Duration, Server-side Trace Error Rate, Upstream Traffic Consumption, Downstream Traffic Consumption, Availability. Click on a CDN vendor name to enter the CDN Detail Analysis, which displays detailed data for that CDN vendor.
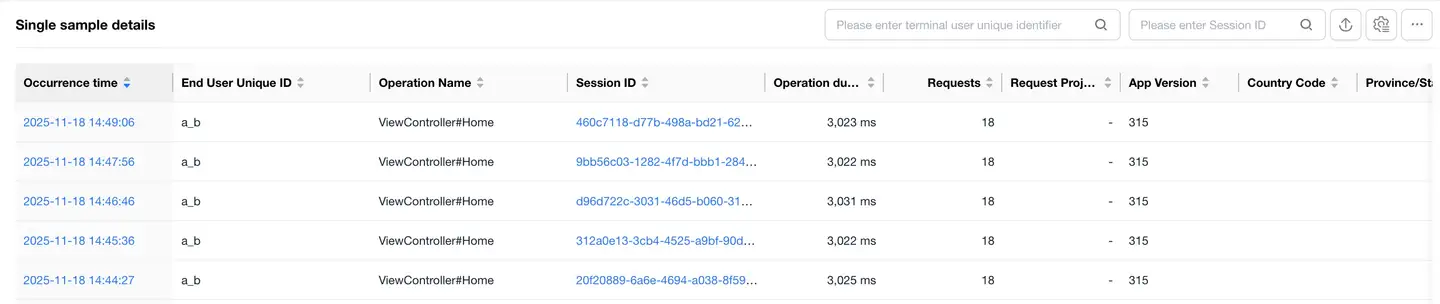
Sample Details
The details list displays all sample details for the selected action. The list shows data including timestamp "Occurrence Time", End User Unique Identifier, Session ID, Action Duration, Action Request Count, Country, Province/State, City, etc. The list supports filtering by user ID and session ID, supports export, and supports customizable headers. Clicking on the Session ID will navigate to the Session Details.
-
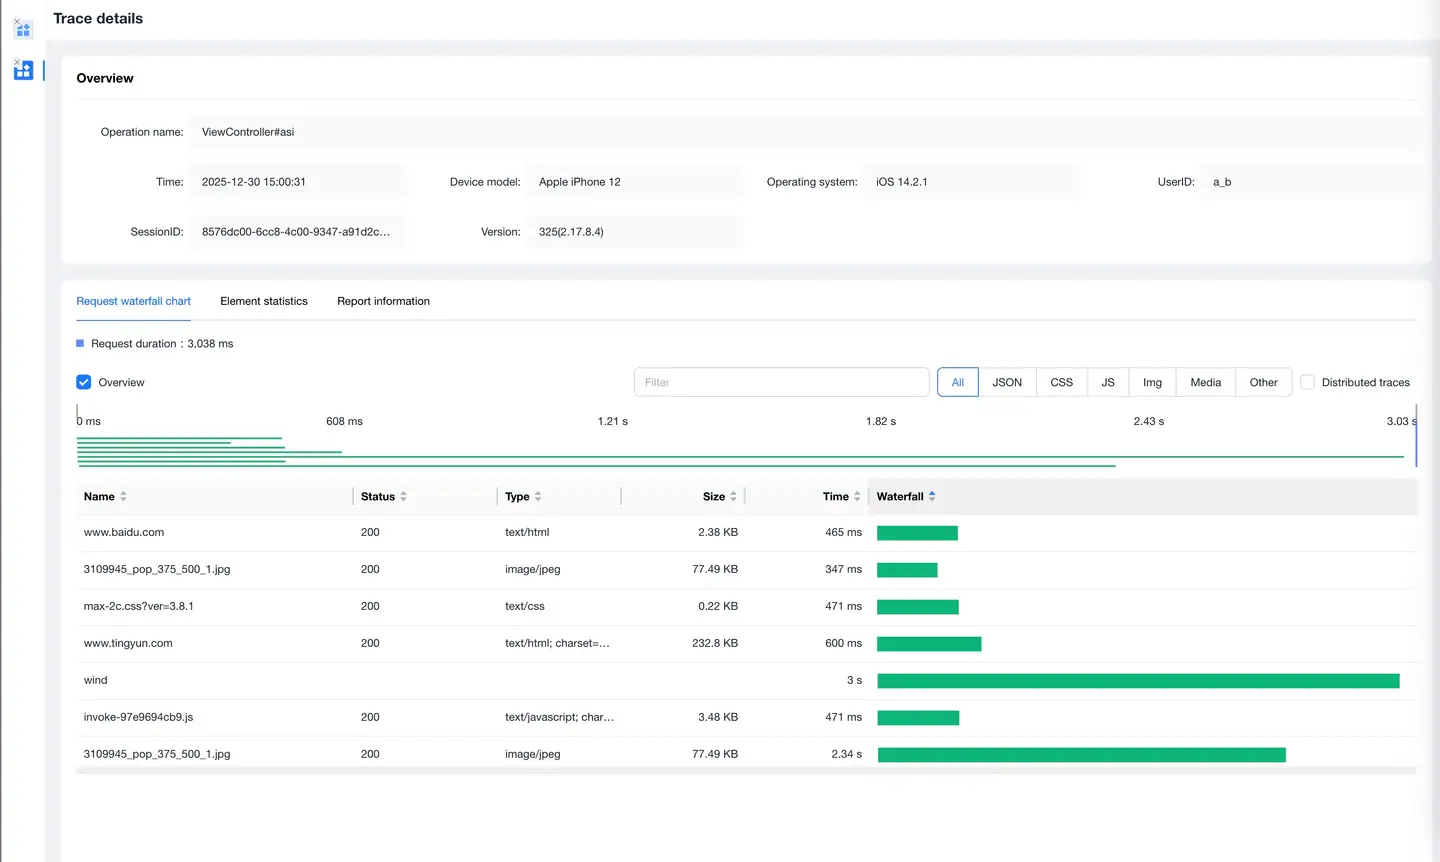
Trace Detail Tracking
Click on the timeStamp in the details list to enter the Trace Detail Tracking page, which displays the request information during the user's operation.
-
Request Waterfall
Displays the request information during the user's operation in a waterfall format, supports filtering by request type, and supports searching request URLs.
-
Element Statistics
Statistics on request volume and file transfer size by request type and domain name.
-
Reported Information
Displays the original information of the Trace Detail Tracking.
-