CDN Analysis
Note: The CDN vendor data shown in this document are internal test simulation data, used only for feature demonstration, and do not represent the actual performance of CDN vendors.
Overview
The CDN analysis feature helps operations and development teams fully understand the CDN service quality of applications, quickly identify CDN performance bottlenecks and failures, and optimize content delivery strategies. The Mobile SDK automatically identifies CDN vendors through CNAME and collects CDN request performance data in real time, providing data support for CDN selection, performance optimization, and troubleshooting.
Core Value
- Multi-Vendor Comparison: Compare the service quality of different CDN vendors horizontally to provide basis for CDN selection and adjustment
- Regional Performance Insights: Identify performance differences of CDN nodes in different regions to optimize resource allocation strategies
- Real-Time Monitoring and Alerts: Timely detect abnormal situations such as CDN availability decline and slow response
- Root Cause Analysis: Combine network detection data to quickly identify whether the problem is caused by CDN service quality or user network environment
Use Cases
Use Case 1: CDN Vendor Selection and Evaluation
When multiple CDN vendors coexist or selection is needed, compare core metrics such as network latency, availability, and transmission rate of each vendor to select the best CDN service provider.
Use Case 2: Regional Performance Optimization
When users in specific regions report slow access, quickly locate problem areas through geographic analysis and adjust CDN node coverage strategies or switch CDN vendors accordingly.
Use Case 3: CDN Failure Emergency Response
When CDN services are abnormal, quickly confirm the scope of impact through metrics such as availability and HTTP error rate, and accurately locate affected user groups in combination with the host list.
Use Case 4: Performance Optimization and Capacity Planning
Based on CDN transmission data volume, traffic trends, and other data, reasonably plan CDN bandwidth resources and optimize cost investment.
Core Features
1. Metrics Analysis
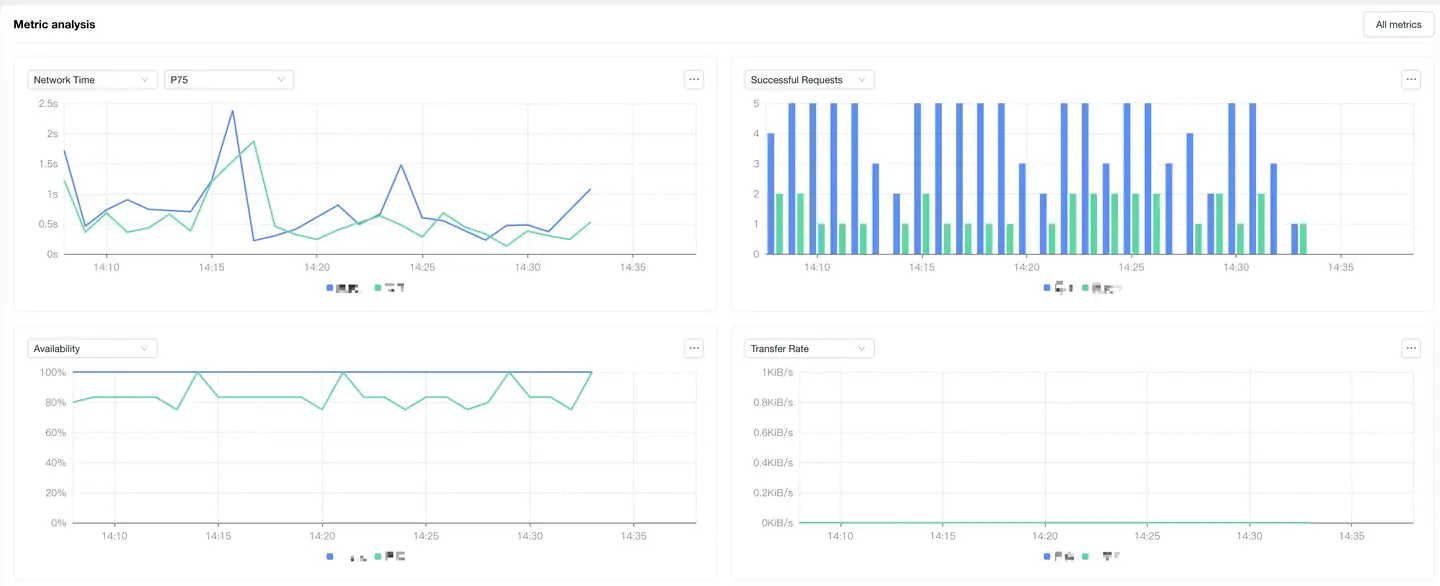
Core Metrics
Provides four core performance metrics to comprehensively evaluate CDN service quality:
| Metric | Description | Business Value |
|---|---|---|
| Network Latency | Complete network response time of CDN requests | Directly reflects user experience and is the core metric of CDN performance |
| Successful Request Count | Total number of successful CDN requests | Evaluates CDN service stability and business volume |
| Availability | CDN request success rate (successful count/total count) | Key metric for measuring CDN service reliability |
| Transmission Rate | Average speed of data transmission (KB/s or MB/s) | Evaluates CDN bandwidth quality and content delivery efficiency |
Operation Tip: Click [All Metrics] in the upper right corner to view complete network request-related metrics and trend analysis.
Auxiliary Analysis Metrics
To accurately determine the root cause of CDN performance issues, network environment detection metrics are provided:
- TCP Ping Detection Latency: Client network latency
- TCP Ping Detection Packet Loss Rate: Client network packet loss
Analysis Method:
- When CDN metrics show abnormal fluctuations, first check the auxiliary metrics
- If detection latency increases or packet loss rate increases, it indicates a user network environment problem
- If network detection is normal but CDN metrics are abnormal, it is a CDN service quality problem
Best Practice: It is recommended to combine TCP Ping detection data with CDN core metrics for analysis to avoid misjudging the root cause of problems.
2. Geographic Analysis
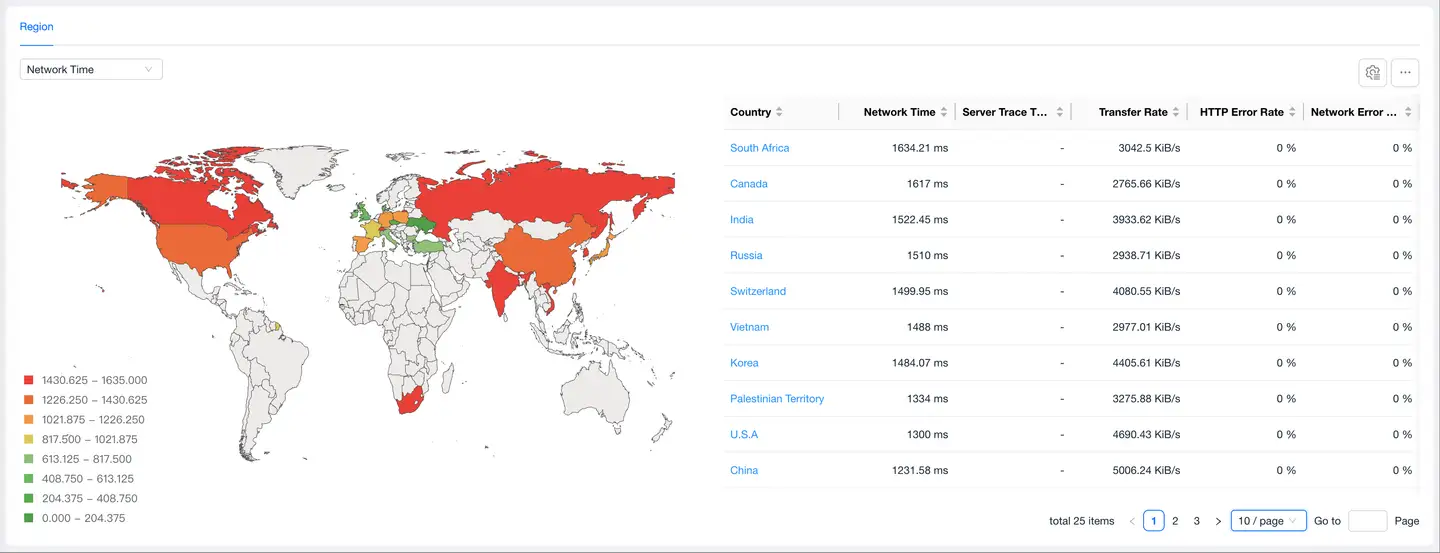
Feature Description
Visualizes CDN performance distribution across different regions through maps, helping operations teams quickly identify problem areas.
Analysis Dimensions
- Network Latency: Comparison of response times for users in different regions accessing CDN
- Transmission Rate: Data transmission speed of CDN nodes in different regions
- HTTP Error Rate: Proportion of 4xx/5xx errors returned by CDN services
- Network Error Rate: Proportion of errors at the network level (DNS, connection, timeout, etc.)
- Server-Side Link Trace Throughput Rate: Data throughput of end-to-end links
Usage
- Quickly identify performance advantages and disadvantages of regions through color depth
- Click highlighted areas on the map to add geographic dimension filter conditions
- View specific metric values in combination with the data table below
Typical Scenario: Users in a certain province report slow access → Geographic analysis finds that the network latency in that province is significantly higher than other regions → Check CDN node coverage in that region → Adjust CDN strategy or add nodes.
3. Host List
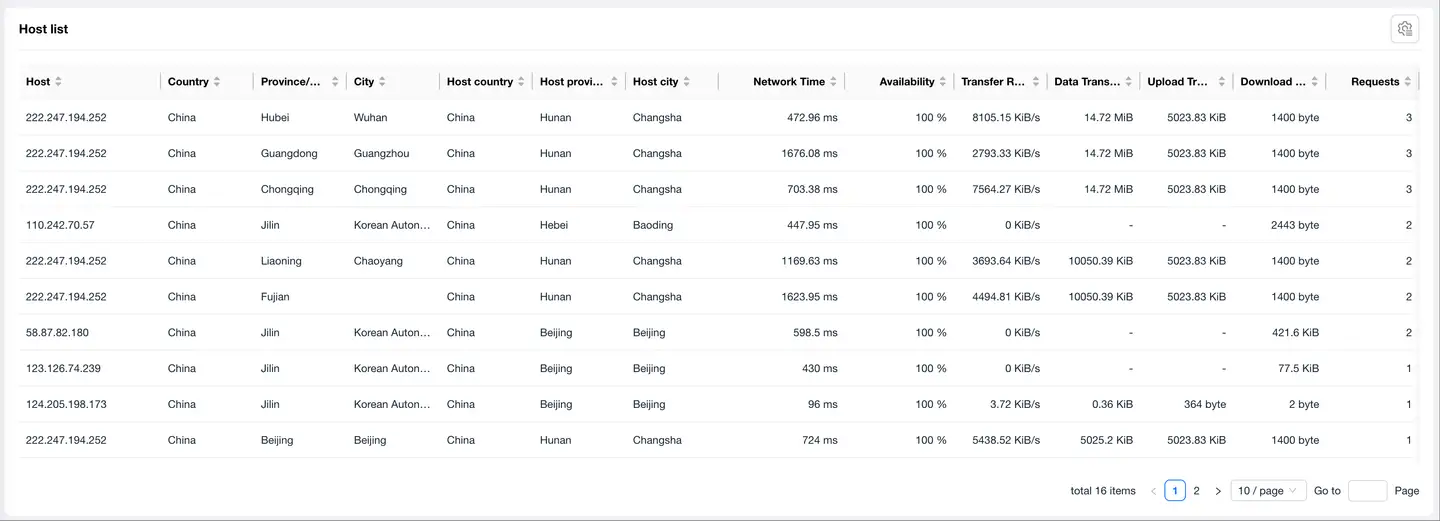
Feature Description
Displays detailed performance data of clients accessing each CDN node, supporting multi-dimensional analysis and problem localization.
Data Fields
Basic Information
- Host Address
- Geographic Location: Country, Province/State, City, ISP
- CDN Node Location: Host Country, Host Province/State, Host City, Host ISP
Performance Metrics
- Network Latency, DNS Latency, TCP Latency, SSL Latency
- Availability, Request Count, Successful Request Count
- Transmission Rate, Transmission Data Volume, Uplink Traffic, Downlink Traffic
Abnormal Metrics
- HTTP Error Count
- Network Error Count
- Server-Side Link Trace Throughput Rate
Application Scenarios
- Fault Localization: Quickly find CDN nodes with high latency or high error rates
- Performance Optimization: Identify hosts with high traffic but poor performance to optimize scheduling strategies
- Cost Analysis: Statistics of traffic consumption of each node to optimize CDN resource allocation
4. CDN Vendor Comparison

Feature Description
Summarizes and displays the comprehensive performance of all CDN vendors used by the application, supporting horizontal comparison of multiple vendors.
Comparison Dimensions
- Network Latency Comparison
- Availability Comparison
- Transmission Rate Comparison
- Error Rate Comparison (HTTP Errors, Network Errors)
- Traffic Consumption Comparison
Usage
- View key metrics of all CDN vendors in the list
- Click the vendor name to enter the detailed analysis page of a single vendor
- Quickly find vendors with the best/worst performance through sorting function
Decision Support:
- Evaluate the service quality of existing vendors before CDN contract renewal
- Dynamically adjust traffic allocation ratios of different vendors in multi-active architecture
- When a vendor's performance continues to decline, switch to backup solutions in time
Common Troubleshooting
Issue: Sudden CDN Availability Decline
Troubleshooting Steps:
- Check metrics analysis to confirm the time range of availability decline
- Check HTTP error rate and network error rate to determine error types
- Check geographic analysis to confirm if it is a specific regional problem
- Check the host list to locate specific faulty nodes
- Combine TCP Ping detection to exclude network environment factors
Issue: Users in Specific Regions Report Slow Access
Troubleshooting Steps:
- Filter the corresponding region in geographic analysis
- Compare network latency between that region and other regions
- Check the host list to examine CDN node performance corresponding to that region
- Analyze detailed metrics such as DNS latency and TCP latency to locate bottleneck links
Issue: Need to Evaluate Performance of Multiple CDN Vendors
Troubleshooting Steps:
- View core metrics of all vendors in the CDN vendor list
- Enter each vendor's details separately to view geographic distribution and time trends
- Compare the performance of each vendor in key regions
- Make decisions by comprehensively considering factors such as availability, response speed, and coverage
Best Practices
1. Set Up Monitoring Alerts
It is recommended to set alert thresholds for the following metrics:
- CDN Availability < 99.5%
- Network Latency > 50% of Historical Average
- HTTP Error Rate > 1%
- Transmission Rate < 30% of Historical Average
2. Regular Performance Inspection
It is recommended that operations teams regularly (weekly/monthly) conduct CDN performance inspections:
- Compare performance trends of each CDN vendor
- Analyze service quality changes in key regions
- Evaluate the rationality of traffic consumption and costs
3. Multi-Dimensional Correlation Analysis
CDN analysis is not isolated. It is recommended to make comprehensive judgments by combining the following data:
- User feedback and complaint data
- Overall application performance metrics (page load time, interface response, etc.)
- Business conversion rate data (CDN performance affects business results)
4. Emergency Plan Preparation
- Configure multiple CDN vendors as backup solutions in advance
- Establish CDN failure switching processes and permission mechanisms
- Keep communication channels with CDN vendor technical support open