How Web Monitoring Works
Monitoring Principle
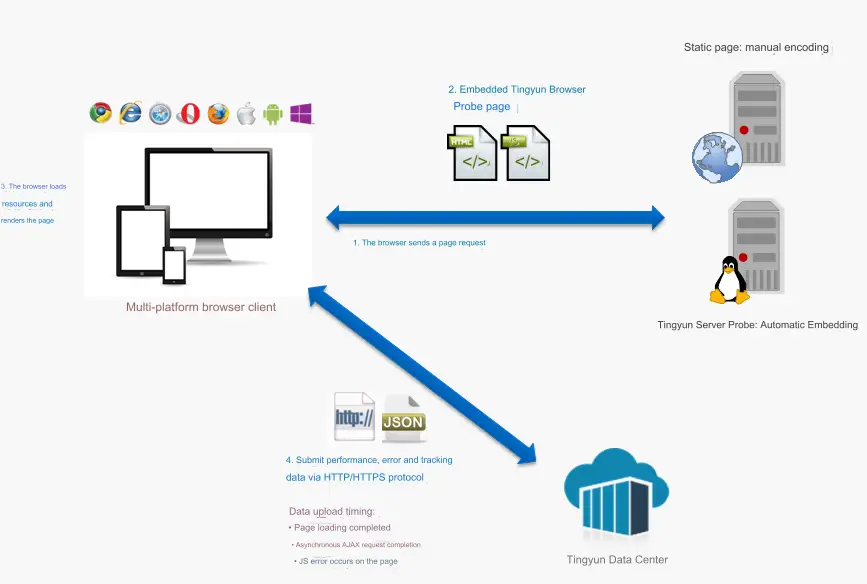
Tingyun Web obtains data by embedding JS Agents into pages. When users request pages from servers through browsers on various devices, the server returns pages embedded with Tingyun browser Agents (JS Agents). The browser records performance data such as resource loading and page rendering. The Tingyun browser Agent uploads performance data and error data to the data center through HTTP/HTTPS protocol, which then processes these data to generate visualized charts for customer analysis and viewing.
Page Performance Data Collection Principle
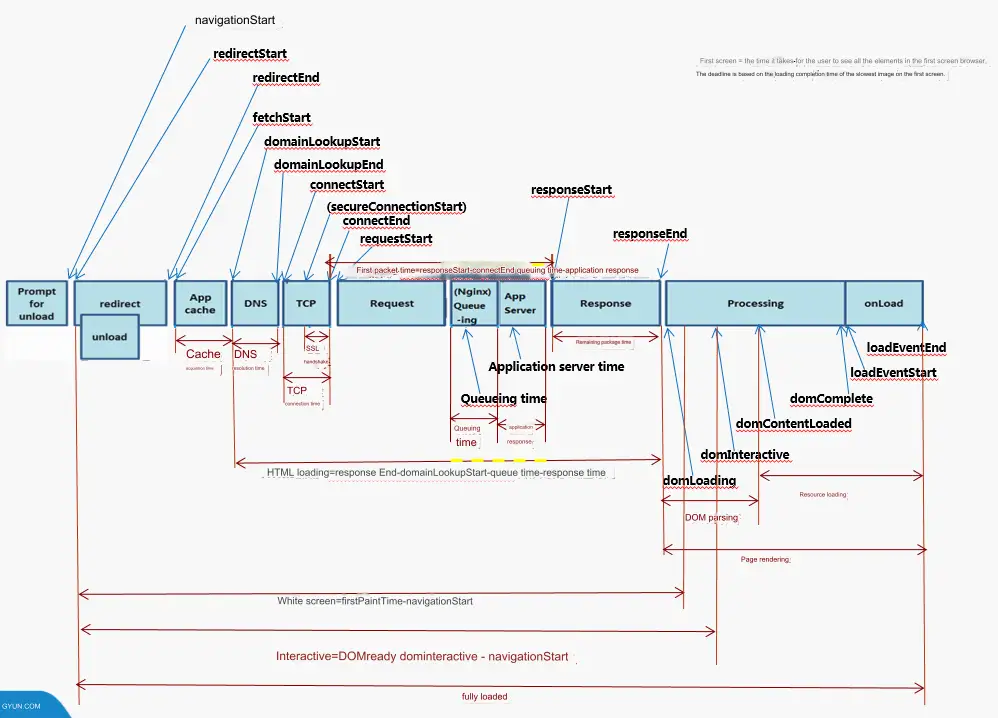
Tingyun Web uses the Navigation Timing API to obtain page performance data.
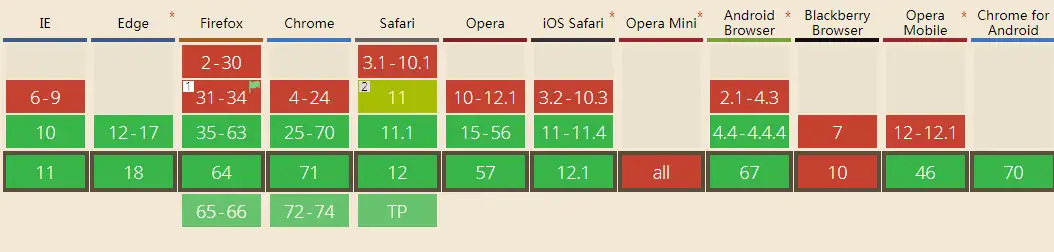
Navigation Timing API browser compatibility:
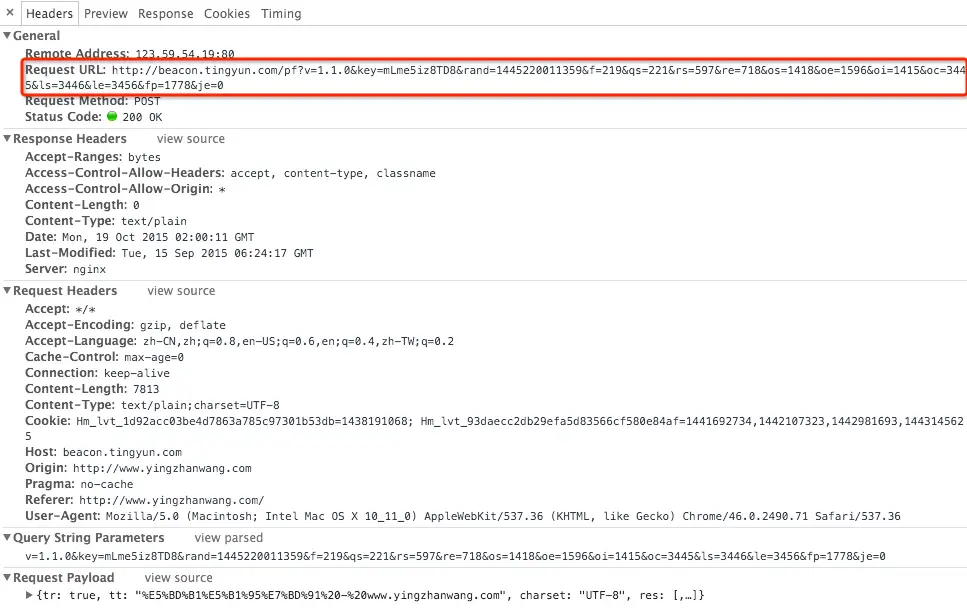
Performance data sample:
Page Tracking Data Collection Principle
Tingyun Web uses the Resource Timing API to obtain page tracking data.
When the page loading time exceeds the set tracking threshold, the system collects the following slow page performance data:
-
Page element URL
-
Element start loading and completion loading time points
-
Element DNS, TCP connection establishment, SSL handshake, first packet, remaining packets, and other timing information
-
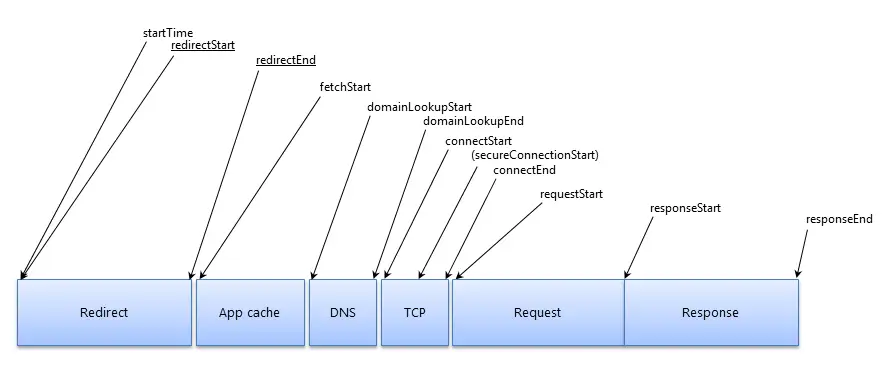
Navigation Timing event times
Resource Timing API:
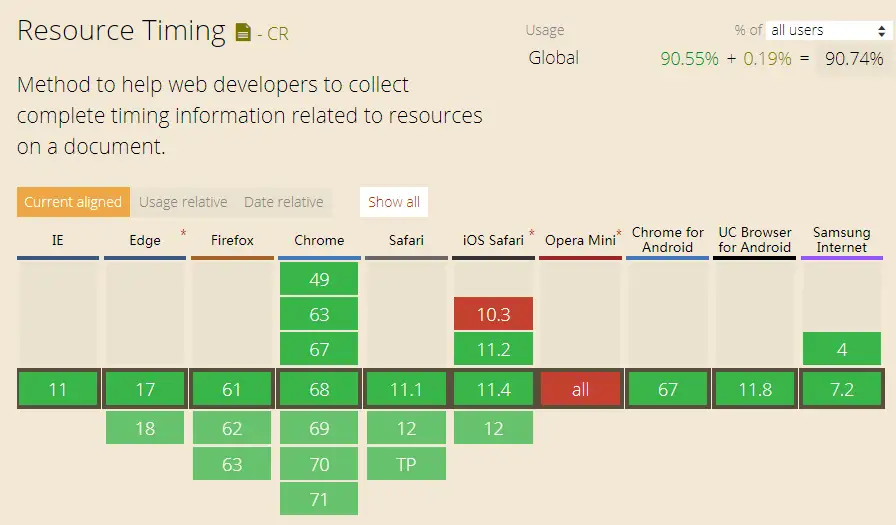
Resource Timing API browser compatibility:
JS Error Data Collection Principle
Tingyun Web uses Javascript Error Reporting to collect JS error data.
The collected JS error data includes:
-
Error page or script URL
-
Referrer page URL
-
Error Message
-
Error location: line number and column number
-
Basic browser information
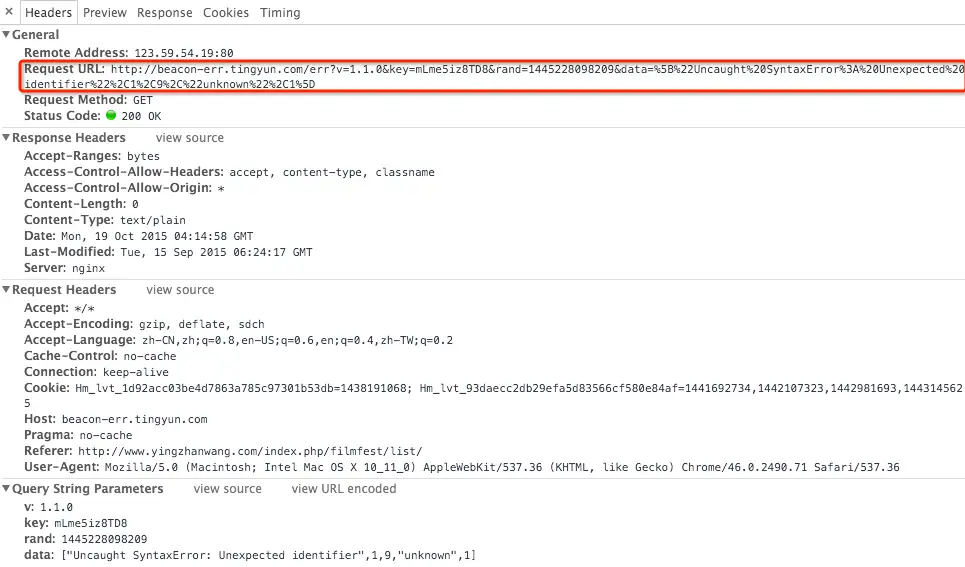
JS error data sample:
Ajax Performance Data Collection Principle
Tingyun Web uses the XMLHttpRequest (XHR) specification to obtain Ajax performance data.
The collected Ajax performance data includes:
-
Ajax request URL
-
Referrer page URL
-
Ajax request response time
-
Ajax request response code (200, 4xx, 5xx)
-
Ajax callback time
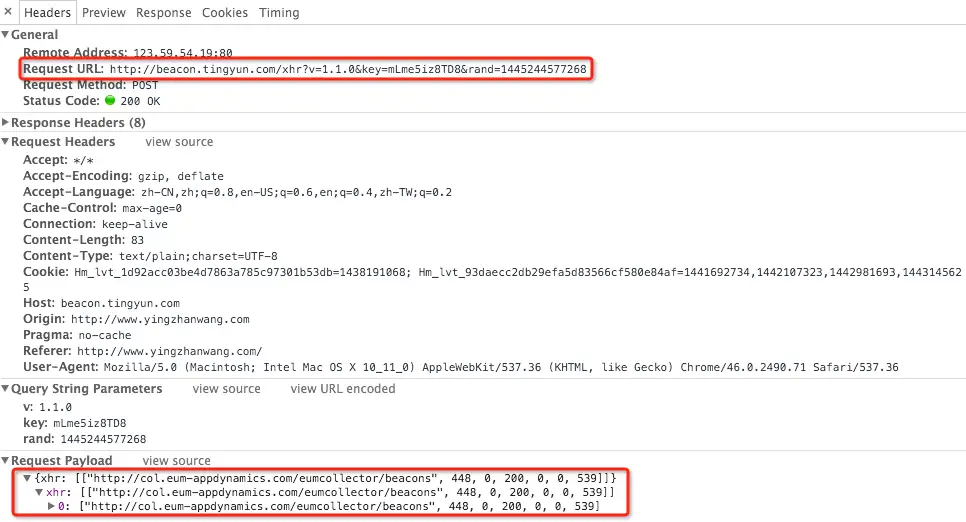
Ajax performance data sample: