Introduction
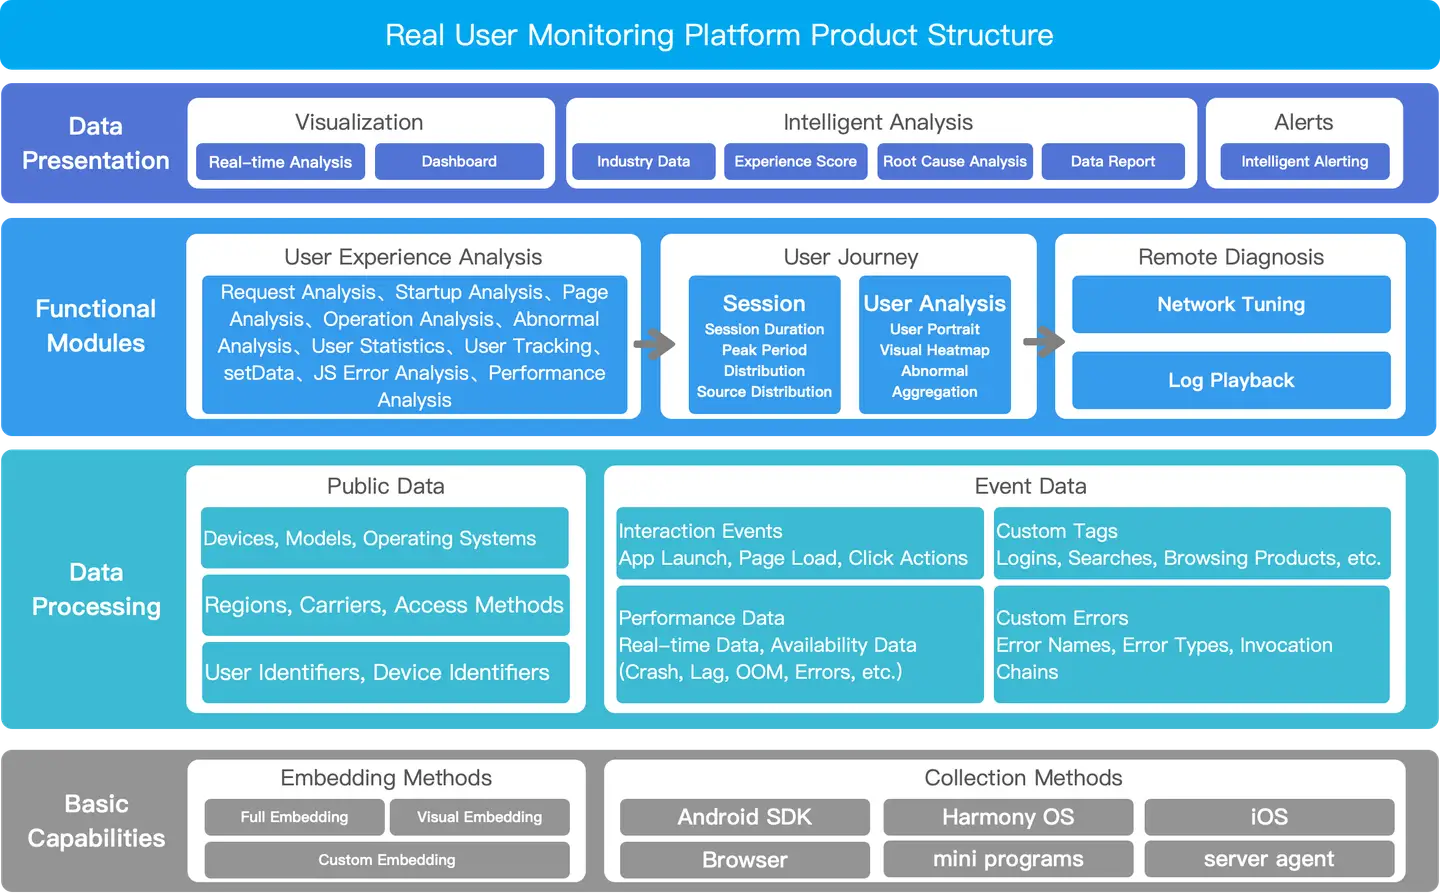
Architecture Diagram
Real User Monitoring provides comprehensive monitoring and management of all instrumented terminal applications. Through the terminal application list, users can view and manage all instrumented applications, including Mobile, Web, and Mini Program applications.
Terminal Application List
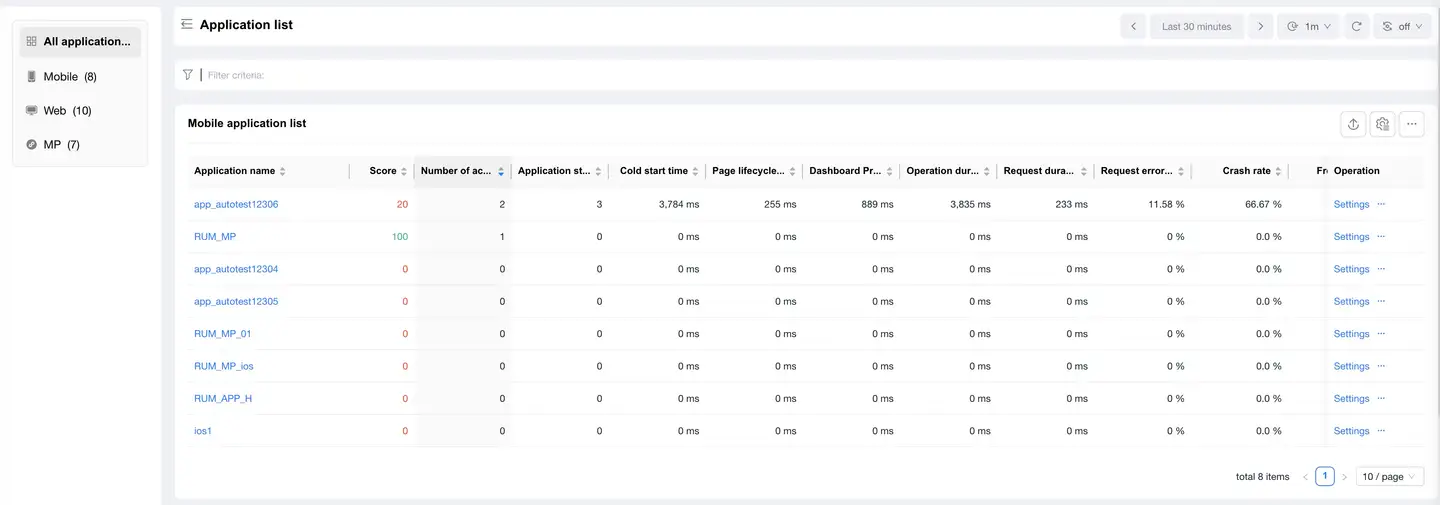
The terminal application list displays all instrumented Mobile, Web, and Mini Program applications with detailed performance monitoring data.
Application Categories
- All Applications: Displays all types of applications
- Mobile Applications: Displays mobile applications
- Web Applications: Displays web applications
- Mini Program Applications: Displays mini program applications
Functional Operations
- Create New Application: Click the "Create New Application" button in the upper right corner to create a new application
- Application Search: Supports searching by application name
- Time Filter: Supports selecting past days or specifying a custom date range
- List Refresh: Manually refresh application data
- Column Settings: Customize display columns
Monitoring Metrics
Mobile Application Metrics
- Application Name: The identifying name of the application
- Score: The comprehensive performance score of the application
- Active Devices: Number of active users
- Application Crashes: Number of times the application has crashed
- Cold Start Time: Average time taken for application cold start
- Page Lifecycle: Average time spent in page lifecycle
- Page Load Time: Average time taken for page loading
- Request Load Time: Average time taken for network requests
- Operations: Supports viewing details and configuration
Web Application Metrics
- Application Name: The identifying name of the application
- Score: The comprehensive performance score of the application
- Access Success Rate: The success rate of page accesses
- Slow Page %: Proportion of pages with loading time exceeding the threshold
- FCP: First Contentful Paint time
- LCP: Largest Contentful Paint time
- DCL: DOM Content Loaded completion time
- Operations: Supports viewing details and configuration
Mini Program Application Metrics
- Application Name: The identifying name of the application
- Score: The comprehensive performance score of the application
- Active Devices: Current number of active devices
- Launches: Number of times the mini program has been opened
- Freeze Rate: Proportion of freezes during mini program operation
- JS Error Rate: Proportion of JavaScript execution errors
- Loading Duration: Average time for mini program startup loading
- Request Duration: Average response time for network requests
- Operations: Supports viewing details and configuration
List Operations
- Supports sorting by various metrics
- Supports paginated viewing, with adjustable number of items per page
- Supports data export
- Supports batch operations