Global Topology
Feature Overview
Global Topology is a panoramic application topology diagram that can automatically discover and draw the topology structure of the entire application environment, including relationships between user experience, applications, processes, Pods, hosts, and deployment environments.
Global Topology has the following core features:
- Global View: Helps users quickly understand the overall architecture of applications, providing real-time performance metrics and event data.
- Data Correlation: Metrics, alerts, logs, and other data are interconnected, facilitating quick diagnosis and resolution of performance issues.
- Intelligent Analysis: Solves complex and changing service governance challenges in enterprises through horizontal call relationship topology and vertical dependency relationship topology.
- Automatic Discovery: Utilizes Guanyun Platform's intelligent integrated agent UniAgent to automatically discover, monitor, and topology monitor objects.
- Intelligent Diagnosis: Actively marks suspected problem nodes and root cause nodes using unsupervised knowledge graphs and decision tree algorithms.
- Deep Analysis: Integrates metric systems and tag systems for metric exploration and deep analysis.

Application Scenarios
1. Hierarchical Topology
For large-scale distributed microservice business systems, the newly designed hierarchical and layered topology diagrams can better display complex service dependencies and business call relationships, making it easier for users to grasp the overall situation faster and more conveniently.
2. Vertical Data Correlation
In addition to horizontal data correlation between applications and service components, the system can also vertically correlate multi-dimensional data such as RUM access, applications, processes, containers, hosts, and data centers, helping users quickly locate problems.
3. Dependency Relationship Mapping
Global Topology intuitively displays the hierarchical relationships of component access. Through warning rule settings, the system calculates the access health status of applications, instances, and processes, and then determines the health status of business processes.
4. End-to-End User Experience Tracking
In increasingly complex IT environments, Global Topology can automatically establish comprehensive real-time dynamic monitoring for IT teams from user terminals, backend servers, APIs, message queues, storage, etc., achieving complete user experience tracking across systems and multiple business departments.
Horizontal Topology
Horizontal Topology can display global topology diagrams of different levels:
1. User Experience Layer
Displays Web applications, App applications, and mini program applications created in the Guanyun Platform.
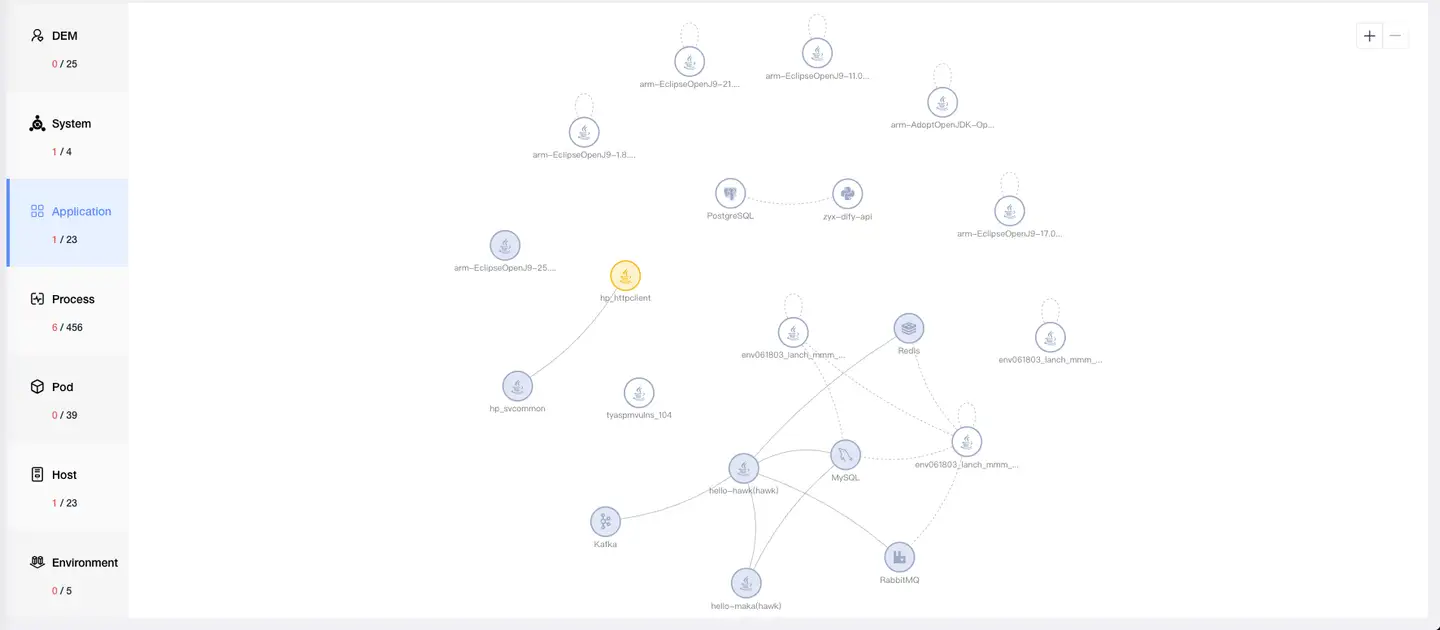
2. Application Layer
Displays all applications, database components, NoSQL components, MQ components, and external service component information under the current account, as well as call relationships between applications and components.
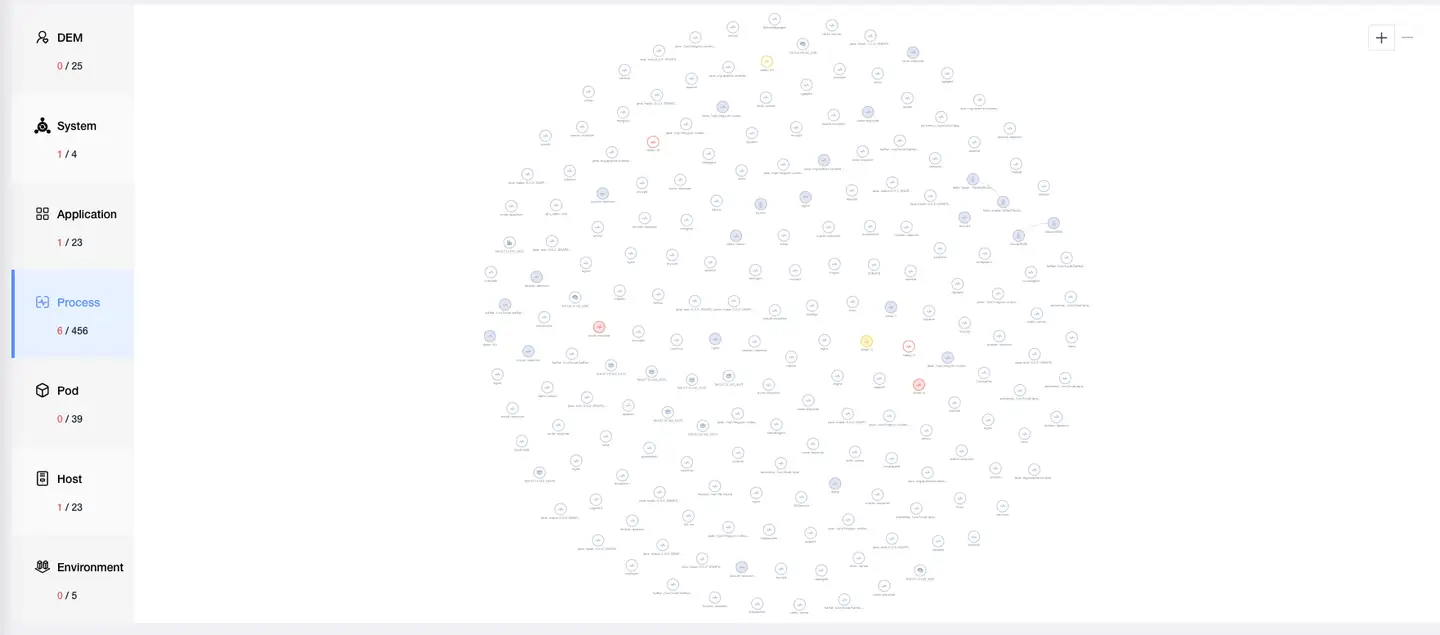
3. Process Layer
Displays all instances and processes currently running in the environment, as well as their call relationships.
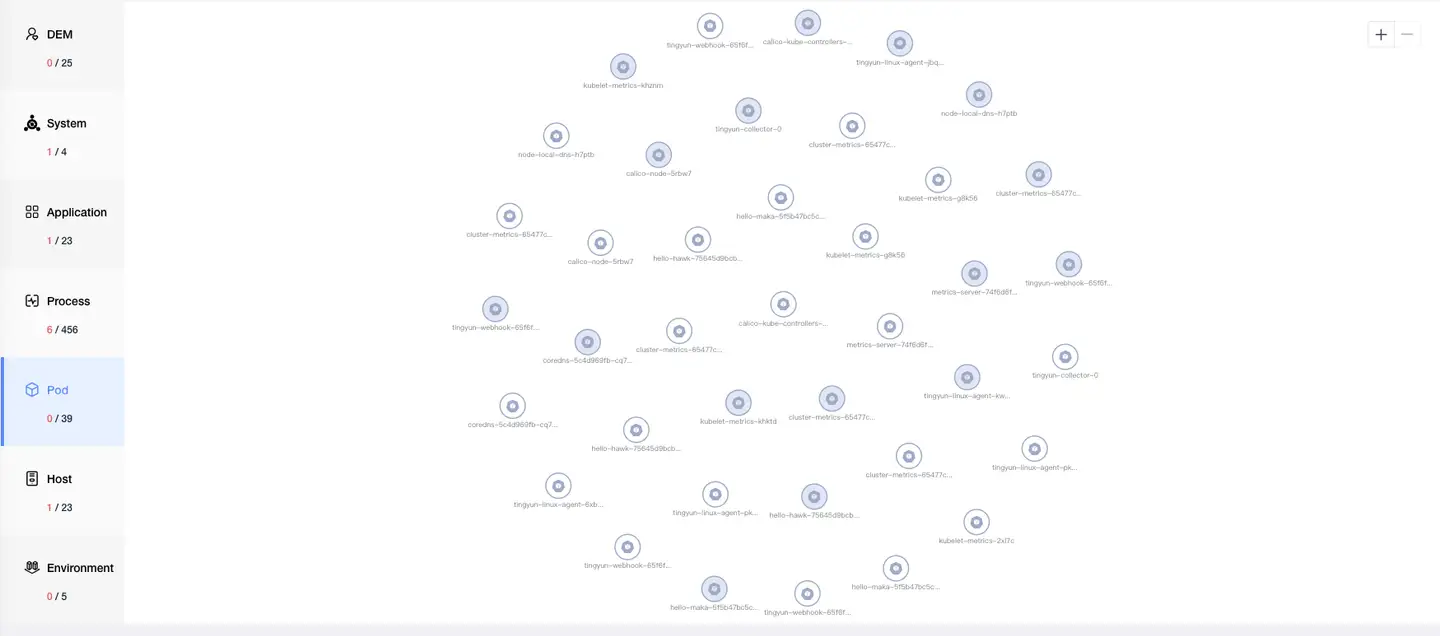
4. POD Layer
Displays PODs running in Kubernetes environments. Data is only displayed when monitoring Kubernetes environments.
5. Host Layer
Displays all hosts currently running in the environment.
6. Deployment Environment Layer
Displays all data centers where hosts currently running in the environment are located.

Application access component topology requires the following conditions:
- Collector: Version 3.6.6.0 and above
- UniAgent: Version 2.3.3.4 and above
- Kubernetes UniAgent: Version 2.4.0.3 and above
Vertical Topology
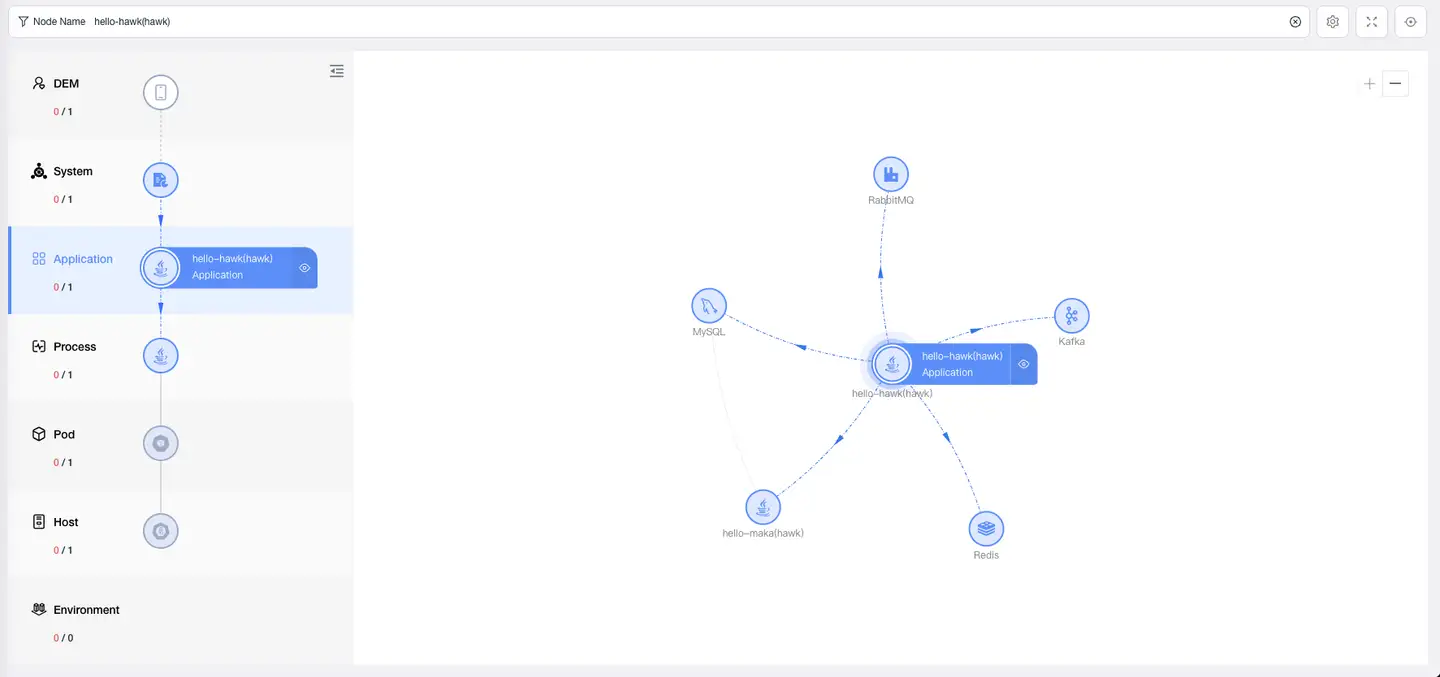
In horizontal topology diagrams, you can click any node to view its vertical topology relationships on the left. For example, when the current node is an application node:
- User Experience Layer: Displays all nodes accessing this application (Set A)
- Process Layer: All instances and related processes under this application (Set B)
- Host Layer: All hosts deploying Set B (Set C)
- Data Center Layer: All data centers deploying Set C
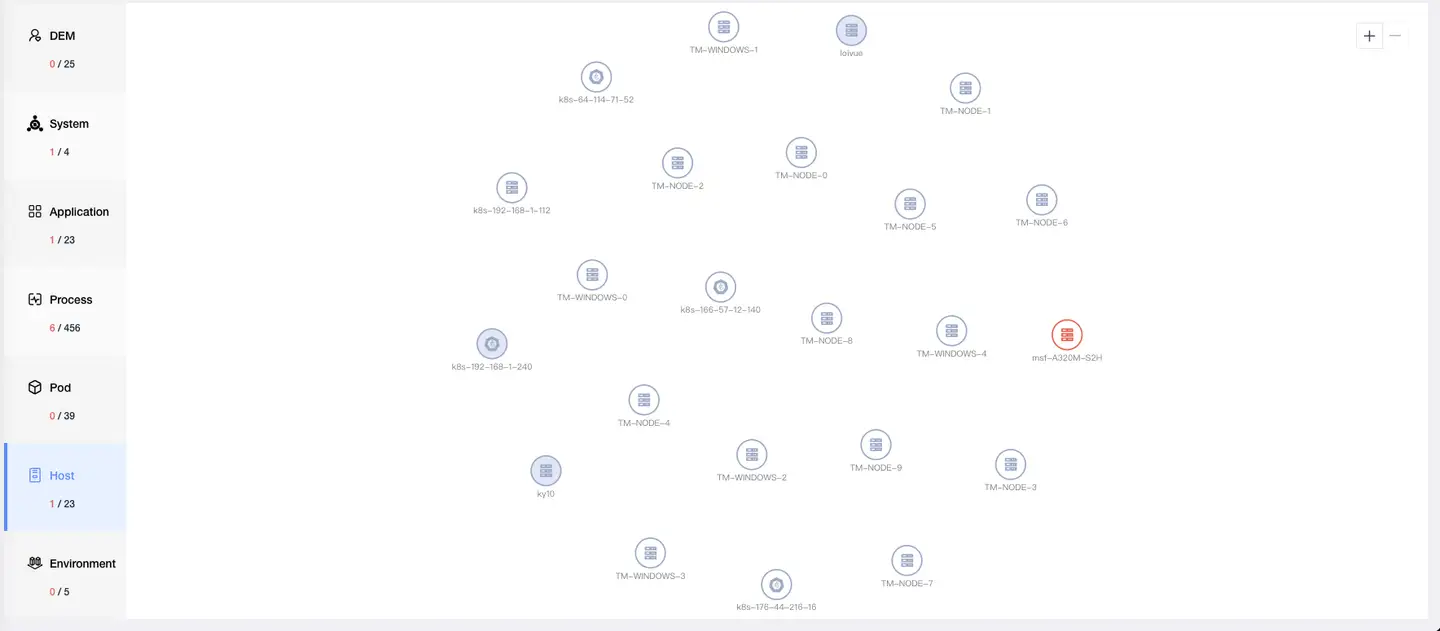
Related nodes in each layer are displayed by category by default, with node count shown under icons. Click the icon or node count to expand nodes, click node count again to collapse. Hover over the icon to view node name, type, and upper/lower layer nodes.
![]()
Topology Operation Instructions
1. Detail Analysis
Application Analysis
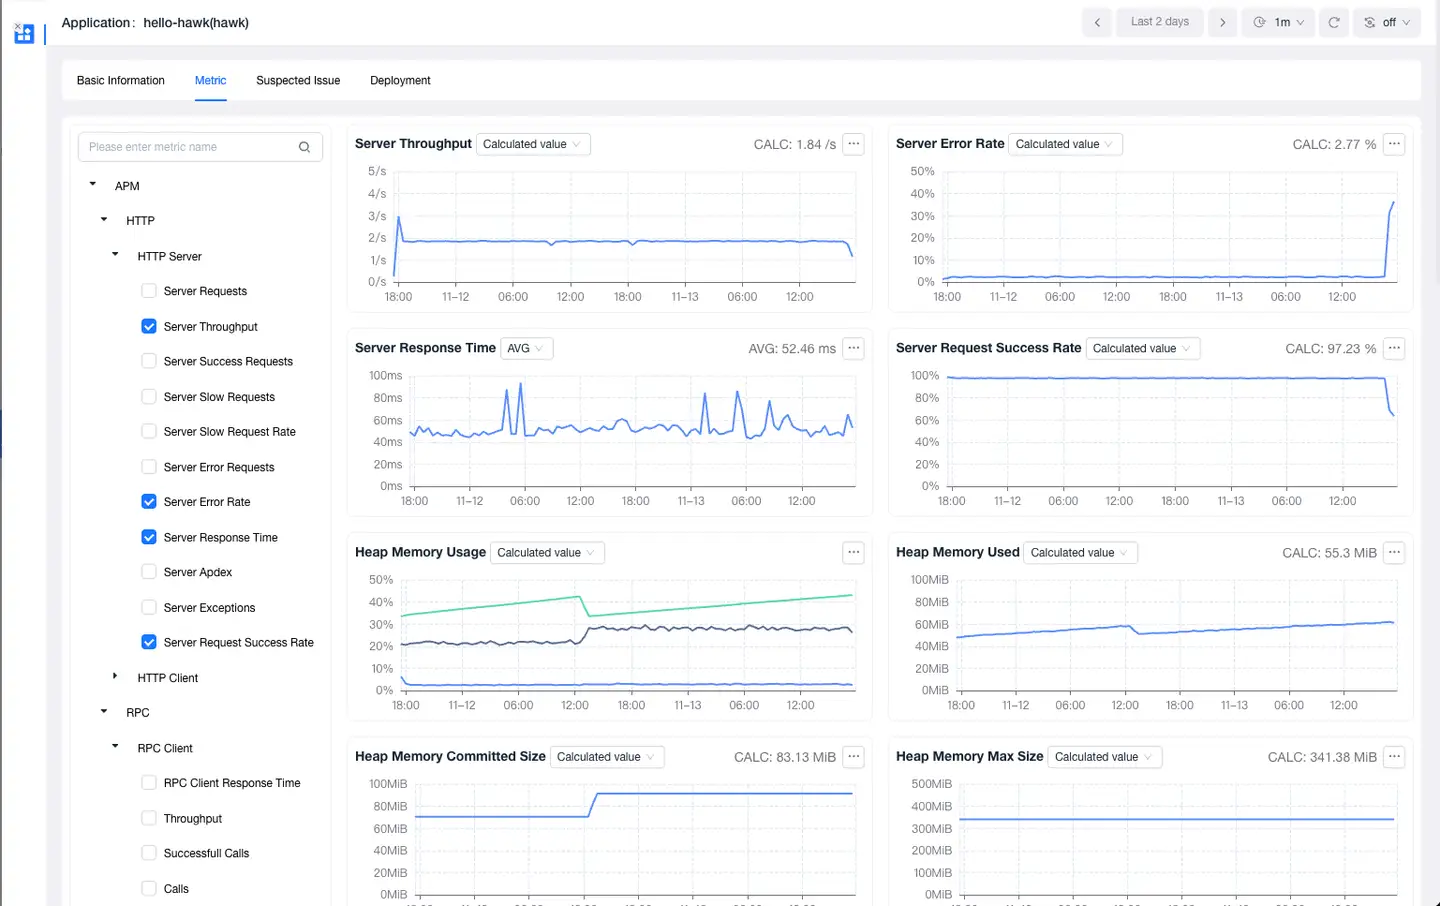
Click on an application node, and a detail icon will appear to the right of the name. Click this icon to expand the application detail panel, where you can view:
- Application alias, business system
- Median response time for Web requests and background tasks
- Throughput rate, error frequency charts
- Problems
Component Analysis
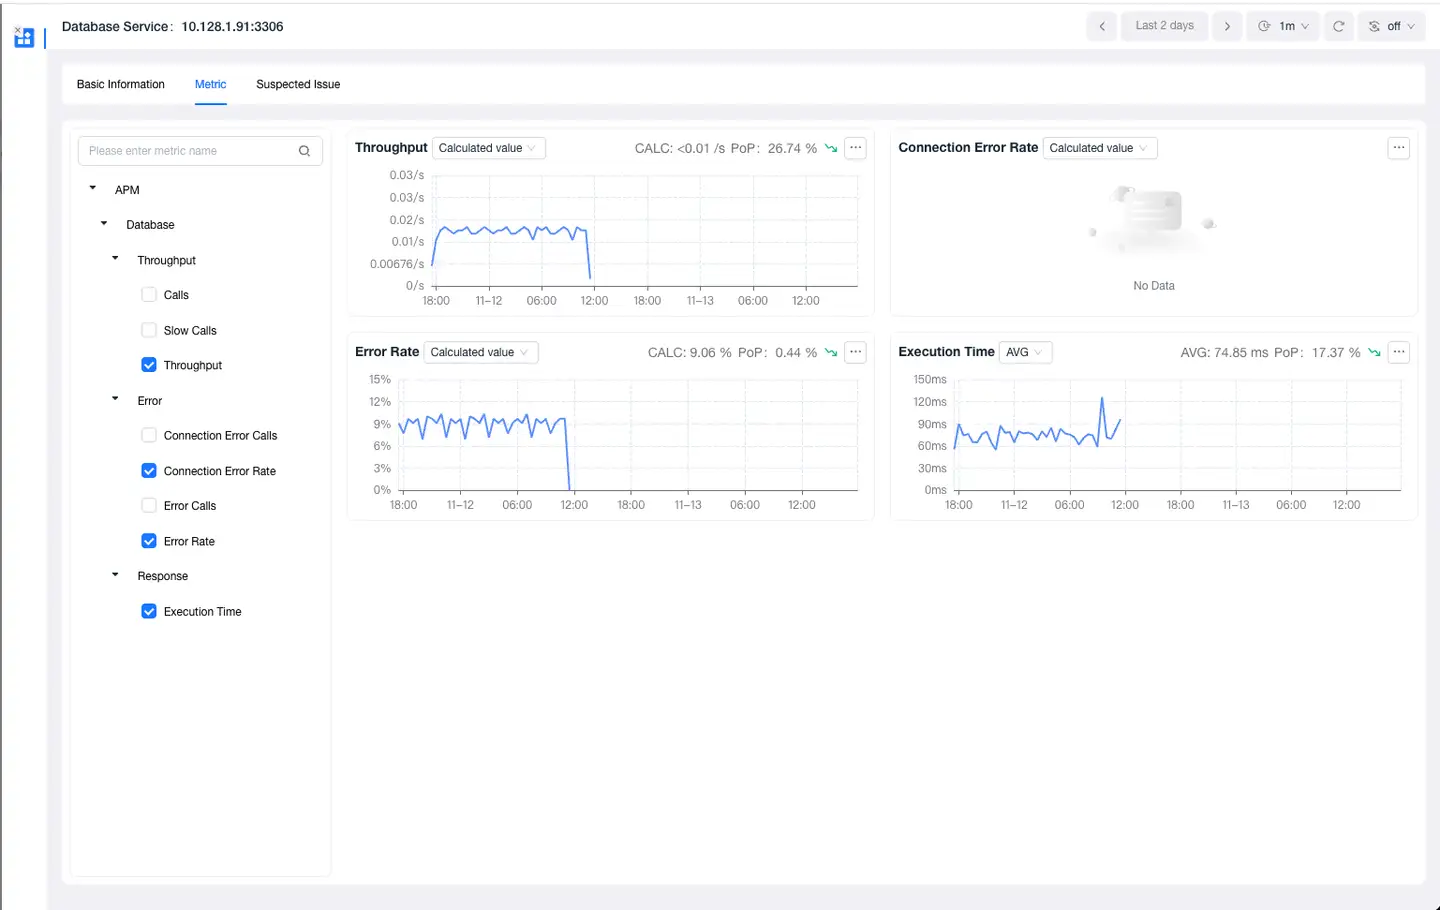
Click on a component node to view:
- Component performance list
- Problems
- Infrastructure metrics (MySQL, Oracle, Redis supported)
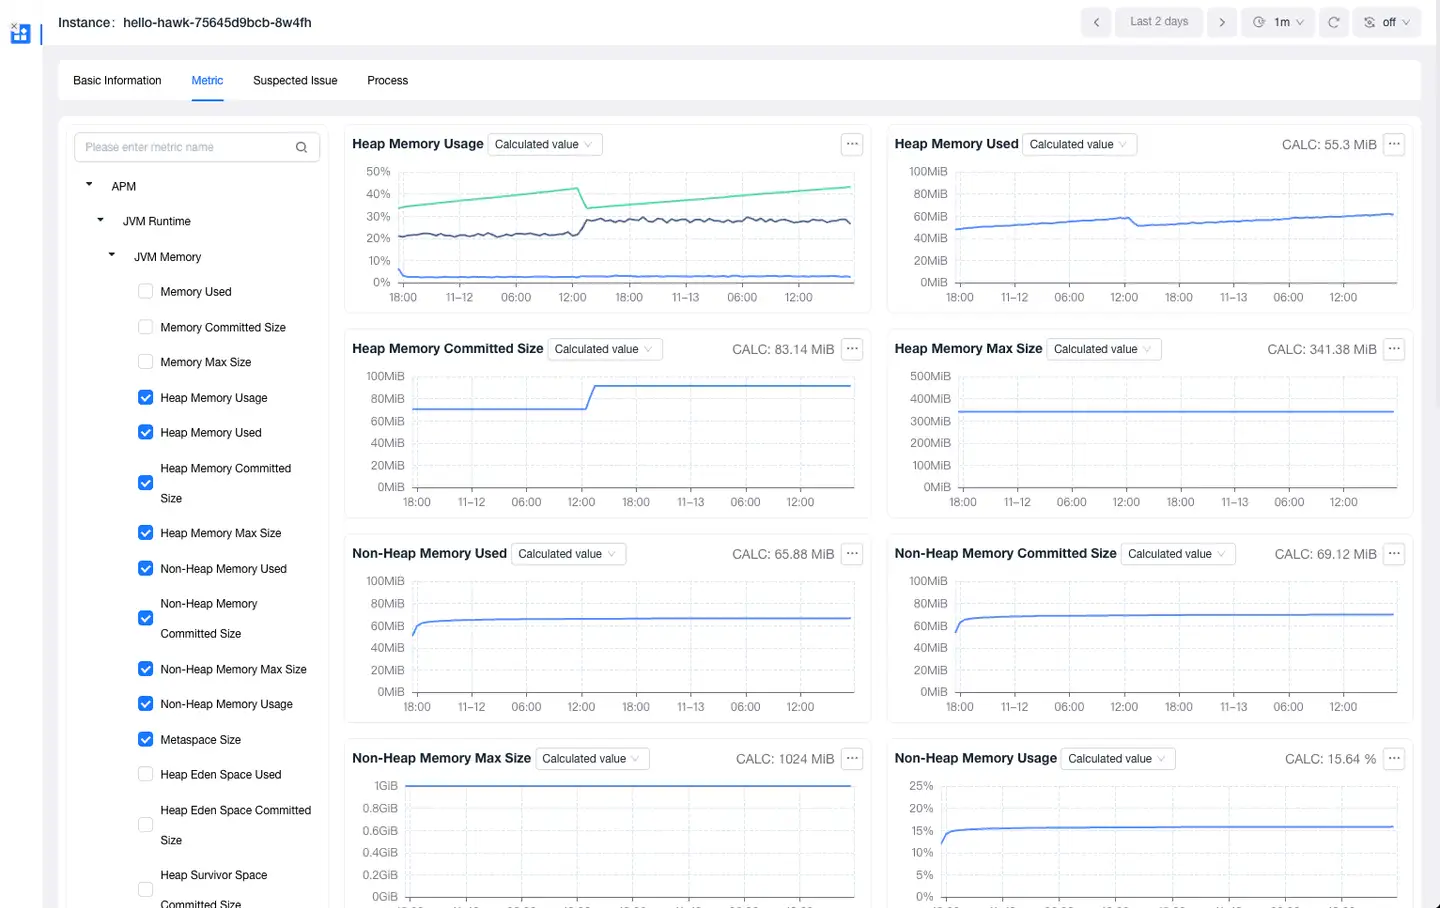
Instance Analysis
Click on an application instance node to view:
- Application name, IP address
- Technology stack, agent name
- Process name, host
- Web request and background task metrics
- Problems, process analysis, and instance logs
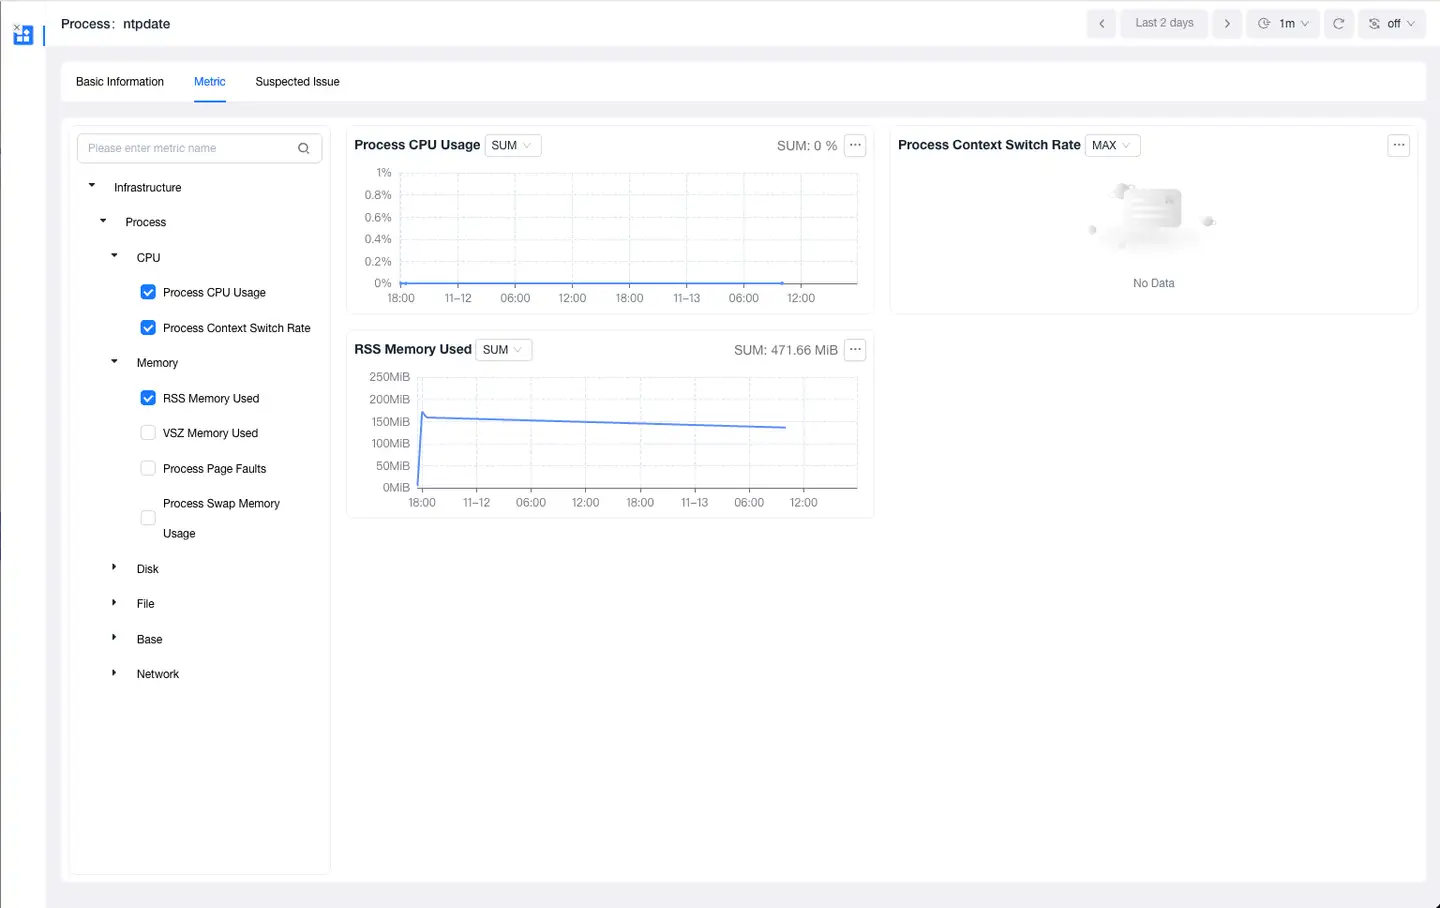
Process Analysis
Click on a process node to view:
- Process name, host
- Running duration
- Process analysis
- Problems and process logs
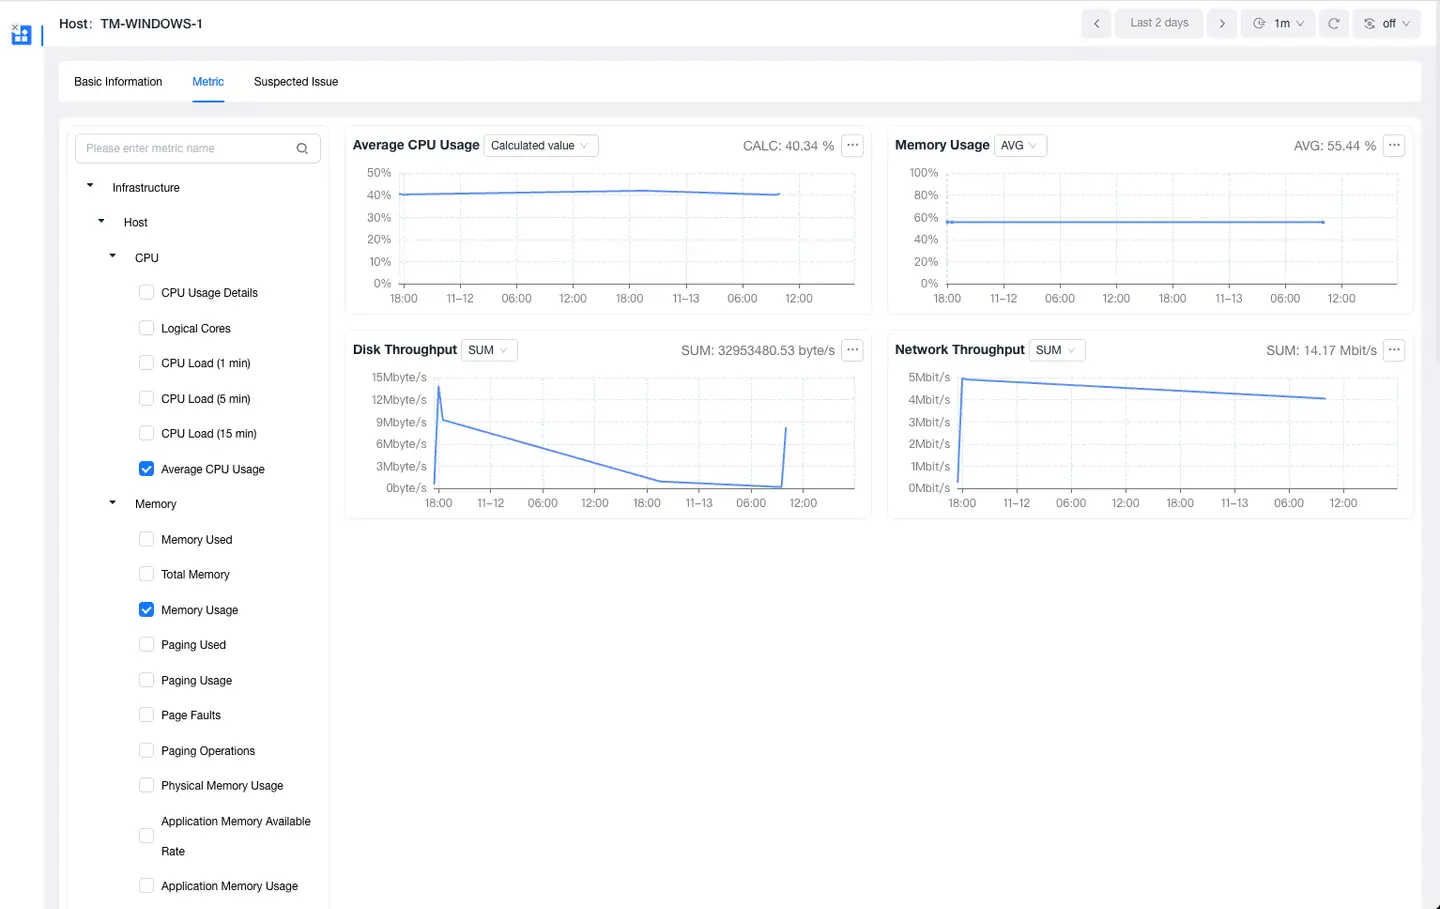
Host Analysis
Click on a host node to view:
- Host name, IP address
- CPU cores, CPU architecture
- Total memory, running environment
- Metric analysis, Problems
- Host logs and process analysis
2. Filter Nodes
Click the filter box at the top of the page to quickly locate nodes by name and tags:
-
Name Filtering:
- Application name
- Application instance name
- Host name
- Pod name
- Process name
- Database name
- Deployment environment
- NoSQL name
- MQ name
-
Tag Filtering:
- Application name
- Business system
- Deployment environment
- Host IP
- Host name
- Instance name
- Kubernetes cluster ID
- Kubernetes cluster name
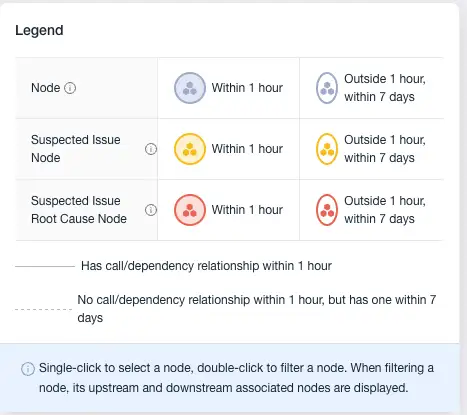
3. Legend Explanation
Node colors indicate node status:
- Blue: Normal nodes, status normal
- Yellow: Normal fault nodes
- Red: Fault root cause nodes
Node icon lines:
- Solid line: Agent installed
- Dashed line: Agent not installed
Node icon fill:
- Filled: Calls occurred within 1 hour
- Not filled: No calls within 1 hour
Connection line forms:
- Solid line: Topology correlation within 1 hour
- Dashed line: No topology correlation within 1 hour, topology correlation within 2 days
- Dotted line: Workload or Pod under service
Connection line colors:
- Gray: Calls normal
- Red: Errors in call relationships generate alerts
![]()
4. Node Settings
Click the settings icon in the upper right corner of the page to perform the following settings:
- Hide Isolated Nodes: Default off, when enabled, nodes without data correlation are not displayed
- Merge Display:
- Database merge
- NoSQL merge
- MQ merge
- External service merge
- Node Count: Can adjust display node count (1-500 nodes)
5. Other Operations
-
Node Interaction:
- Click a node: Zoom in and highlight related nodes
- Hover over a node: Display node type and name
-
View Control:
- Zoom: Use zoom in/out buttons
- Full screen: Click fullscreen button
- Drag: Left-click drag entire image or individual node