Report
Introduction
Report primarily provides users of the platform with a set of customizable reporting features, enabling scheduled sending, periodic sending, and custom data collection. It supports creating reports from scratch and creating reports based on templates.
Currently, reports support adding seven different chart types: Pie, Bar, Line, Radar, China Map, Health, and List.
User Guide
My Reports
The system supports creating custom reports and reports based on templates.
Custom Creation
Users can independently configure and enrich report content, including formatting, comments, layout, etc. To create a report, follow these steps.
-
In the left navigation bar, select "All Apps", and then select "Observe and explore > Report" from the pop-up list of lightweight applications.
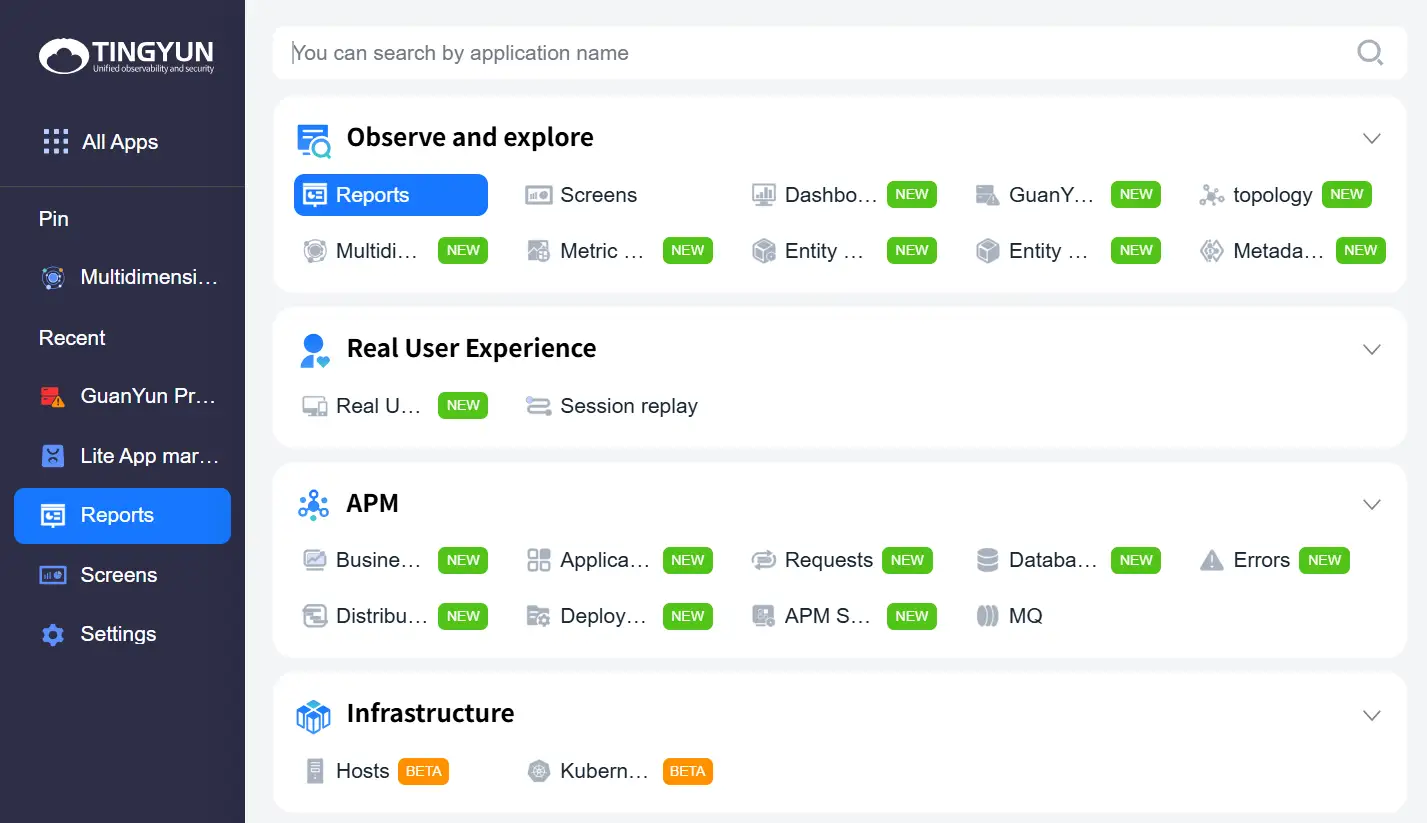
Alternatively, you can enter by clicking the Report lightweight application icon in the left Dock bar.
-
Click the "Paging Report" button.
-
Configure Decorations.
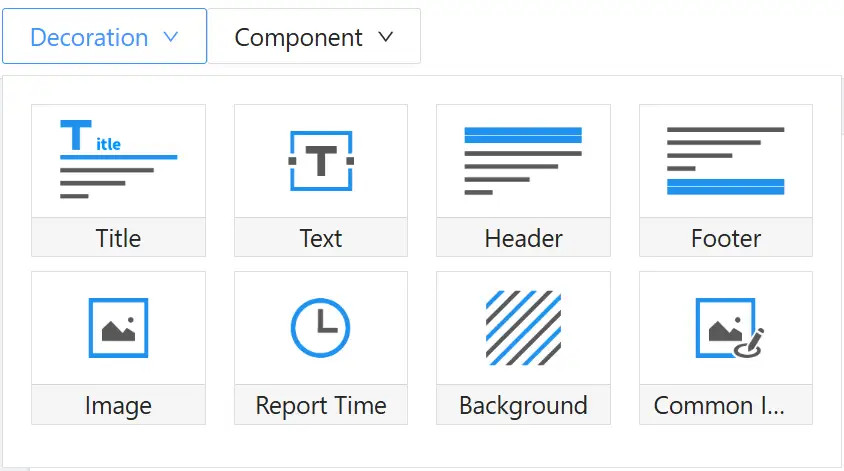
Decorations provide text, header decorations, footer decorations, titles, and file components.
-
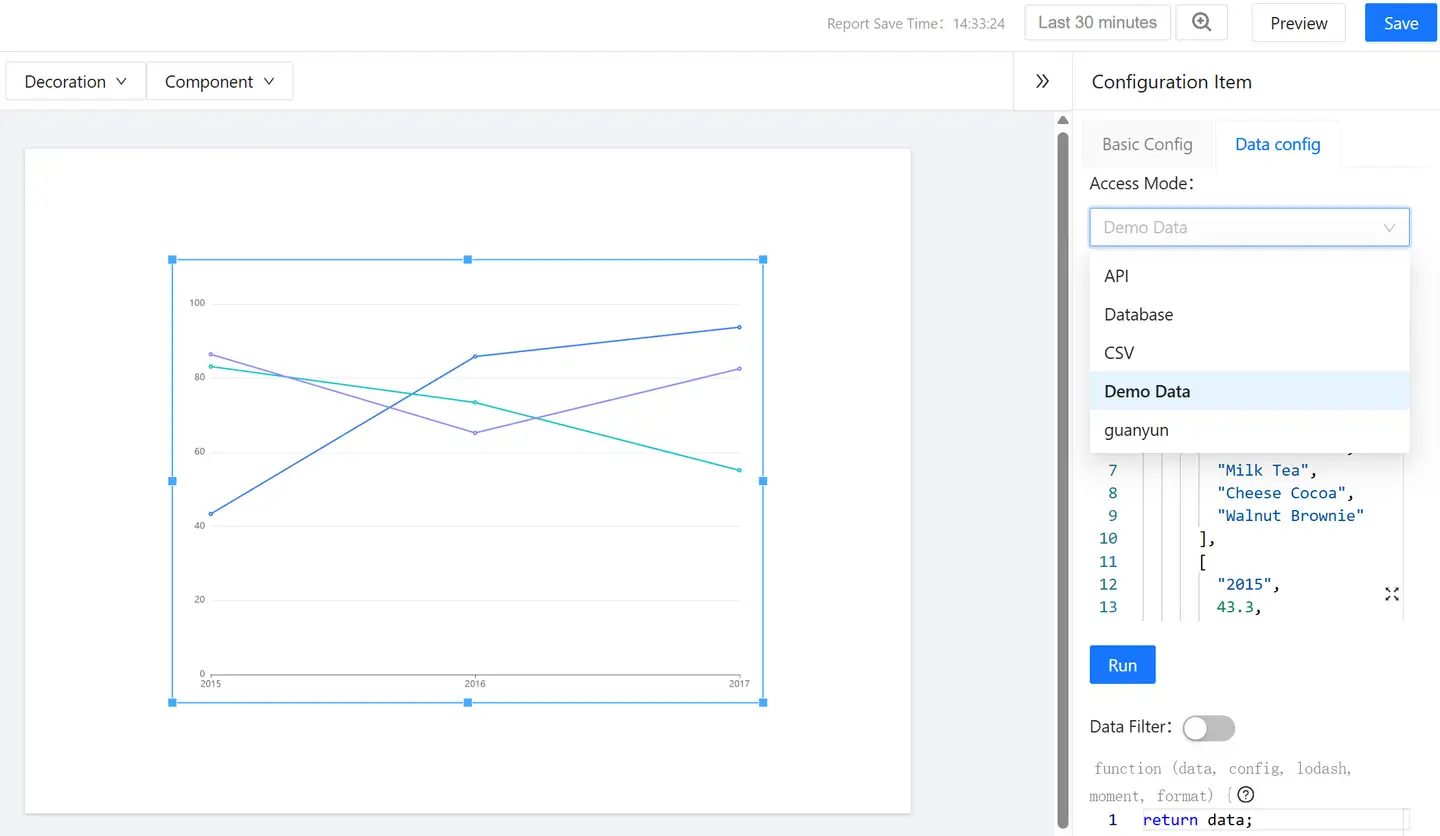
Configure Components.
Components provide third-party data capabilities for the report. Basic chart types such as line charts, bar charts, and pie charts are provided here, supporting data types like databases, APIs, and static data for integration. Databases support MySQL, PostgreSQL, and DB.

Select a chart, click the "Data Configuration" button on the right to configure the integrated data, click again to collapse the configuration area. Example as follows:
-
(Optional) Click the "Preview" button in the upper right corner to preview the report effect at any time.
-
Click the "Save" button in the upper right corner to save the report configuration.
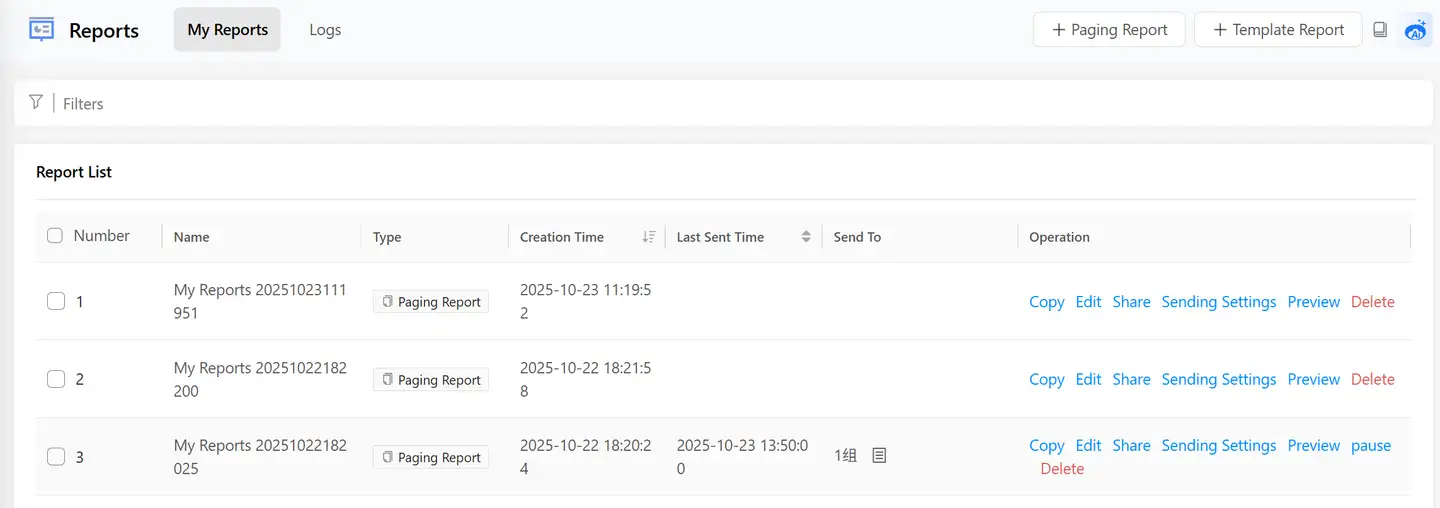
The newly created report will be displayed in the report list.
Paginated Report
The paginated report mode is primarily designed to improve the editing operation experience, aiming to restore the layout as close to a 1:1 ratio as possible during both editing and report export.
A paginated report is divided into 4 areas: Title Bar Area, Left Sidebar Area, Editing Area, and Right Sidebar Area.
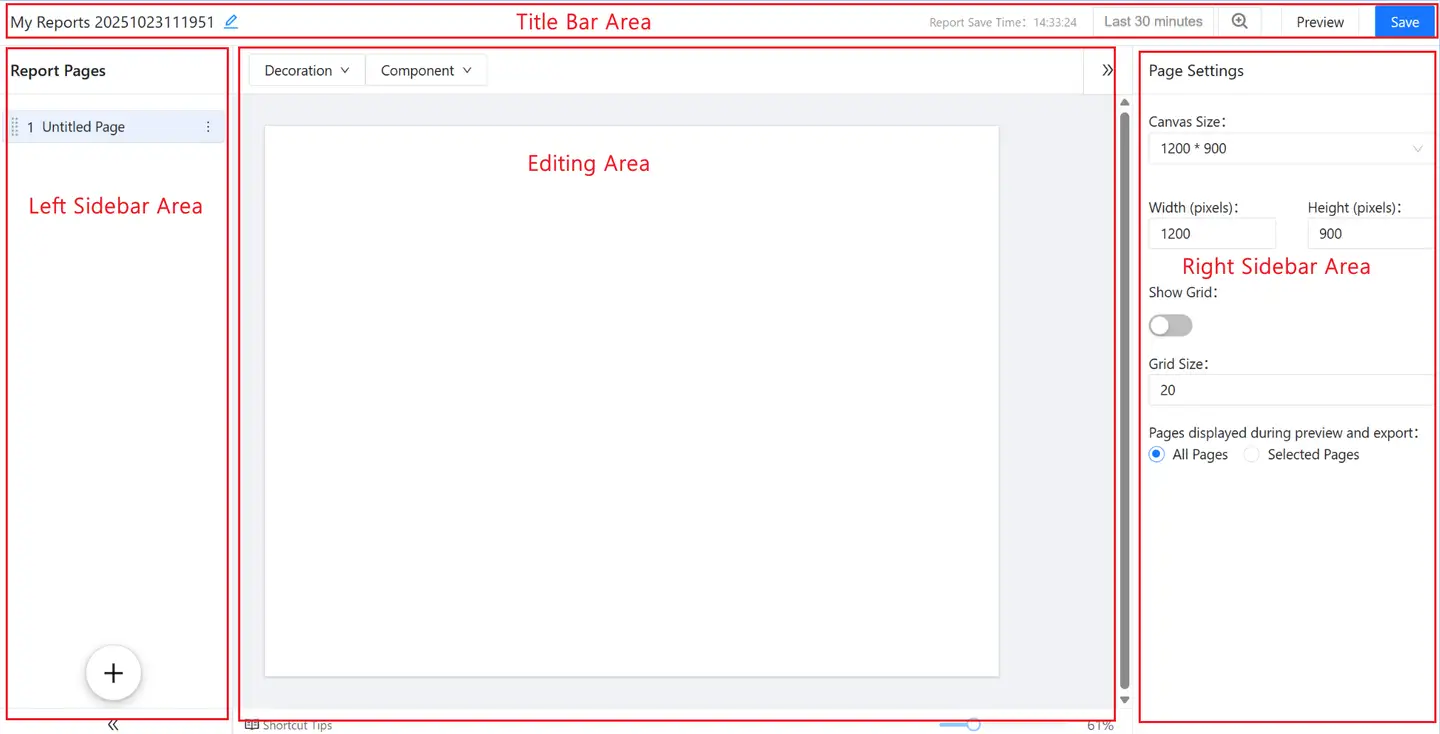
Title Bar Area
- Click
 in the Title Area to rename the report (takes effect after clicking the "Save" button for the report).
 - Click "Save" in the Function Area to save the currently edited report (reports are automatically saved every 5 minutes by default).
- Click "Preview" in the Function Area to open a new browser tab and preview the current report.
- Click the time selection box in the Function Area to specify any time range within the last 90 days for querying.
Left Sidebar Area
- Click and drag the
 area to adjust the display order of report pages.
 - Click
 to add a new blank page titled "Untitled Page".
 - Click
 to collapse the left sidebar; click
  to expand the collapsed sidebar.
 - Click
 to rename or delete the current page.
Editing Area
The Editing Area includes: the Decoration Area, the Public Component Library, and the Canvas Area. In this area, you can layout, format, perform quick operations, and select needed icons for the report.
-
Decoration Area: Clicking the "Decoration" drop-down menu displays the decoration components pop-up. Decoration components support being used by clicking or dragging onto the canvas area.
Note: The components within the Decoration Area are currently provided by the official website by default and cannot be added or deleted.
-
Public Component Library: The Public Component Library provides 9 components by default, all of which can integrate external data, supporting data sources including (but not limited to) APIs, databases, CSV files, etc.
-
Canvas: You can perform the following operations on the canvas.
-
In the Canvas Area, you can select one or multiple charts.
-
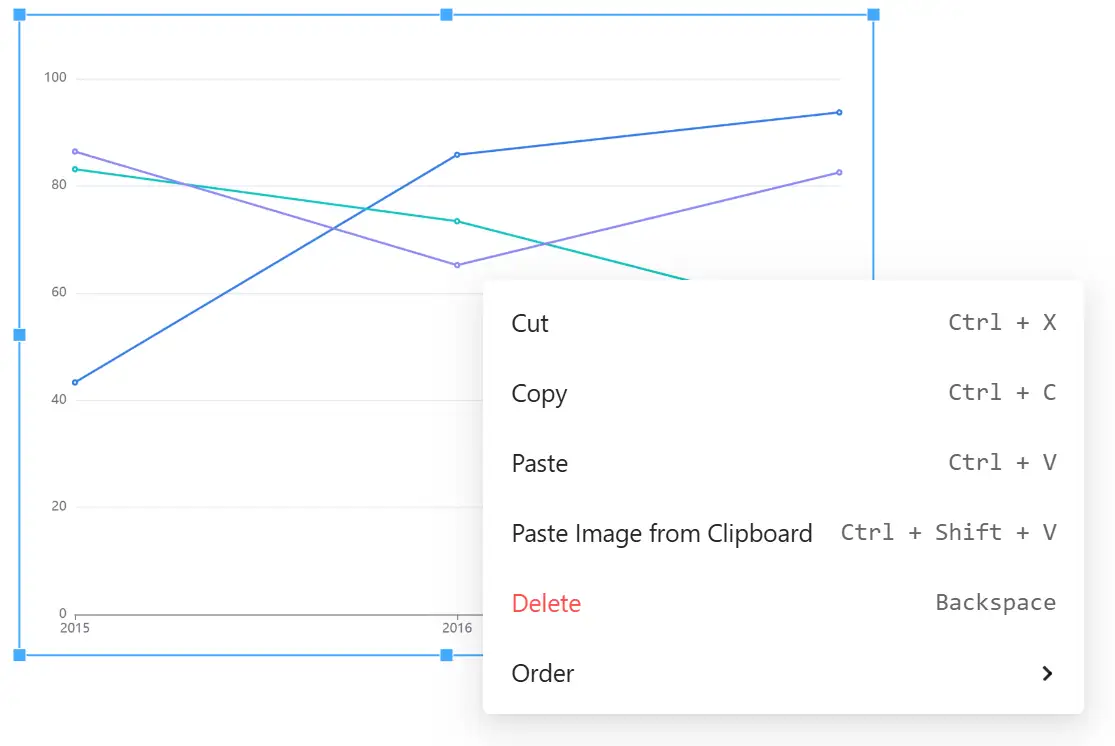
Right-clicking on a chart allows you to: Cut, Delete, Copy, Paste, Paste from Clipboard, Bring to Front, Send to Back, Bring Forward, Send Backward.
-
After selecting a component, you can freely drag and layout the component.
-
If you use a third-party screenshot tool like QQ in another active window to capture a window or page, after entering the report canvas, clicking Paste from Clipboard will paste the third-party screenshot onto this page for use.
-
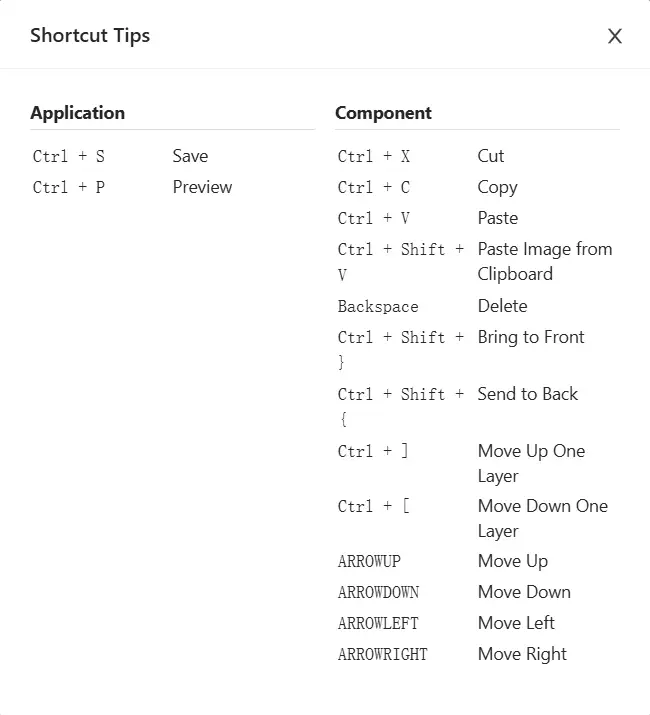
The entire canvas area supports keyboard shortcut operations. The shortcut functions are as follows:
-
Click and drag any of the 4 vertices of a component to scale the canvas proportionally.
-
Right Sidebar Area
The Right Sidebar Area is the operation area for global report configuration and individual component configuration, including Basic Configuration and Data Configuration.
-
Global Configuration
- Canvas Size Options: 1200×900, 900×1200, 1366 ×768, and 768×1366.
- Pixels: Custom width and height in pixels.
- Grid: Whether to enable the grid (primarily used as a reference line for report layout).
- Preview and Export Page Configuration: Default is all pages, but you can also customize which pages to preview or export.
-
Single Component Personalized Configuration
- Public Component Library Component Configuration: Configure data integration methods (including API, Demo data) and data filters.
//: # ( - Tingyun Chart Library: By default, no configuration properties are available (as the main data format is already determined), except for the tab component. Tab component configuration includes table, header, column configuration, and sorting configuration.)
Template Creation
Template reports are primarily designed to reduce user effort. The product will continue to iterate and add more scenario templates. To create a report based on a template, follow these steps.
-
In the left navigation bar, select "All Apps", and then select "Observe and explore > Report" from the pop-up list of lightweight applications.
-
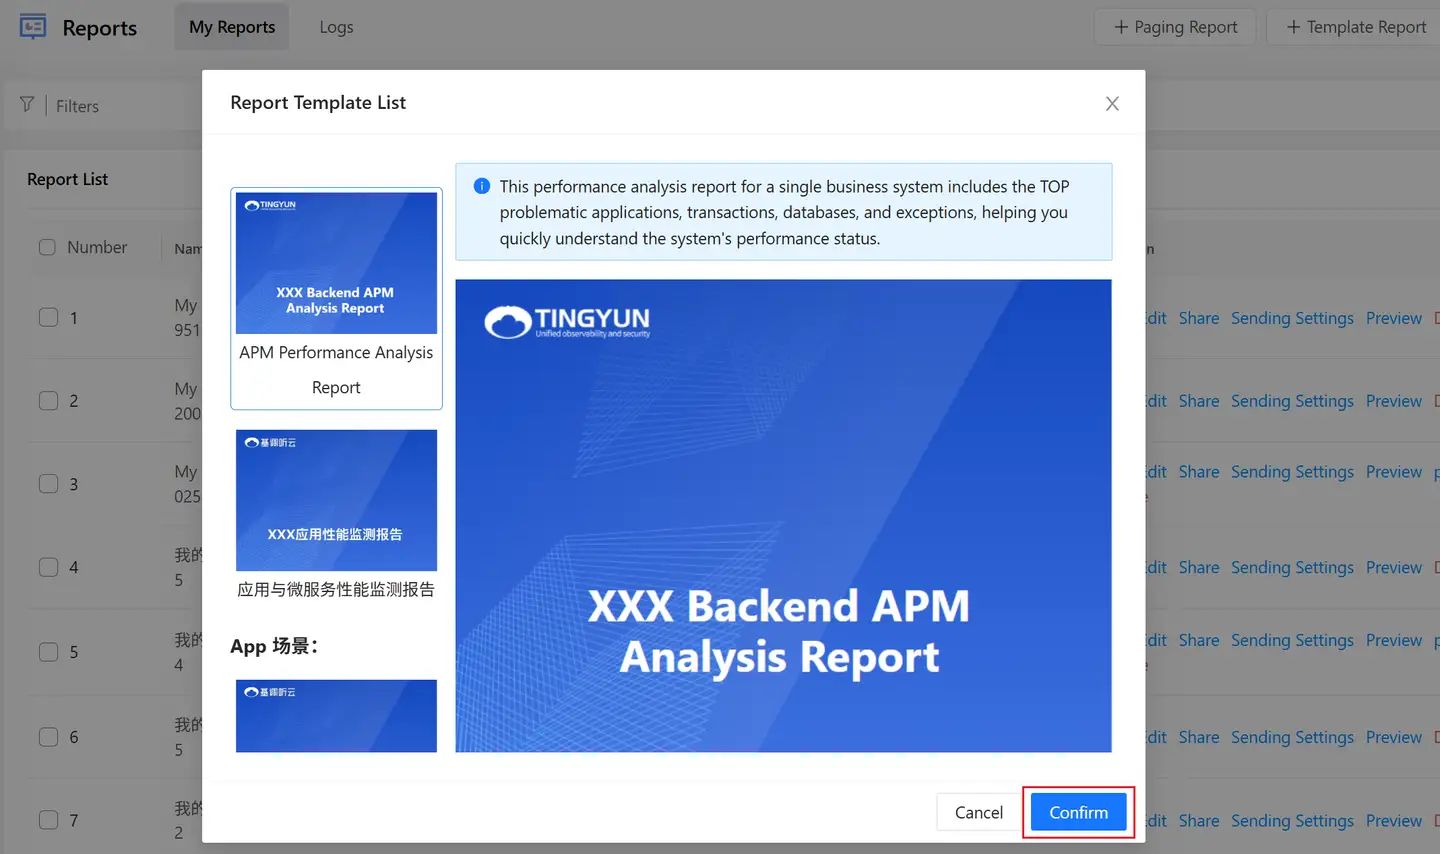
Click the "Template Report" from the menu that appears.

-
Select a template and click the "Confirm" button.
-
(Optional) Click the preview button in the upper right corner to preview the report effect at any time.
-
Click the "Save" button in the upper right corner to save the report configuration.
Report List
The Report List displays all created reports. On the Report List page, you can perform the following operations:
-
Click the
 icon next to Creation Time or Last Sent Time to sort from oldest to newest; click the
  icon to sort from newest to oldest.
 -
Recipients: The recipients who receive the current report.
-
Enable/Disable: You can enable or disable reports created within a scheduled sending plan.
-
Search Reports: Click the search box in the upper right corner of the report list to perform a fuzzy search on reports.
-
Create Report: Click the "Create" button in the upper left corner of the report list to choose between custom creation and template creation.
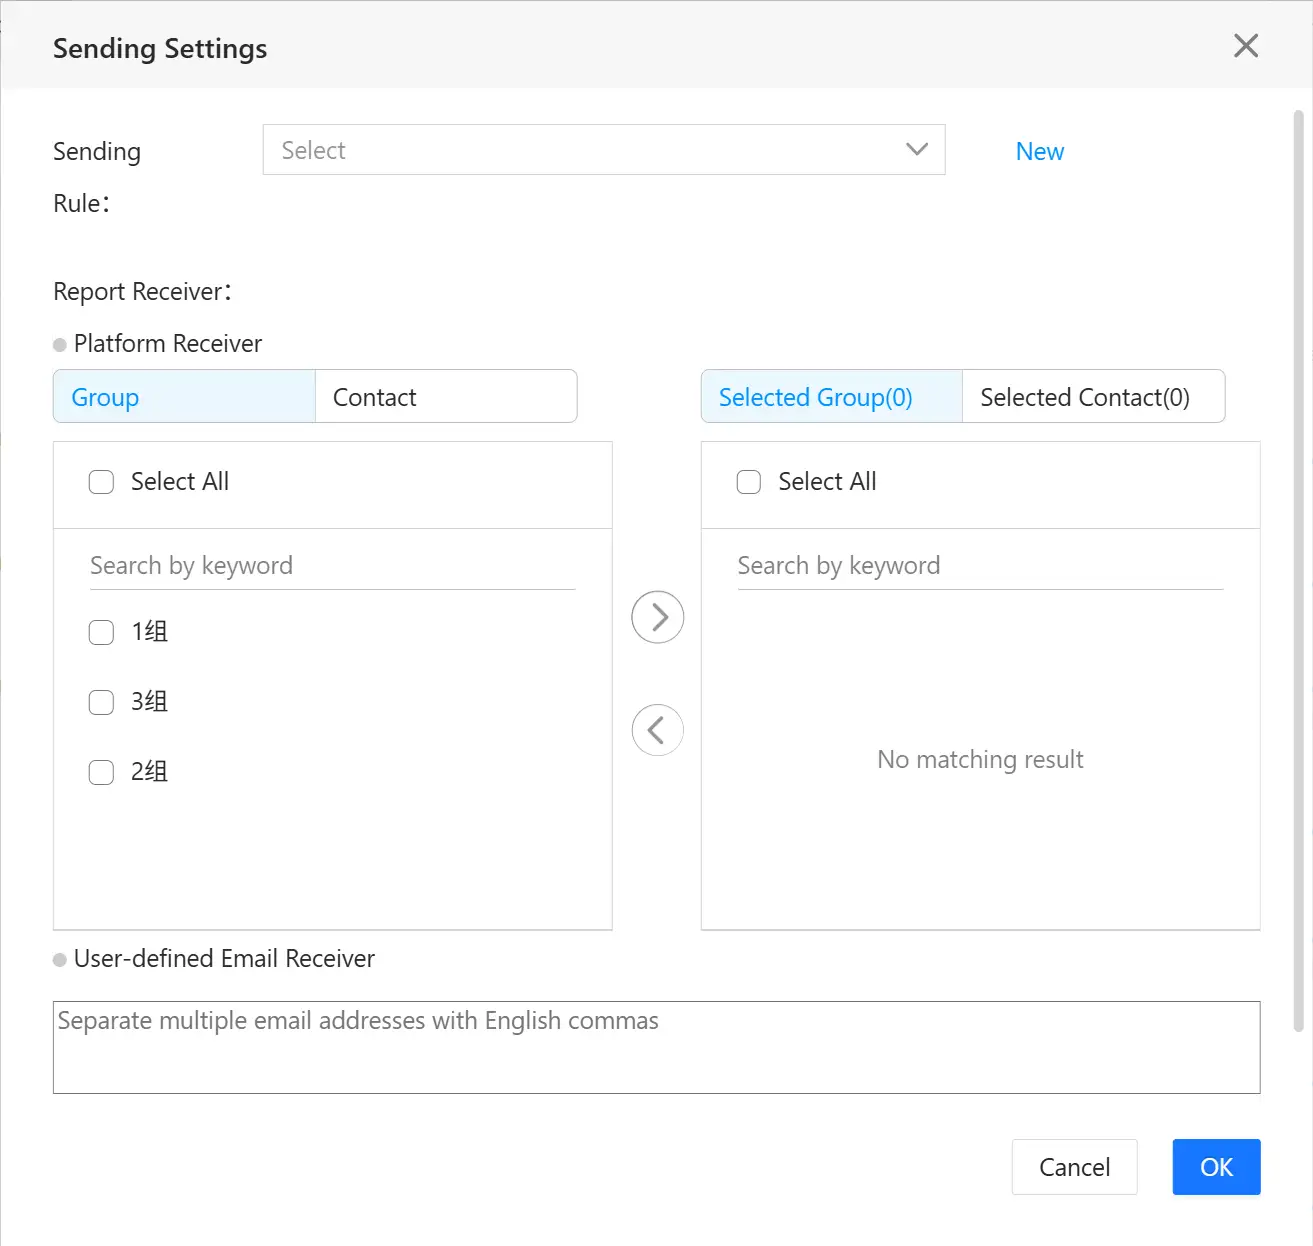
Sending Settings
-
In the left navigation bar, select "All Applications", and then select "Report" from the pop-up list of lightweight applications.
-
In the "Operation" column of the target report, click the "Sending Settings" link to enter the Sending Settings page.
-
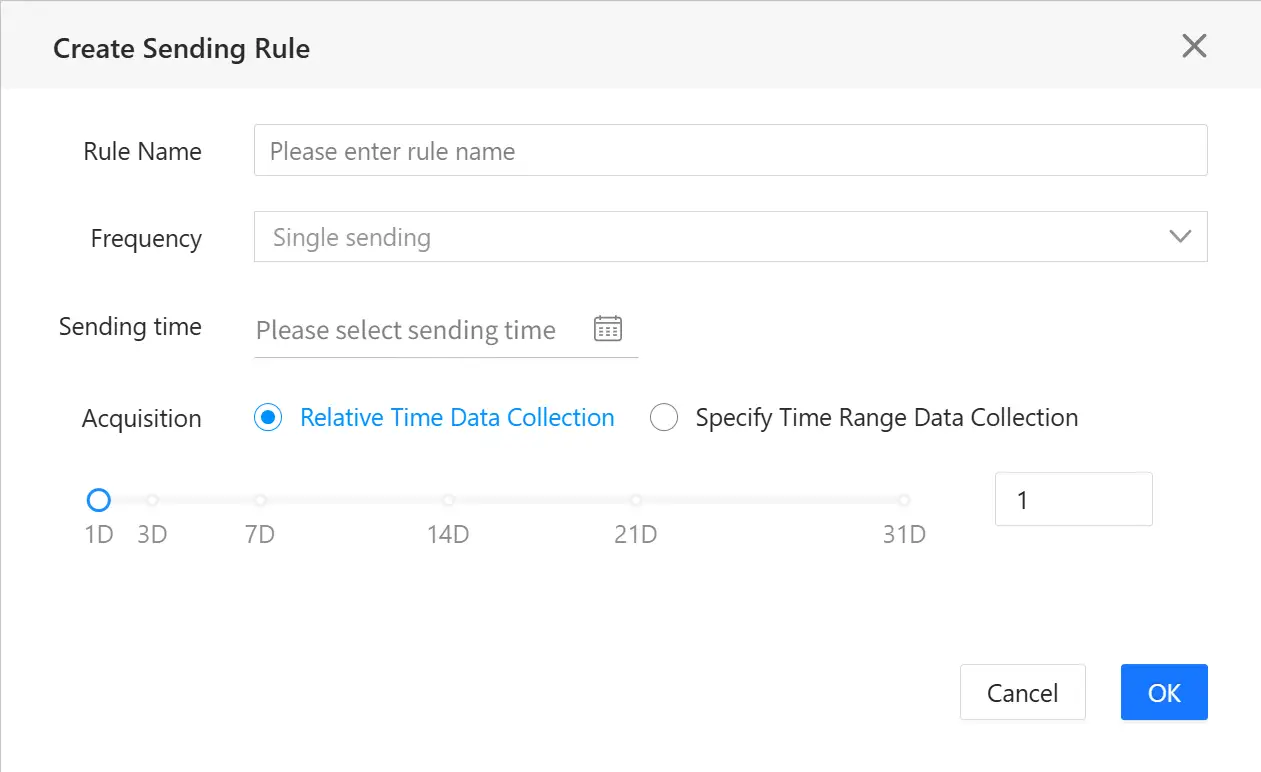
Select a sending rule. If no sending rule has been created yet, click the "New" link to create one.
-
Customize the rule name.
-
Set the sending frequency, including One-time Send and Recurring Send modes.
One-time Send supports specifying a single send date. Recurring Send offers Workday mode and Specified Date mode for sending. Workday mode allows selecting any day from Monday to Sunday for sending.
-
Set Data Collection. Users can customize the time period for which chart data in the report is collected.
- Relative Time Data Collection: The data collection time is N calendar days prior to the report sending time.
- Specified Time Range Data Collection: After selecting a start time and end time, the sent report will only display chart data within that time range. Only One-time Send mode supports this setting.
-
Click OK to complete the sending rule configuration.
-
-
Configure report recipients.
- Platform Recipients: Send the report to the email addresses of recipients already configured in the platform. To configure recipients, please do so in "User Center" > "Push Configuration".
- Email Recipients: Send the report to external contact email addresses. Separate multiple email addresses with English commas.
-
Configure the receiving format of the report.
Reports support being sent as attachments in PDF, EXCEL, and JSON formats. When multiple formats are selected, the system will send them to the email as a compressed package.
Sending Logs
The Sending Logs list displays the names, last sent time, recipients, sending status, attachment types, and operations of reports sent in the last 3 months.
-
Sent Time: Shows the last time the report was sent.
-
Name: The report name.
-
Recipients: Displays the list of email recipients for the report.
-
Sending Status: Shows the status of the last sent email.
-
Attachment Type: Shows the format of the sent report.
-
Operation: Click the "Download" link in the "Operation" column to download successfully sent attachments.

API Integration Specifications
Map
Component Name: Map
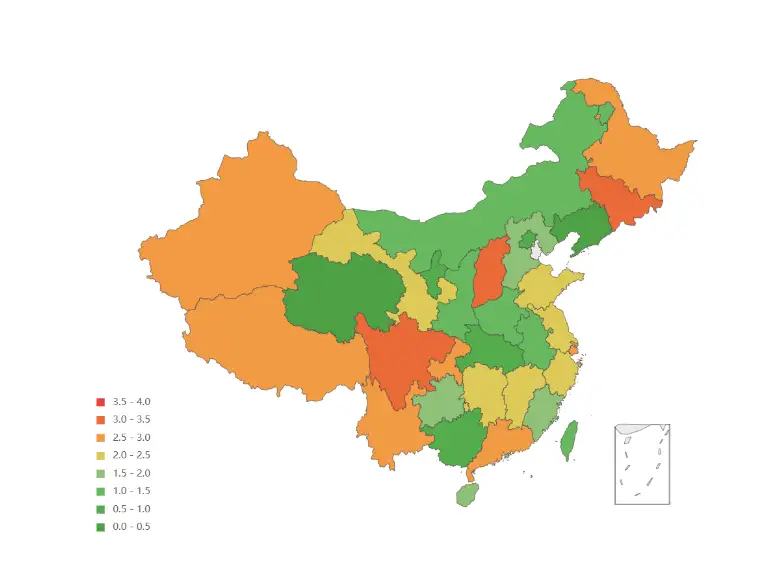
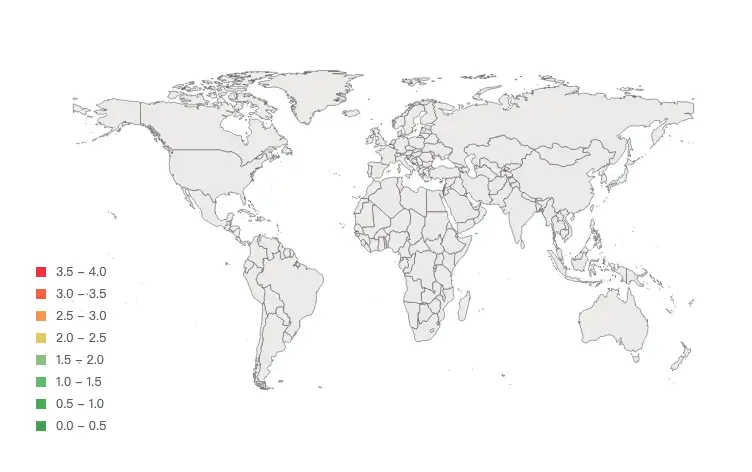
Component Description: World Map, China Map, Province Map
Component Styles:
China Map:
World Map:
Beijing Map:

Request Parameters:
The chart interface must support the timePeriod and endTime parameters to allow dynamic time adjustment for data retrieval in Smart Reports.
| Request Parameter | Type | Required | Description |
|---|---|---|---|
| timePeriod | Number | Yes | Number of minutes. |
| endTime | String | Yes | End time, format yyyy-MM-dd HH:mm |
Correct Response Data:
| Field | Type | Must Return | Description |
|---|---|---|---|
| status | Number | Yes | Request return status, 200 for success, any non-200 status is uniformly treated as no data processing. |
| msg | String | No | Request response message. |
| data | Object | Yes | Response result. |
| value | Number | No | Average value. |
| unit | String | No | Unit. |
| map | String | Yes | Map type: world for World Map, china for China Map, province map use pinyin e.g., beijing, hebei. Note: Shanxi is shanxi, Shaanxi is |
| series | Object[] | Yes | Data items. |
| name | String | Yes | Data item name. |
| value | Number | Yes | Data item value. |
Example:
{
    "status": 200,
    "msg": "success",
    "data": {
        "value": 1.68,
        "unit": "s",
        "map": "china",
        "series": [
            {
                "name": "Beijing",
                "value": 800
            },
            {
                "name": "Shanghai",
                "value": 580
            }
        ]
    }
}
Database Integration, CSV Integration: SQL query results and CSV file contents must have 4 columns. Field names can be arbitrary, but the field order cannot change.
| Field | Type | Description |
|---|---|---|
| name | String | Name |
| value | String | Value |
| map | String | Map type: world for World Map, china for China Map, province map use pinyin e.g., beijing, hebei. Note: Shanxi is shanxi, Shaanxi is shanxi1. |
| unit | String | Unit |
Using MySQL as an example, SQL example:
SELECT name, value, map, unit FROM demo
CSV example:
name,value,map,unit
Beijing,1000,china,s
Shanghai,800,,
Guangdong,500,,
Shenzhen,300,,
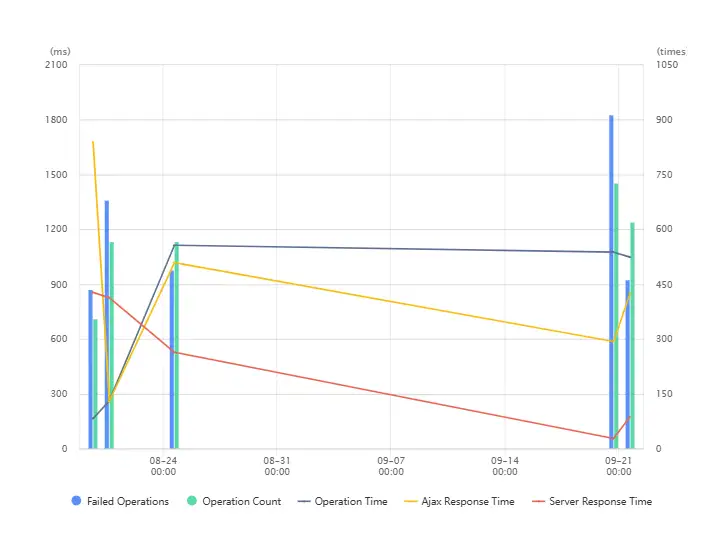
Line Chart
Component Name: Line Chart
Component Styles: Line Chart, Bar + Line Chart, Apdex Line Chart
Request Parameters:
The chart interface must support the timePeriod and endTime parameters to allow dynamic time adjustment for data retrieval in Smart Reports.
| Request Parameter | Type | Required | Description |
|---|---|---|---|
| timePeriod | Number | Yes | Number of minutes. |
| endTime | String | Yes | End time, format yyyy-MM-dd HH:mm |
Correct Response Data:
| Field | Type | Must Return | Description |
|---|---|---|---|
| status | Number | Yes | Request return status, 200 for success, any non-200 status is uniformly treated as no data processing. |
| msg | String | No | Request response message. |
| data | Object | Yes | Response result. |
| value | Number | No | Average value. |
| stacked | Number | No | Whether bars in the series are stacked: 0 for not stacked, 1 for stacked. Default is 0. |
| area | Number | No | Whether lines in the series are area charts (stacked): 0 for not area, 1 for area. Default is 0. |
| yAxis | Object[] | Yes | Y-axis configuration. Up to two axes, the first on the left, the second on the right. |
| name/tickUnit | String | Yes | Axis unit. |
| series | Object[] | Yes | Data objects. |
| name | String | Yes | Data item name. |
| type | String | Yes | line for line chart, column for bar chart, bar for horizontal bar chart, area for stacked area chart. |
| yAxis/yAxisIndex | Number | No | The Y-axis the data corresponds to, starting from 0. Default is 0. |
| data | Object[] | Yes | Chart data items. |
| x | Number | Yes | Timestamp sequence. |
| y | Number | Yes | Value. |
Example:
{
    "status": 200,
    "msg": "success",
    "data": {
        "value": 123,
        "yAxis": [
            {
                "tickUnit": "s"
            },
            {
                "tickUnit": "times"
            }
        ],
        "forward": 0,
        "stacked": 0,
        "area": 0,
        "series": [
            {
                "name": "Response Time",
                "type": "line",
                "data": [
                    {
                        "x": 1544496360000,
                        "y": 122
                    },
                    {
                        "x": 1544496420000,
                        "y": 422
                    }
                ]
            },
            {
                "name": "Throughput",
                "type": "bar",
                "yAxisIndex": 1,
                "data": [
                    {
                        "x": 1544496360000,
                        "y": 22
                    },
                    {
                        "x": 1544496420000,
                        "y": 122
                    }
                ]
            }
        ]
    }
}
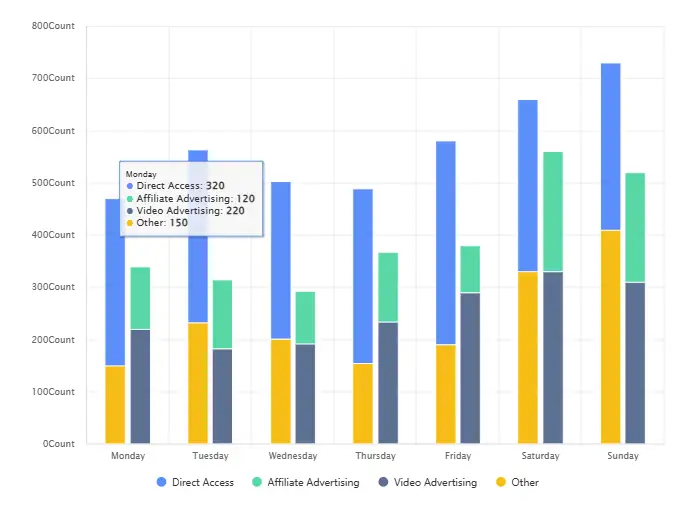
Bar Chart
Component Name: Bar Chart
Component Description: Bar Chart, Stacked Bar Chart
Component Styles:
Request Parameters:
The chart interface must support the timePeriod and endTime parameters to allow dynamic time adjustment for data retrieval in Smart Reports.
| Request Parameter | Type | Required | Description |
|---|---|---|---|
| timePeriod | Number | Yes | Number of minutes. |
| endTime | String | Yes | End time, format yyyy-MM-dd HH:mm |
Correct Response Data:
| Field | Type | Must Return | Description |
|---|---|---|---|
| status | Number | Yes | Request return status, 200 for success, any non-200 status is uniformly treated as no data processing. |
| msg | String | No | Request response message. |
| data | Object | Yes | Response result. |
| forward | Number | No | 0 for horizontal, 1 for vertical. Default is 0. |
| legend | Object | No | Legend configuration. |
| data | Array[] | No | Legend data, consistent with the name in the series array. |
| yAxis | Object[] | Yes | Y-axis configuration. |
| name/tickUnit | String | Yes | Axis unit. |
| xAxis | Object | Yes | X-axis configuration. |
| type | String | Yes | Fixed value category. |
| data | Array[] | Yes | X-axis data. |
| series | Object[] | Yes | Data objects. |
| name | String | Yes | Data item name. |
| type | String | Yes | Fixed value column (vertical bar) or bar (horizontal bar). |
| stack | String | No | Stack id. Series with the same stack id will be stacked on the same category axis. |
| data | Array[] | Yes | Chart data items. |
Example:
{
    "status": 200,
    "msg": "success",
    "data": {
        "forward": 0,
        "legend": {
            "data": ["Direct Access", "Affiliate Ad", "Video Ad", "Other"]
        },
        "yAxis": [{
            "type": "value",
            "name": "Times"
        }],
        "xAxis": [{
            "type": "category",
            "data": ["Mon", "Tue", "Wed", "Thu", "Fri", "Sat", "Sun"]
        }],
        "series": [
            {
                "name": "Direct Access",
                "type": "bar",
                "data": [320, 332, 301, 334, 390, 330, 320]
            },
            {
                "name": "Affiliate Ad",
                "type": "bar",
                "stack": "Ad",
                "data": [120, 132, 101, 134, 90, 230, 210]
            },
            {
                "name": "Video Ad",
                "type": "bar",
                "stack": "Ad",
                "data": [220, 182, 191, 234, 290, 330, 310]
            },
            {
                "name": "Other",
                "type": "bar",
                "data": [150, 232, 201, 154, 190, 330, 410]
            }
        ]
    }
}
Health Chart
Component Name: Health Bar Chart
Component Styles:

Request Parameters:
The chart interface must support the timePeriod and endTime parameters to allow dynamic time adjustment for data retrieval in Smart Reports.
| Request Parameter | Type | Required | Description |
|---|---|---|---|
| timePeriod | Number | Yes | Number of minutes. |
| endTime | String | Yes | End time, format yyyy-MM-dd HH:mm |
Correct Response Data:
| Field | Type | Must Return | Description |
|---|---|---|---|
| status | Number | Yes | Request return status, 200 for success, any non-200 status is uniformly treated as no data processing. |
| msg | String | No | Request response message. |
| data | Object[] | Yes | Response result. |
| beginTime | Number | Yes | Start time (timestamp). |
| endTime | Number | Yes | End time (timestamp). |
| eventLevel | Number | Yes | Health level. |
Example:
{
    "status": 200,
    "msg": "success",
    "data": [
        {
            "beginTime": 1594954800000,
            "endTime": 1597632360000,
            "eventLevel": -1
        }
    ]
}
Database Integration, CSV Integration: SQL query results and CSV file contents must have 3 columns. Field names can be arbitrary, but the field order cannot change.
| Field | Type | Description |
|---|---|---|
| beginTime | Date | Start Time |
| endTime | Date | End Time |
| eventLevel | String | Health Level |
Using MySQL as an example, SQL example:
SELECT beginTime, endTime, eventLevel FROM demo
CSV example:
beginTime,endTime,eventLevel
1628655933168,1628763933168,-1
1628763933168,1628943933168,1
1628943933168,1629015933168,2
1629015933168,1629116733168,0
Pie Chart
Component Name: Pie Chart
Component Styles:

Request Parameters: The chart interface must support the timePeriod and endTime parameters to allow dynamic time adjustment for data retrieval in Smart Reports.
| Request Parameter | Type | Required | Description |
|---|---|---|---|
| timePeriod | Number | Yes | Number of minutes. |
| endTime | String | Yes | End time, format yyyy-MM-dd HH:mm |
Correct Response Data:
| Field | Type | Must Return | Description |
|---|---|---|---|
| status | Number | Yes | Request return status, 200 for success, any non-200 status is uniformly treated as no data processing. |
| msg | String | No | Request response message. |
| data | Object | Yes | Response result. |
| value | Number | No | Average value. |
| unit | String | No | Unit. |
| series | Object[] | Yes | Data objects. |
| name | String | No | Data series name. |
| data | Object[] | Yes | Data items. |
| name | String | Yes | Data item display name. |
| value | Number | Yes | Data item value. |
Example:
{
    "status": 200,
    "msg": "success",
    "data": {
        "value": 1.68,
        "unit": "s",
        "series": [
            {
                "name": "DNS",
                "data": [
                    {
                        "name": "Error Rate",
                        "value": 16
                    },
                    {
                        "name": "Throughput",
                        "value": 6
                    }
                ]
            }
        ]
    }
}
Database Integration, CSV Integration: SQL query results and CSV file contents must have 3 columns. Field names can be arbitrary, but the field order cannot change.
| Field | Type | Description |
|---|---|---|
| name1 | String | Data series name |
| name2 | String | Data item display name |
| value | String | Value |
Using MySQL as an example, SQL example:
SELECT name1, name2, value FROM demo
CSV example:
name1,name2,value
DNS,Error Rate,111
DNS,Throughput,222
Radar Chart
Component Name: Radar Chart
Component Styles:

Request Parameters:
The chart interface must support the timePeriod and endTime parameters to allow dynamic time adjustment for data retrieval in Smart Reports.
| Request Parameter | Type | Required | Description |
|---|---|---|---|
| timePeriod | Number | Yes | Number of minutes. |
| endTime | String | Yes | End time, format yyyy-MM-dd HH:mm |
Correct Response Data:
| Field | Type | Must Return | Description |
|---|---|---|---|
| status | Number | Yes | Request return status, 200 for success, any non-200 status is uniformly treated as no data processing. |
| msg | String | No | Request response message. |
| data | Object | Yes | Response result. |
| value | Number | No | Radar center indicator value. |
| unit | String | No | Unit. |
| indicator | Object[] | Yes | Indicator items and names. |
| name | String | Yes | Indicator item name. |
| max | Number | Yes | Indicator item maximum value. |
| series | Object[] | Yes | Data objects. |
| name | String | Yes | Data series name. |
| value | Object[] | Yes | Data series values. |
Example:
{
    "status": 200,
    "msg": "success",
    "data": {
        "value": 67,
        "indicator": [
            {
                "name": "Metric A",
                "max": 100
            },
            {
                "name": "Metric B",
                "max": 100
            },
            {
                "name": "Metric C",
                "max": 100
            },
            {
                "name": "Metric D",
                "max": 100
            },
            {
                "name": "Metric E",
                "max": 100
            },
            {
                "name": "Metric F",
                "max": 100
            }
        ],
        "series": [
            {
                "name": "Industry Avg",
                "value": [89, 90, 99, 96, 97, 95]
            },
            {
                "name": "Current",
                "value": [70, 60, 40, 30, 50, 95]
            }
        ]
    }
}
Database Integration, CSV Integration: SQL query results and CSV file contents must have 5 columns. Field names can be arbitrary, but the field order cannot change.
| Field | Type | Description |
|---|---|---|
| value1 | Number | Radar chart numeric value |
| name1 | String | Indicator name |
| max | String | Indicator maximum value |
| name2 | String | Data series name |
| value2 | String | Data series value |
Using MySQL as an example, SQL example:
SELECT value1, name1, max, name2, value2 FROM demo
CSV example:
value1,name1,max,name2,value2
15,1Response Time,100,Series1,72
15,2Data Usage,100,Series1,74
15,3Lag Rate,100,Series1,43
15,4Error Rate,100,Series1,60
15,5Crash Rate,100,Series1,78
15,6New Metric,100,Series1,88
15,1Response Time,100,Series2,61
15,2Data Usage,100,Series2,57
15,3Lag Rate,100,Series2,82
15,4Error Rate,100,Series2,48
15,5Crash Rate,100,Series2,40
15,6New Metric,100,Series2,11
List Chart
Component Name: List
Component Styles:

Request Parameters:
The chart interface must support the timePeriod and endTime parameters to allow dynamic time adjustment for data retrieval in Smart Reports.
| Request Parameter | Type | Required | Description |
|---|---|---|---|
| timePeriod | Number | Yes | Number of minutes. |
| endTime | String | Yes | End time, format yyyy-MM-dd HH:mm |
Correct Response Data:
| Field | Type | Must Return | Description |
|---|---|---|---|
| status | Number | Yes | Request return status, 200 for success, any non-200 status is uniformly treated as no data processing. |
| msg | String | No | Request response message. |
| data | Object[] | Yes | Response result. |
| header | Object[] | Yes | Table header information objects. |
| key | Object | Yes | key is the value corresponding to the table data property, value is the header title text. |
| rows | Object[] | Yes | Table row data objects. |
| rows | Object | Yes | Table row data object, keys must correspond to those in header. |
Example:
{
    "status": 200,
    "msg": "",
    "data": [
        {
            "header": [
                {"health": "Health"},
                {"system": "Business System"},
                {"responseTime": "Response Time"},
                {"throughput": "Throughput"},
                {"peakThroughput": "Peak Throughput"}
            ],
            "rows": [
                {"health": "Good", "system": 80, "responseTime": "Lag", "throughput": "12%", "peakThroughput": "12%"},
                {"health": "Fair", "system": 80, "responseTime": "Crash", "throughput": "12%", "peakThroughput": "12%"},
                {"health": "Poor", "system": 80, "responseTime": "Response Time", "throughput": "12%", "peakThroughput": "12%"}
            ]
        }
    ]
}
Database Integration, CSV Integration: SQL query results and CSV file contents field names can be arbitrary.
| Field | Type | Description |
|---|---|---|
| col1 | String | Column name |
| col2 | String | Column name |
| col3 | String | Column name |
Using MySQL as an example, SQL example:
SELECT col1, col2, col3, ... FROM demo
CSV example:
Health,Business System,Response Time,Throughput,Peak Throughput
Good,80,Lag,12%,12%
Fair,80,Crash,12%,12%
Poor,80,Crash,12%,12%
Multi-functional Chart
Component Name: Multi-functional Chart, Convertible Chart
Component Description: Charts can be converted internally.
Component Styles:

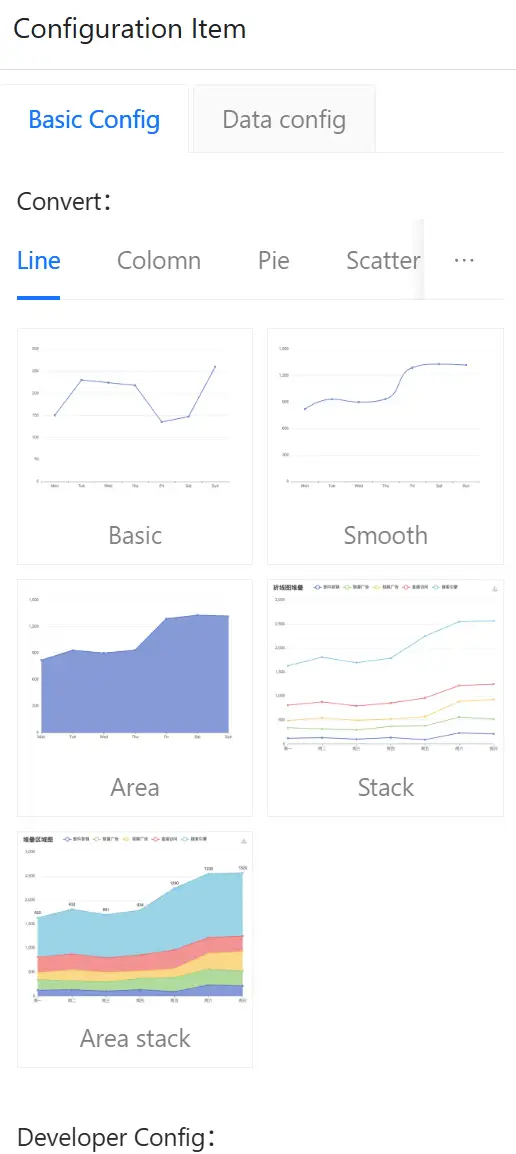
Usage Steps:
-
Configure data.
-
Select the convertible chart type. Currently supports Line Chart, Bar Chart, Pie Chart, Scatter Plot, Funnel Chart, Table (planned future support: Map, etc.).
-
(Optional) Customize the chart through Developer Configuration (by modifying the
optionconfiguration object, refer to ECharts5 configuration object).Global objects provided in Developer Mode:
- Global
jquery,$,echartsobjects. - Current chart
chartinstance. datareturned by third-party data integration.
- Global
Request Parameters:
The chart interface must support the timePeriod and endTime parameters to allow dynamic time adjustment for data retrieval in Smart Reports.
| Request Parameter | Type | Required | Description |
|---|---|---|---|
| timePeriod | Number | Yes | Number of minutes. |
| endTime | String | Yes | End time, format yyyy-MM-dd HH:mm |
Correct Response Data:
| Field | Type | Description |
|---|---|---|
| status | Number | Status Code |
| data | Object | |
| dataset | Array | Dataset |
| source | Array[] | Source Data |
Example:
{
    "status": 200,
    "data": {
        "dataset": {
            "source": [
                ["date", "Matcha Latte", "Milk Tea", "Cheese Cocoa", "Walnut Brownie"],
                ["2015", 43.3, 83.1, 86.4, 72.4],
                ["2016", 85.8, 73.4, 65.2, 53.9],
                ["2017", 93.7, 55.1, 82.5, 39.1]
            ]
        }
    }
}
Database Integration, CSV Integration: SQL query results and CSV file field names can be arbitrary. The first column is the date, and each subsequent column is data for one series:
Using MySQL as an example, SQL example:
SELECT column1, column2, column3, ... FROM demo
CSV example:
date,Matcha Latte,Milk Tea,Cheese Cocoa,Walnut Brownie
2015,43.3,83.1,86.4,72.4
2016,85.8,73.4,65.2,53.9
2017,93.7,55.1,82.5,39.1