Problem
Feature Overview
The platform AI algorithm engine monitors alert events in real time and aggregates alerts with the same root cause within an effective observation window to form Problems. Problems provide in-depth root cause analysis and impact analysis both horizontally and vertically.
Concepts
Problems have the following three statuses:
-
Open: Once a Problem is created, it enters the "Open" status. As long as one entity is still in an abnormal state, the problem will remain in the "Open" status.
-
Resolved: When all affected entities return to normal (abnormal metrics disappear) and all events are recovered, the problem status changes to "Resolved".
-
Closed: When a problem is in "Resolved" status and no new events are aggregated within the observation window period (default 30 minutes), the problem status will be set to "Closed", indicating that the problem has been truly resolved.
Use Cases
After alert events occur in the system, Problems are used for issue identification, location, and analysis, helping you quickly resolve problems.
Configuration Approach
- Configure alerts. In Alert Configuration, select "AI Smart Algorithm" as the detection method, which will generate Problems from alert events.
- Configure notification strategies for Problems.
Configuration Guide
For alert rule configuration of Problems, see "Alert > Alert Configuration".
For notification strategy configuration of Problems, see "Alert > Notification Configuration".
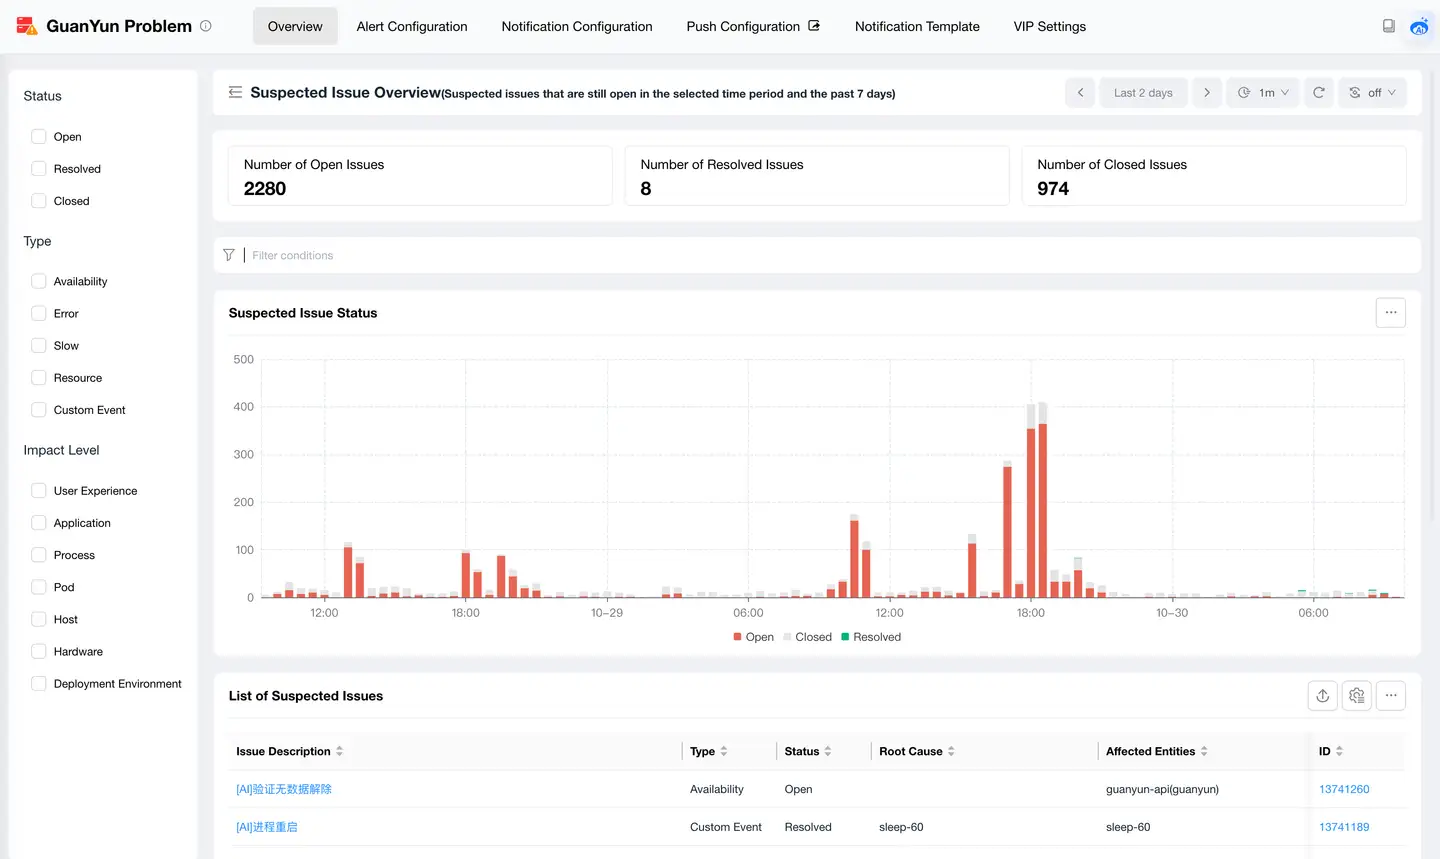
Problem List
| Area | Item | Description |
|---|---|---|
| Left search bar | Status | Open, Resolved, Closed |
| Type | Availability, Error, Slow, Resource, Custom Event | |
| Impact Level | User Experience, Application, Process, Pod, Host, Hardware, Deployment Environment | |
| Chart statistics | Open Count | Number of problems with the status Open within the current query window |
| Resolved Count | Number of problems with the status Resolved within the current query window | |
| Closed Count | Number of problems with the status Closed within the current query window | |
| Bar Chart | Bar trend chart showing status statistics | |
| List | Problem Description | Brief description of the problem |
| Type | Availability, Error, Slow, Resource, Custom Event | |
| Status | Open, Resolved, Closed | |
| Root Cause | Root cause entity | |
| Affected Entities | All alert entities | |
| Affected Entity Count | Number of all alert entities | |
| Created Time | Time when the problem occurred | |
| ID | Unique identifier of the problem |
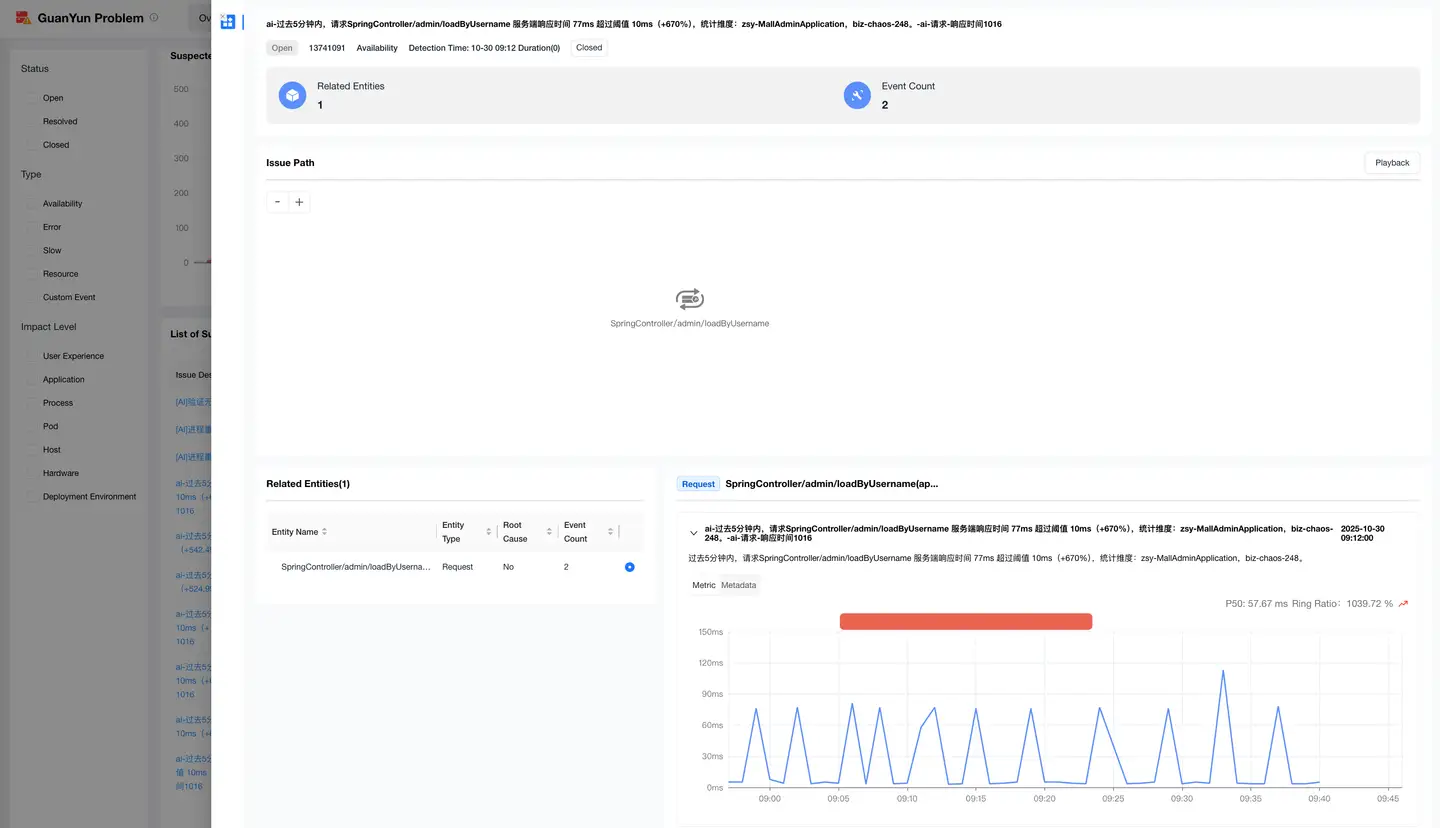
Problem Details
| Area | Item | Description |
|---|---|---|
| Problem Attributes | Status | Describes the current status of the problem |
| Problem ID | Unique identifier of the problem | |
| Type | Type of the problem | |
| Detection Time | Problem occurrence time and problem duration | |
| Statistics | Related Entities | Composed of alert entities and automatically detected anomaly entities |
| Event Count | Number of events generated by alerts | |
| Problem Path | Root Cause Propagation Path | Request-level topology diagram describing how the root cause propagates |
| Related Entities | Entity Name | Name of the entity object |
| Entity Type | Type of the entity, such as Host, Application, System | |
| Root Cause | Root cause entity | |
| Event Count | Number of alerts generated by the entity | |
| Events | Event Description | Description of the alert event |
| Event Metric Trend Chart | Metric trend chart of the alert event | |
| Event Metadata | Properties of the alert event |