Polaris
Feature Overview
The Polaris system helps teams quickly discover business issues and identify root causes by organizing, collecting, and calculating core metrics for key businesses, combined with anomaly detection and correlation analysis, to accurately pinpoint the real faults of failing businesses. This enhances business fault response efficiency and business continuity assurance capabilities.
| Term | Brief Explanation |
|---|---|
| Business Line | The name of the business organization or product line within the company, e.g., "E-commerce Business Line", "Mobility Business Line". |
| Polaris Metric (SLI) | Metrics that directly reflect whether the core value of the business is normal, e.g., Online User Count, Order Volume. |
| Evaluation Period | The time range for calculating the availability target. The system statistically analyzes and evaluates business availability based on this peroid. |
| Availability Budget | The total number of minutes of failure allowed within the evaluation period. |
| Availability Target (SLO) | The target service availability level the business should achieve within the evaluation period, e.g., 99.99%, 99.95%. |
Implementation Steps
- Identify key businesses, their corresponding core metrics, and the responsible persons for each business line based on business requirements.
- Configure the business lines and their corresponding core metrics.
- Configure alerts for core metrics. Alerts support three detection methods: static thresholds, dynamic baselines, and intelligent AI algorithms. Select the appropriate method based on business requirements.
- Polaris: View the health status of key businesses and core metrics.
- Fire Map: Analyze abnormal metrics and locate root causes. When core metrics are abnormal, you can quickly locate anomalies in the backend services associated with the business.
Configuration Guide
Prerequisites
- Before configuration, identify and confirm the business lines and core metrics that need monitoring, and clarify key information such as the responsible persons for each business line.
- If the business's core metrics are collected by Guanyun Agents, you can create the business line directly. If the core metrics for the business line are third-party metrics or composite metrics, you need to create the core metrics first.
Creating New Metrics
- Select Polaris from the left navigation bar.
- Click New Metric in the upper right corner of the page, and create the Polaris metrics for the business as needed on the Add Custom Metric page.
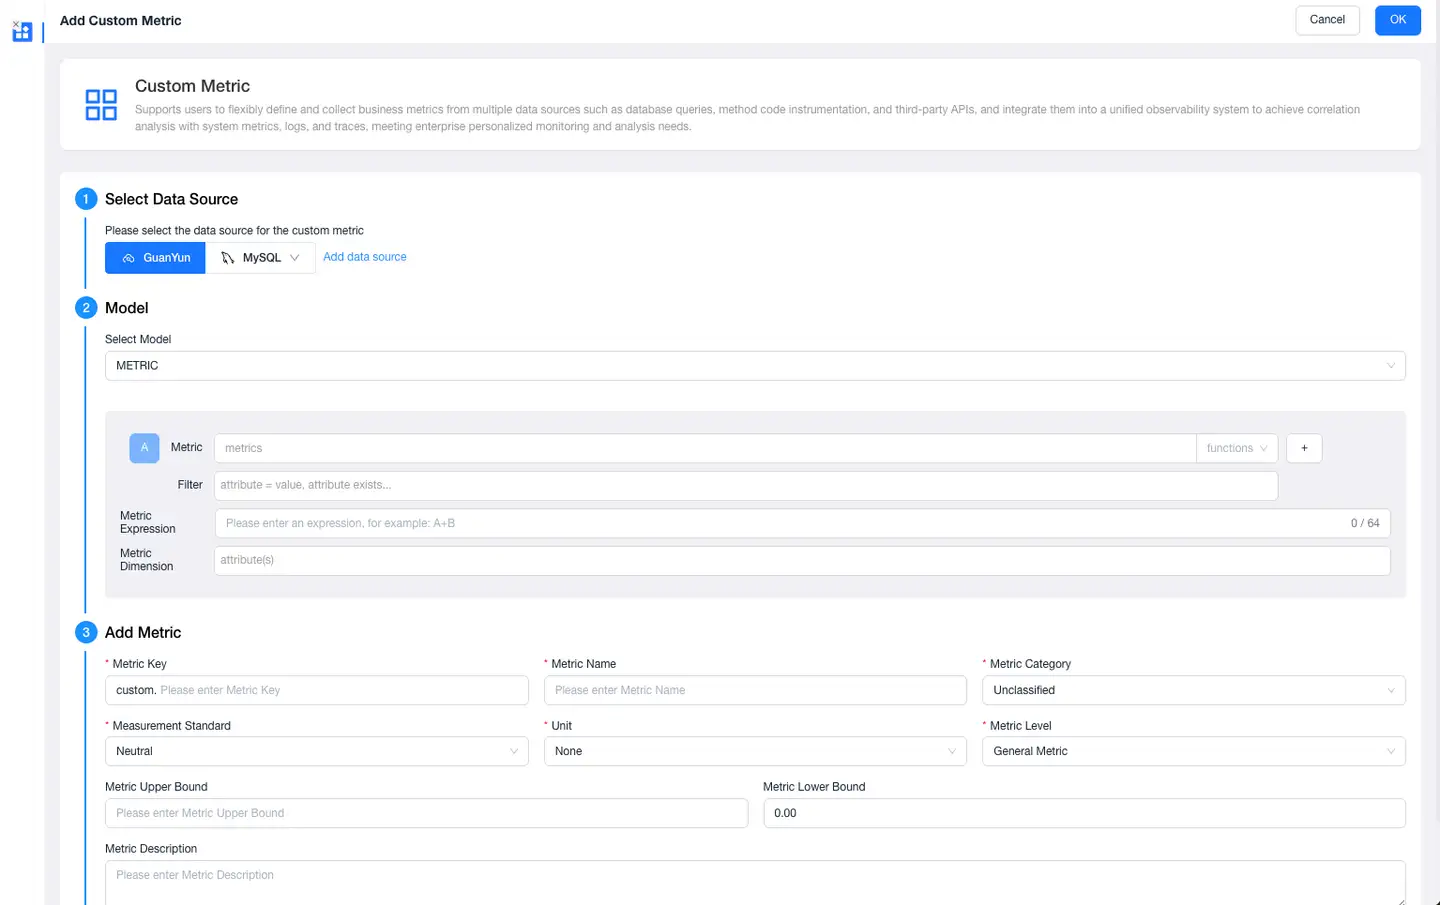
- Click OK. The newly added metric will be displayed in the metric system. You can view, edit, or delete this metric within the Metric System functional module.
Creating New Business Lines
Create New Business: On the Polaris page, click New Business in the upper right corner to enter the "New Business" page.
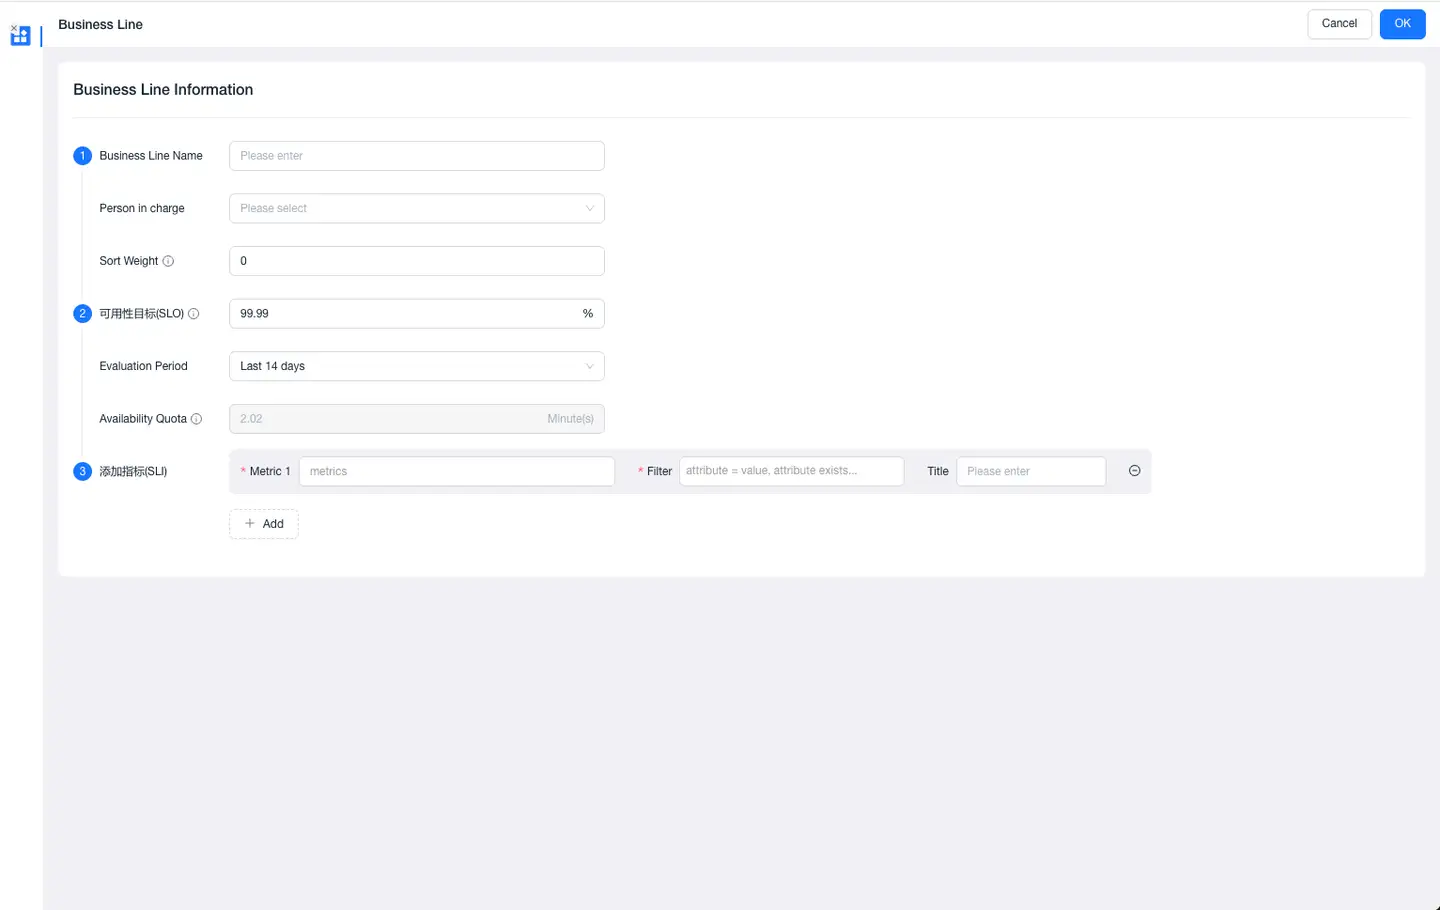
- Fill in Basic Information:
- Business Line Name: The name of the business organization or product line within the company, e.g., "E-commerce Business Line", "Mobility Business Line".
- Owner: The main responsible person for this business, typically the business or technical lead, responsible for business operation monitoring and anomaly handling.
- Sort Weight: Used to sort business lines on the Polaris homepage. Business lines are displayed in descending order of their sort weight.
- Availability Target (SLO): The target service availability level the business should achieve within the evaluation period.
- Evaluation Period: The time range for calculating the availability target. The system statistically analyzes and evaluates business availability per this cycle.
- Availability Budget: The total duration of failure allowed within the evaluation period.
- Add Metrics (SLI):
- Select a core metric from the list.
- (Optional) Set filter conditions by selecting one or more entities associated with this metric.
- Save: After verifying the information is correct, click OK.
After successful creation, the system will begin calculating the availability for this business. You can view the availability and related information for each business line on the Polaris homepage.
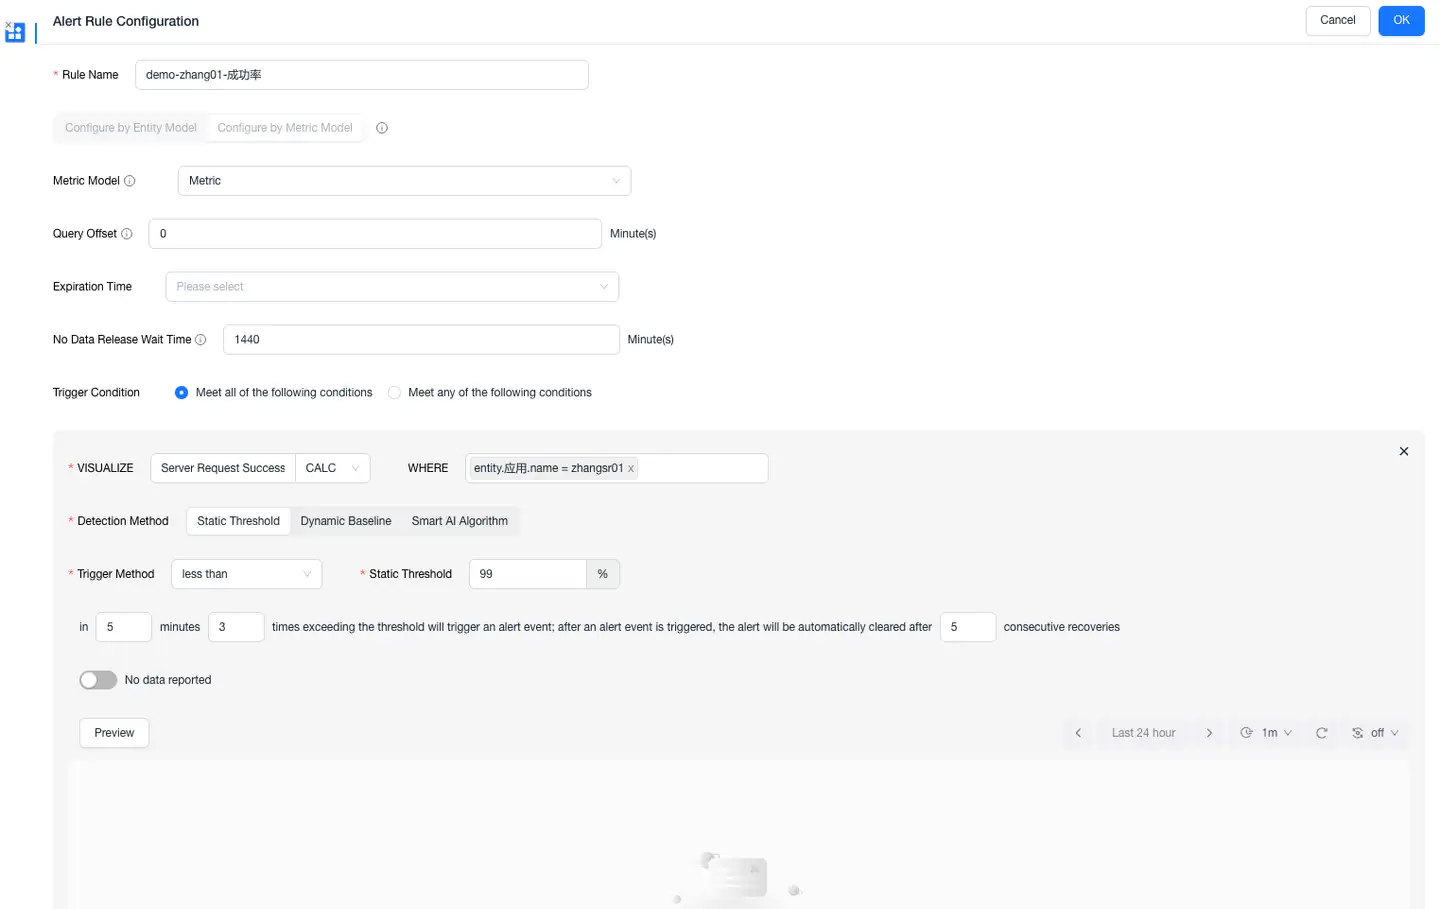
Configuring Alerts
From the Polaris homepage, click a business card to enter its details page, which displays the trend chart for each Polaris metric. Click the alert icon ![]() to enter the alert configuration page and configure alerts for the selected metric.
to enter the alert configuration page and configure alerts for the selected metric.
- Alert rules support three detection methods: Static Threshold, Dynamic Threshold, and Intelligent AI Algorithm. Select the appropriate method based on business requirements.
- Alerts support multiple trigger methods, configurable based on requirements.
- Supports adding notification policies and recipients.
Polaris Homepage
The Polaris page displays all business cards. Business cards use different colors to indicate the health status of the business:
- Gray Card: Indicates the business is normal.
- Red Card: Indicates the business has abnormal metrics requiring immediate attention.
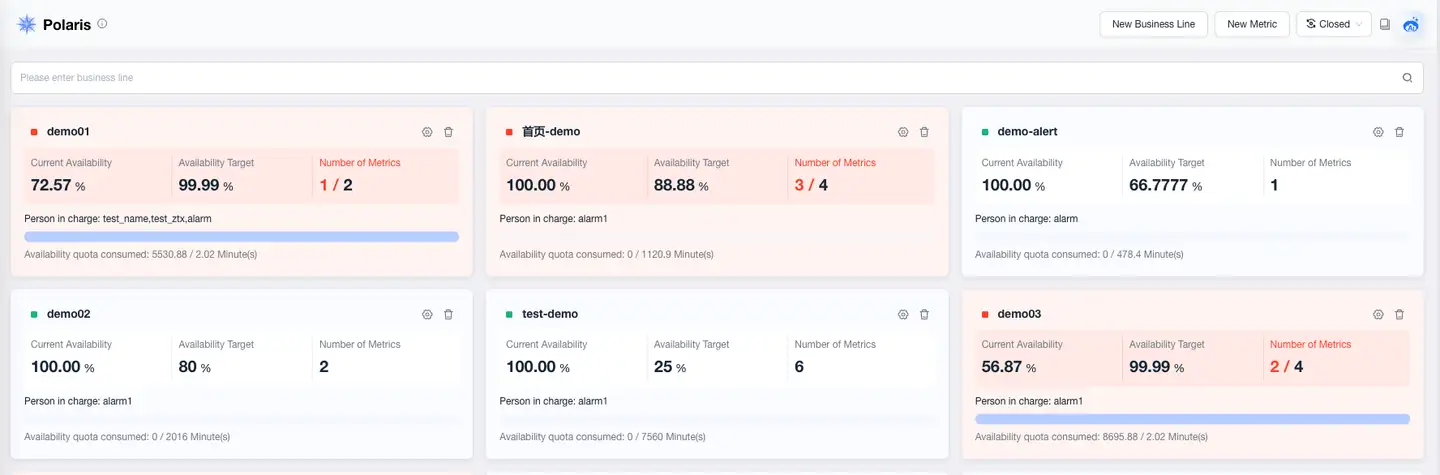 The business card displays information such as Current Availability, Availability Target, and Number of Metrics. The information items are explained as follows:
- Current Availability: Refers to the actual availability level achieved by the business within the current evaluation period (i.e., the "Evaluation Period" configured when creating the business line), usually expressed as a percentage. Calculation method: (1 - Actual Business Failure Minutes / Total Minutes in Evaluation Period) × 100%. "Actual Business Failure Minutes" refers to the duration where core metrics triggered alerts and were confirmed as failures.
- Availability Target: The "Availability Target" configured when creating the business line (e.g., 99.99%), representing the planned stability level for the business.
- Number of Metrics: Displays the relationship between abnormal metrics and the total number of configured core metrics for this business, shown as "Abnormal Metric Count / Total Metric Count". For example, "1 / 2" indicates the business has 2 monitoring metrics in total, with 1 metric currently in an abnormal state. When "Abnormal Metric Count ≥ 1", the business card turns red (requires immediate attention). A higher count indicates a broader impact of the business fault.
- Owner: The business owner configured when creating the business line (multiple selections possible). Their primary responsibility is to receive alert notifications and coordinate fault investigation when the business is abnormal.
- Availability Budget: Shows the usage of the failure time budget against the Availability Budget for the current evaluation period (i.e., the "Evaluation Period" configured when creating the business line), displayed as "Actual Business Failure Minutes / Availability Budget". For example, "3 / 12.24 minutes" indicates 24.5% of the availability budget has been consumed; "12.24 / 12.24 minutes" means the availability budget is exhausted, and fixing the fault should be prioritized.
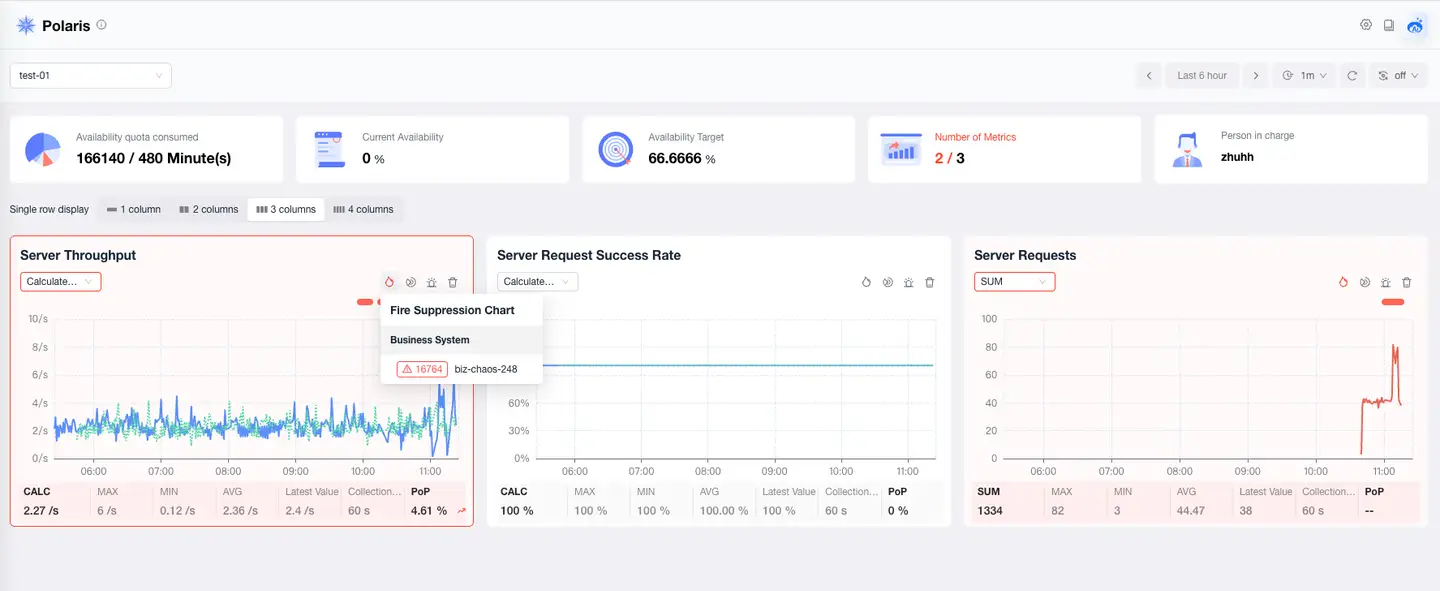
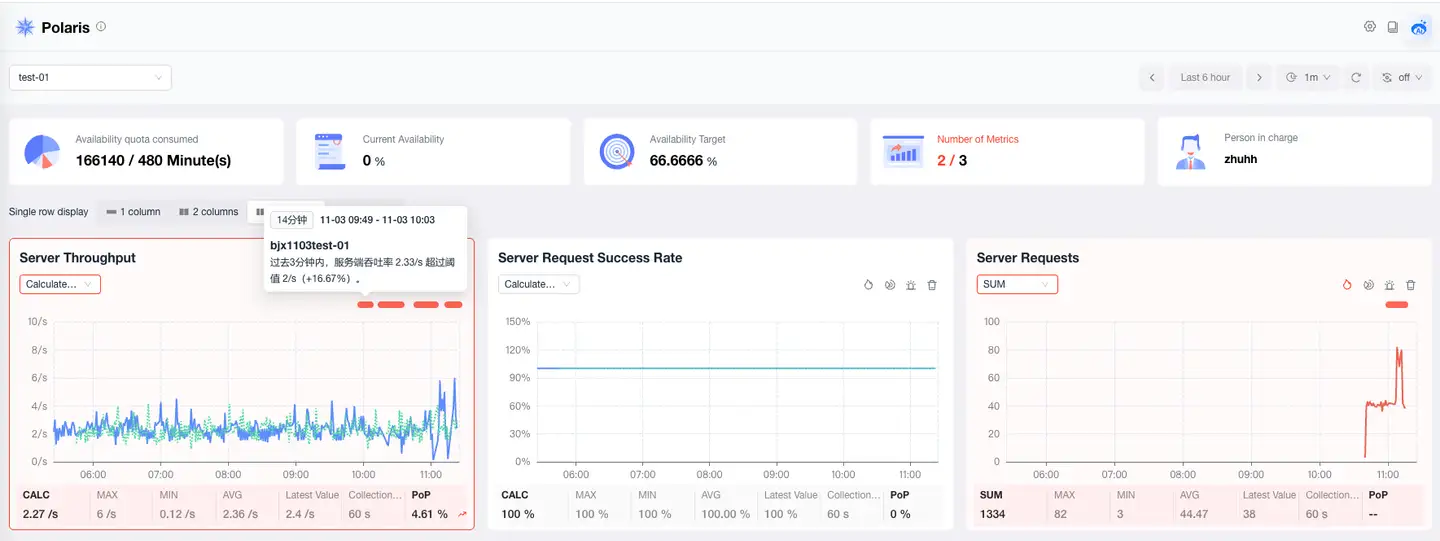
Polaris Details
- On the Polaris homepage, click a red business card to enter its details page. The details page displays trend charts for all core metrics under the selected business. Red trend charts indicate abnormal metrics.
- Hover the mouse over the red marked areas on the abnormal metric trend chart to view alert details.
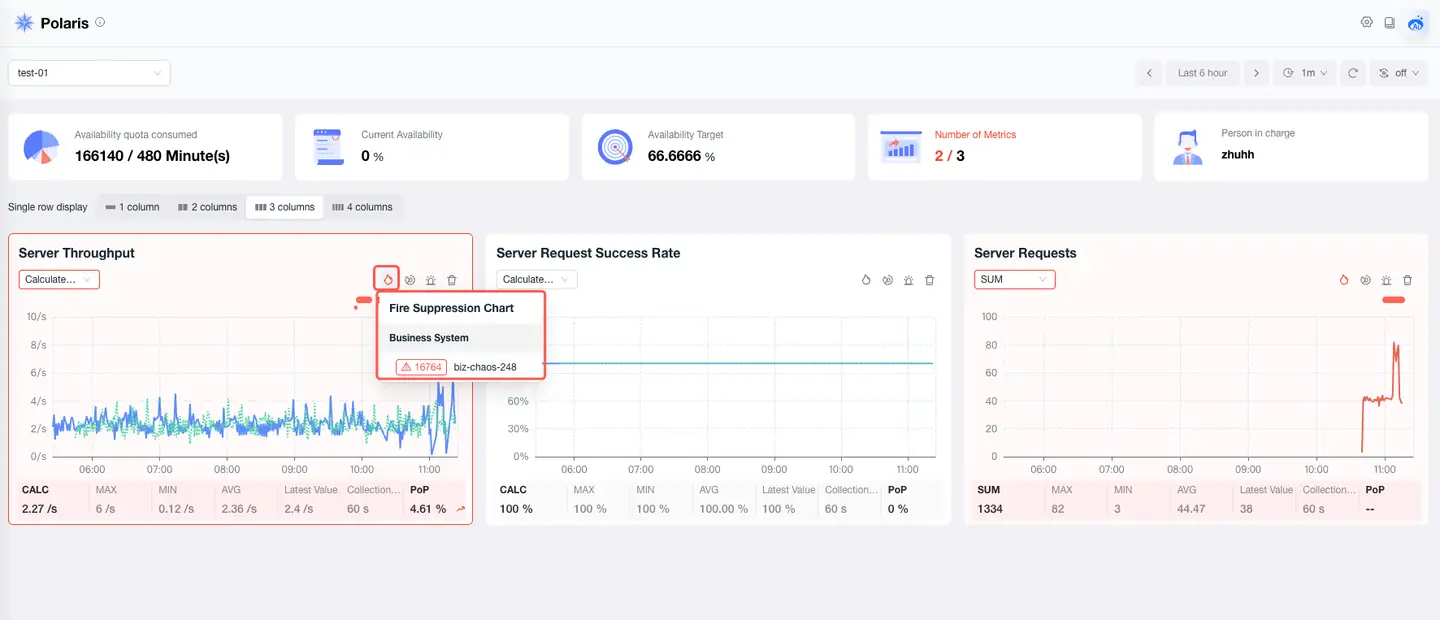
- Analyze the root cause of the fault using the following methods:
- Click the Fire Map icon
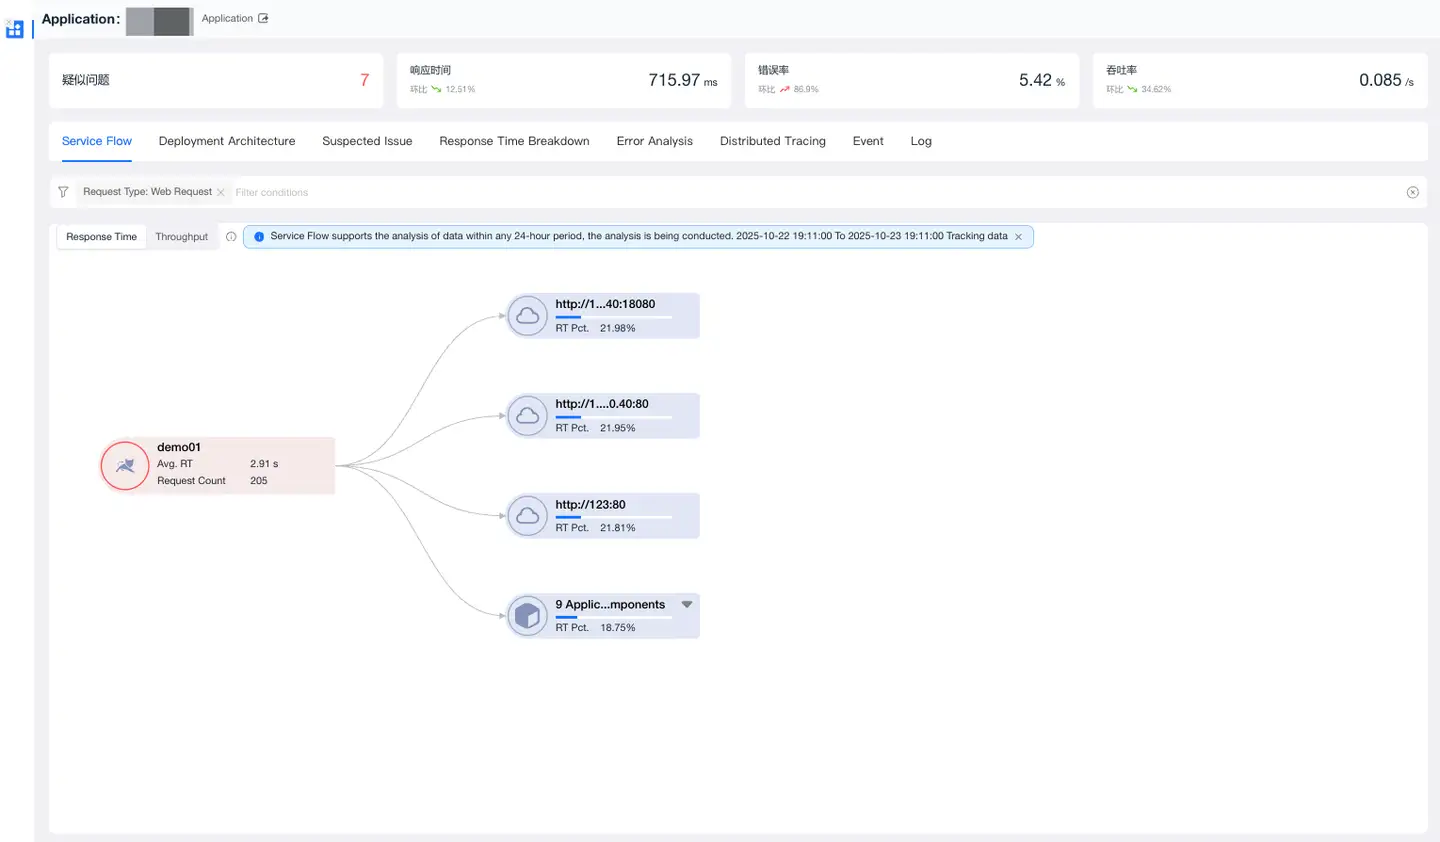
 in the upper right corner of the abnormal metric trend chart. In the pop-up Fire Map, view the status of entities associated with the current metric (e.g., applications, services, interfaces). Red nodes indicate abnormal associated entities. Click entity information to display the details page for that entity, including metrics, suspected issues, logs, traces, etc., helping to quickly locate the root cause.
- Click the Multidimensional Exploration icon
 to jump to the Multidimensional Exploration page. There, you can perform free data queries and ad-hoc analysis on this metric based on different aggregation methods, filter conditions, and grouping methods.
- Click the Fire Map icon
Fire Map
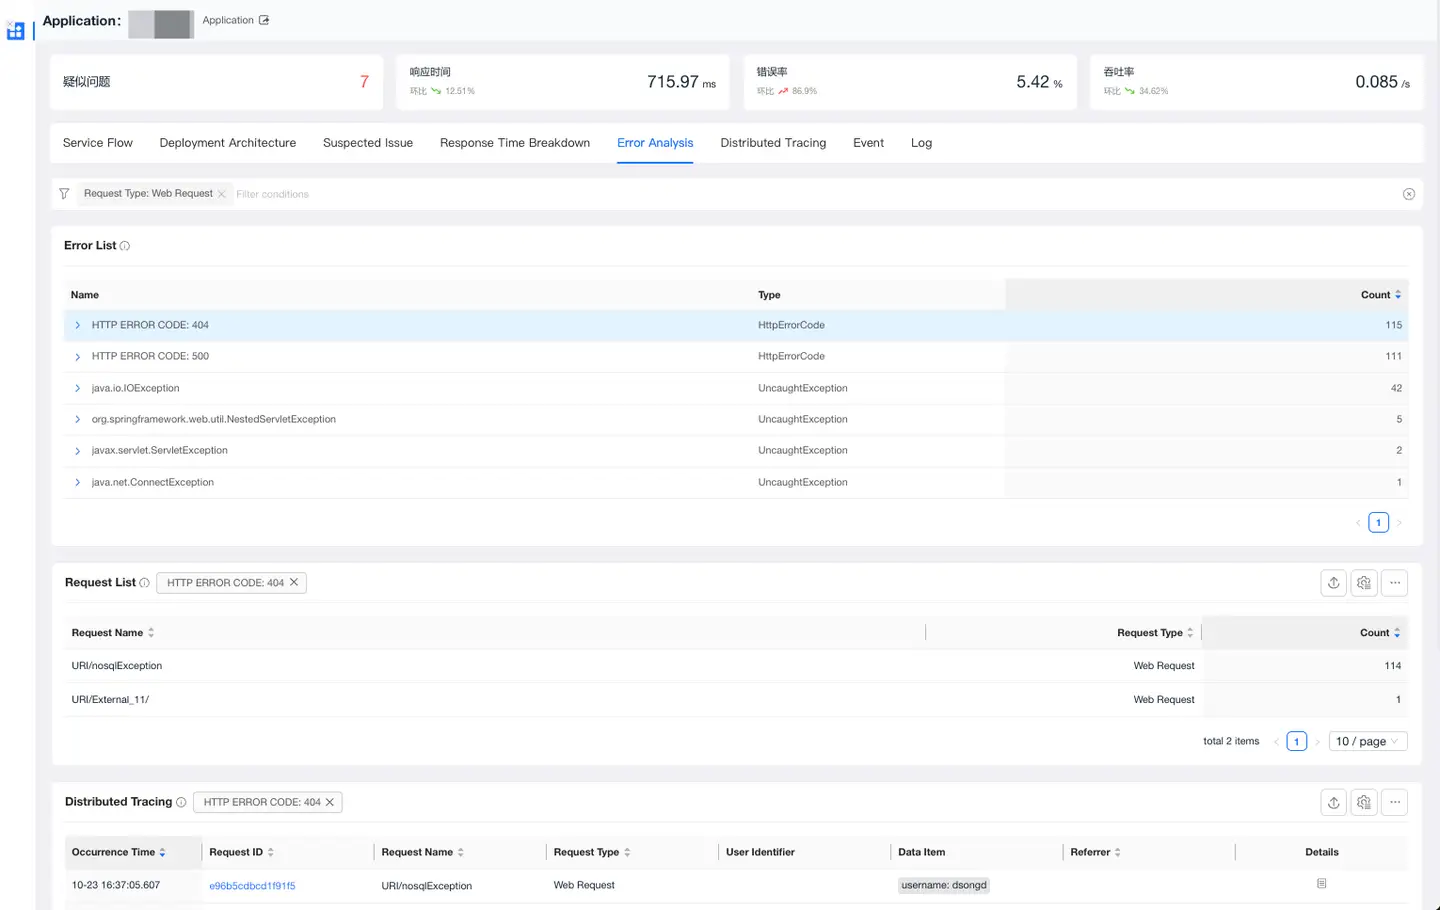
Click an entity in the Fire Map to view its details, including Metrics, Relationships, Suspected Issues, Traces, Events, Logs, and Scenario Analysis. For example:
-
When a login success rate alert triggers, you can analyze the errors and traces related to the login process to locate the root cause of the error and the code where the error occurred, helping you quickly pinpoint the root cause.
-
The Fire Map can help organize the call relationships between requests and services, aiding in locating issues where downstream services cause anomalies in the current service.