Metric System
Feature Overview
The Metric System is a comprehensive integrated monitoring and analysis tool designed to provide enterprises with deep insights into system performance, application health status, and business operations. With rich functional modules and advanced data processing technology, it helps enterprises achieve intelligent monitoring, precise analysis, and efficient optimization.
Core Capabilities
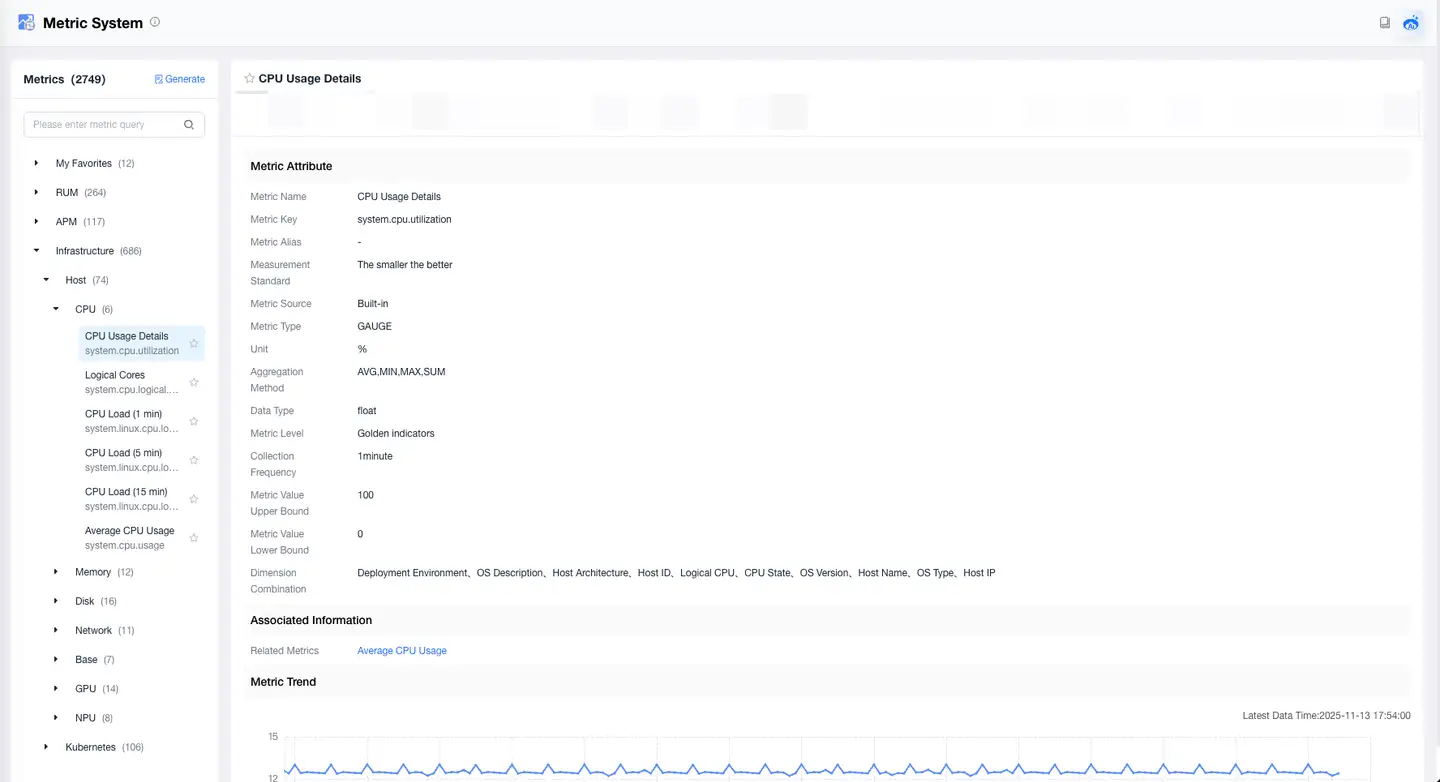
1. Metric Definition and Management
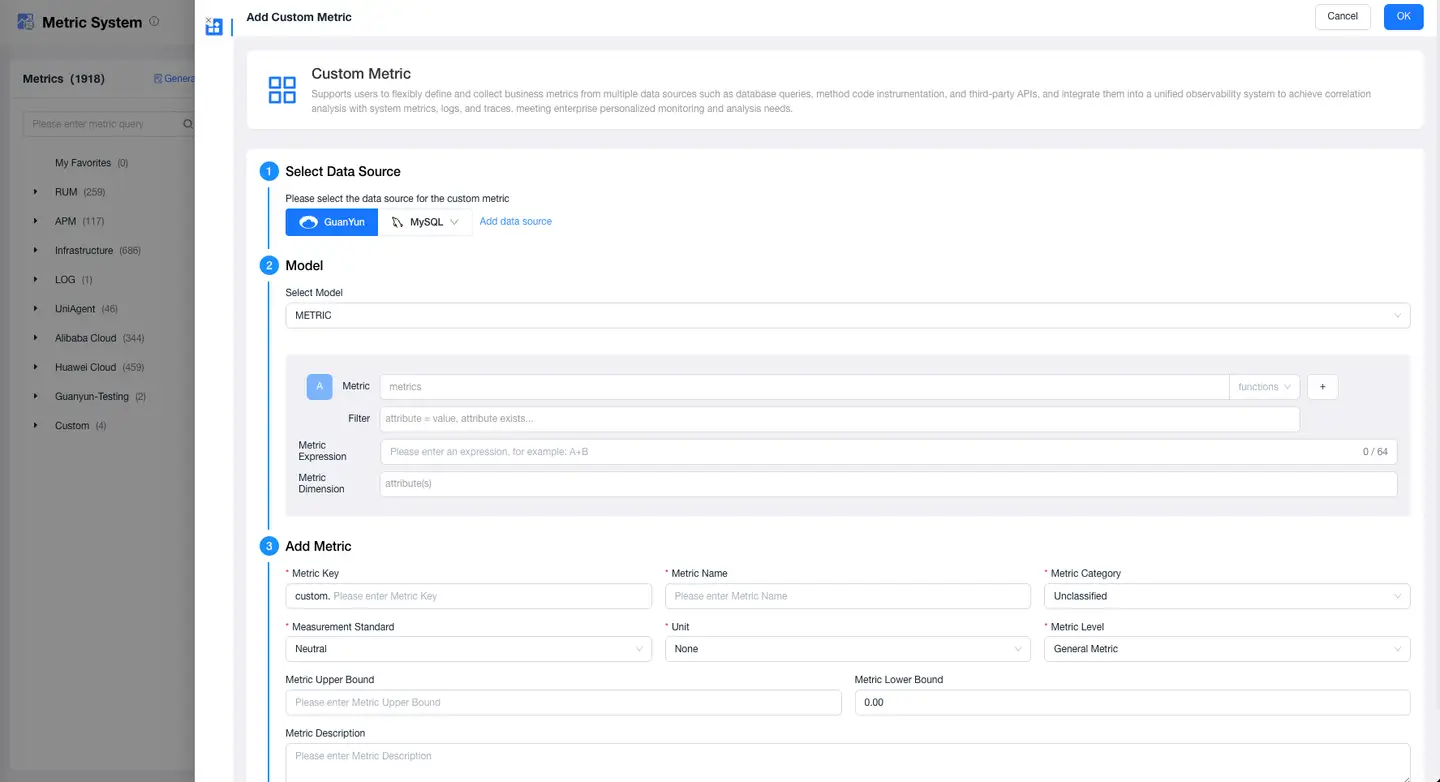
- Custom Metric Creation:
- Definition Freedom: Allows users to define any business-related metrics, such as CPU usage, memory consumption, request response time, etc.
- Complex Calculation Support: Supports complex calculation formulas, allowing users to generate derived metrics based on raw data.
- Metric Templates and Presets:
- Industry Templates: Provides various industry-standard metric templates to help users get started quickly.
- Template Customization: Users can adjust and extend based on preset templates to meet specific requirements.
- Grouping and Hierarchy Management:
- Metric Grouping: Groups metrics by functional modules, system components, or business processes for easy management and viewing.
- Hierarchical Structure: Supports creating multi-level metric systems for layered subdivision and summary analysis.
2. Real-time Data Monitoring
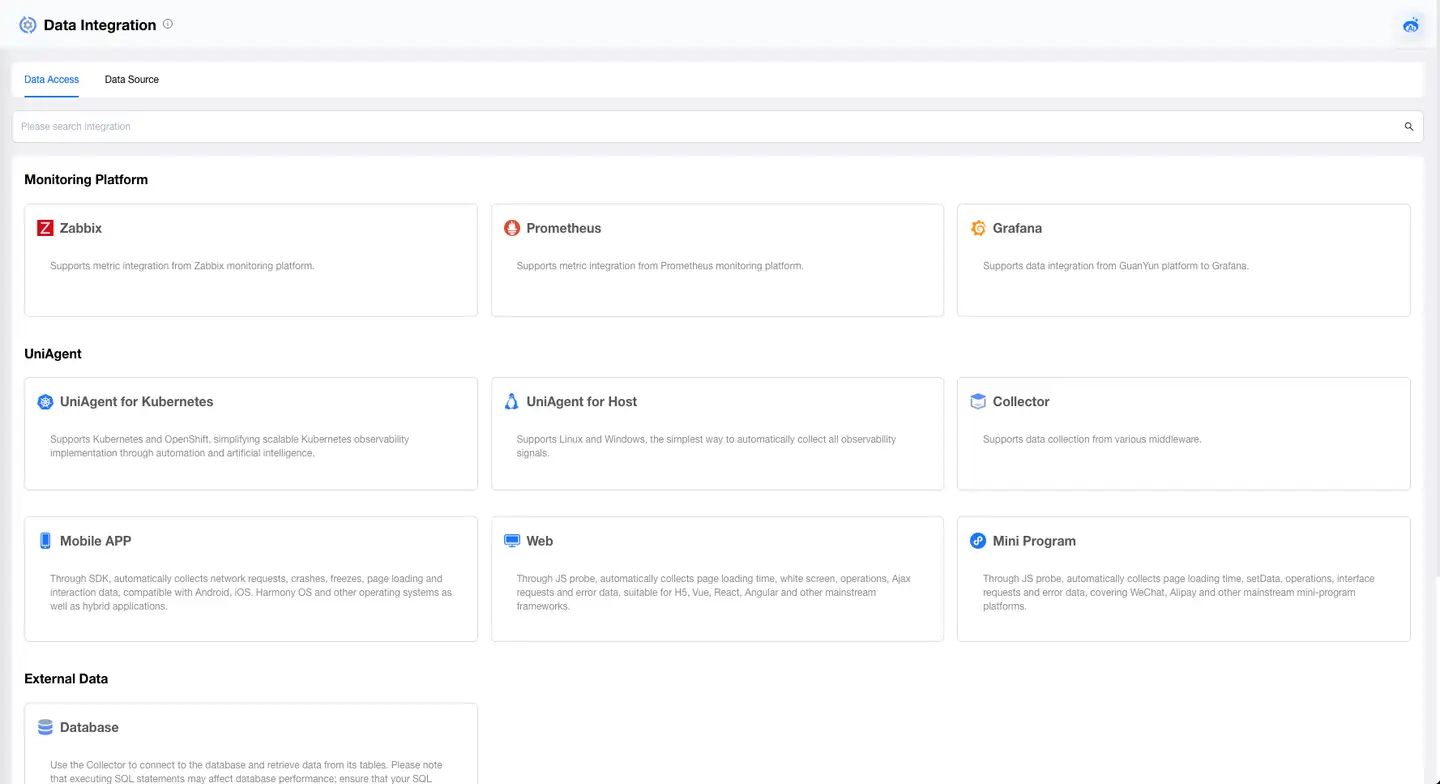
Real-time Data Collection:
- High-frequency Data Collection: Supports high-frequency data collection from various systems and applications, ensuring accuracy of real-time monitoring.
- Data Source Diversity: Supports obtaining information from multiple data sources, including Zabbix, Prometheus, etc.
Data Stream Processing:
- Stream Processing Engine: Utilizes stream processing technology to process and analyze real-time data, supporting high-throughput and low-latency data processing.
- Data Filtering and Aggregation: Filters, aggregates, and transforms stream data to meet real-time monitoring requirements.
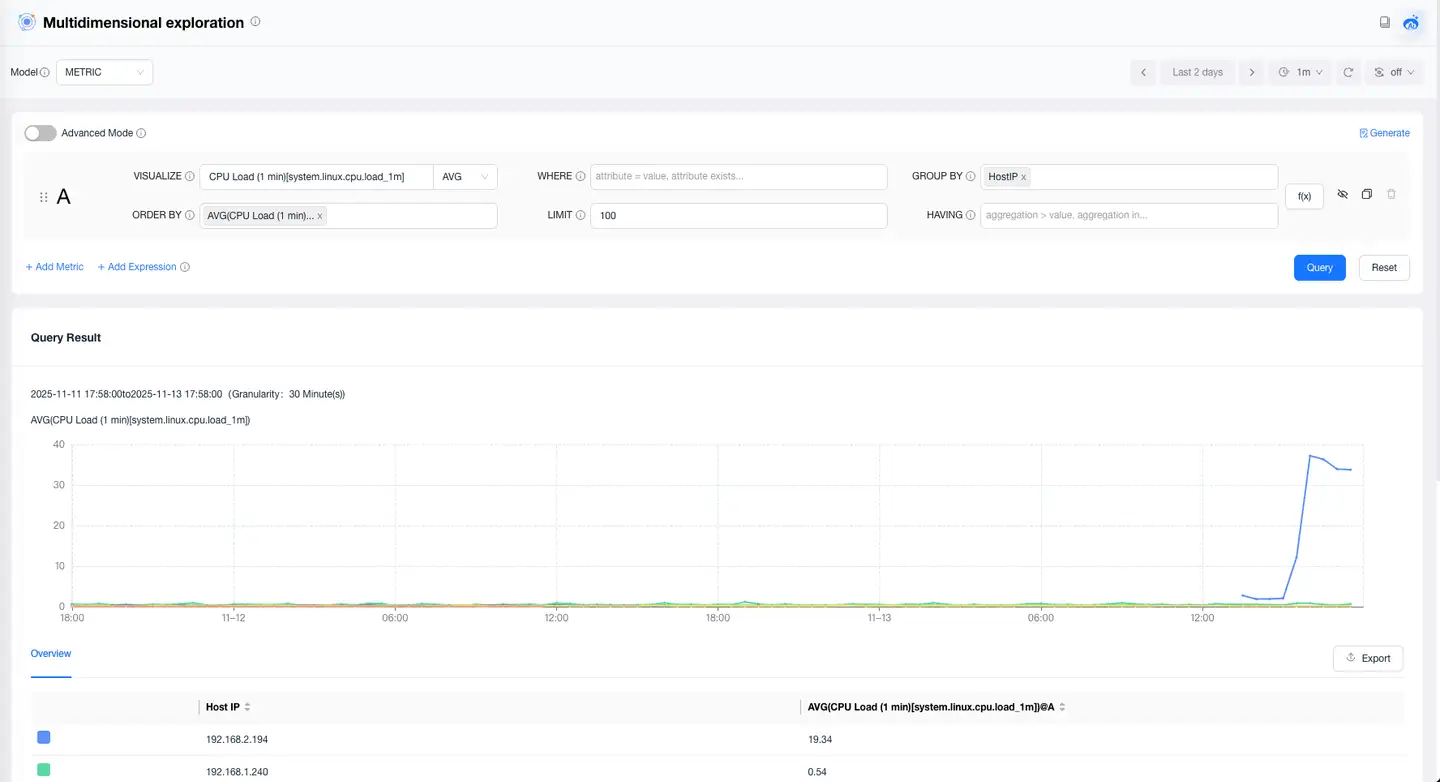
Interactive Analysis:
- Real-time Filtering: Users can perform interactive filtering on real-time dashboards to view data for specific time ranges or conditions.
- Data Drilling: Supports data drilling functionality, allowing users to drill down from high-level views to detailed metric data and event logs.
Data Updates and Refresh:
- Auto-refresh: Supports automatic data refresh to ensure dashboard and monitoring interface information is always current.
- Manual Refresh: Allows users to manually trigger data refresh to obtain the latest data when needed.
Real-time Data Visualization:
- Dynamic Charts: Provides dynamically updated charts that reflect data changes in real-time, helping to quickly identify issues.
- Graphical Display: Includes line charts, bar charts, heat maps, and other graphical display methods to help users understand data trends and anomalies.
3. Model Conversion
The model conversion function supports converting SPAN and RUM data models to Metric models, meeting the conversion requirements from raw data to metric data. Through this function, detailed distributed tracing data (SPAN) and real user monitoring data (RUM) can be converted into structured measurement data (Metric), providing a solid data foundation for long-term data storage and alert systems. This process ensures efficient data utilization and precise analysis, improving the timeliness and accuracy of system monitoring and early warning.
4. High-cardinality Data Degradation
Supports automatic degradation of high-cardinality data to low-cardinality data when converting SPAN and RUM models to Metric models. By reducing dimensional complexity, this function effectively reduces storage costs and improves query efficiency. It ensures that key metric data is preserved while optimizing storage resources and query performance, suitable for large-scale data processing and real-time analysis requirements, improving overall system performance and cost-effectiveness.
5. Grafana Integration
Seamless integration with Grafana through the Grafana data source plugin to achieve data visualization. This plugin allows users to directly connect all data sources within the metric system to Grafana, thereby leveraging Grafana's powerful data visualization capabilities to create dynamic dashboards and charts. Users can access, query, and display real-time and historical data from different systems in Grafana, achieving in-depth data analysis and real-time monitoring. The plugin supports custom queries, filtering, and data aggregation, ensuring that displayed content accurately meets user requirements. This integration enhances the flexibility and operational efficiency of data visualization, providing users with a more comprehensive and intuitive monitoring experience.
6. Lite Application Integration
Supports using metric system data as data sources for lite applications to meet various metric usage requirements. Through this function, users can integrate data from the metric system into lite applications to achieve personalized data display and analysis. Lite applications allow users to create specialized interfaces and interactive tools for customized data processing and display. This includes dynamic reports, real-time monitoring panels, custom views, etc. Users can design application functions according to actual business requirements and operational habits. Additionally, lite applications support data filtering, aggregation, and analysis functions, enabling users to easily obtain and operate key metric data. Through this approach, enterprises can develop applications that meet business scenarios according to specific requirements, improving data utilization efficiency and business decision accuracy.