Building Your First Observability Dashboard in 3 Minutes
This guide will walk you through quickly creating a professional data visualization dashboard. Whether for business analytics, user monitoring, or system performance display, you can complete the setup with the following simple steps.
Choose the Best Starting Point
Tingyun offers three creation methods to meet the needs of users with different experience levels:
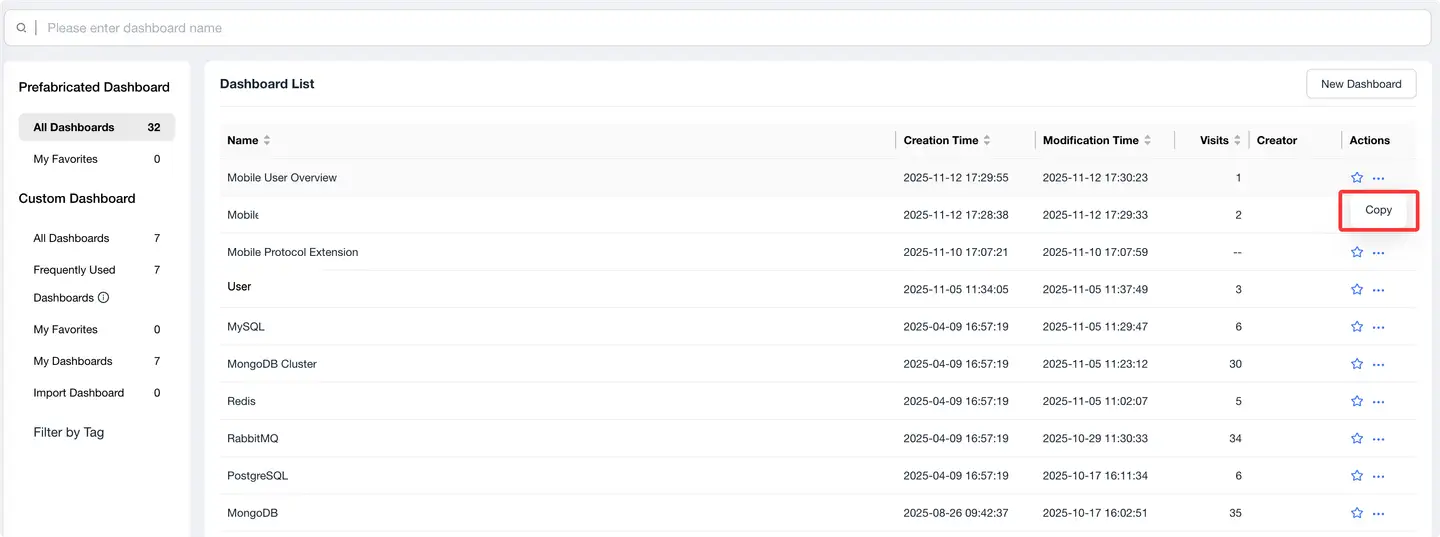
🌟 Recommended: Starting from Template Library (For Beginners)
-
Ready to Use: 30+ curated scenario templates
-
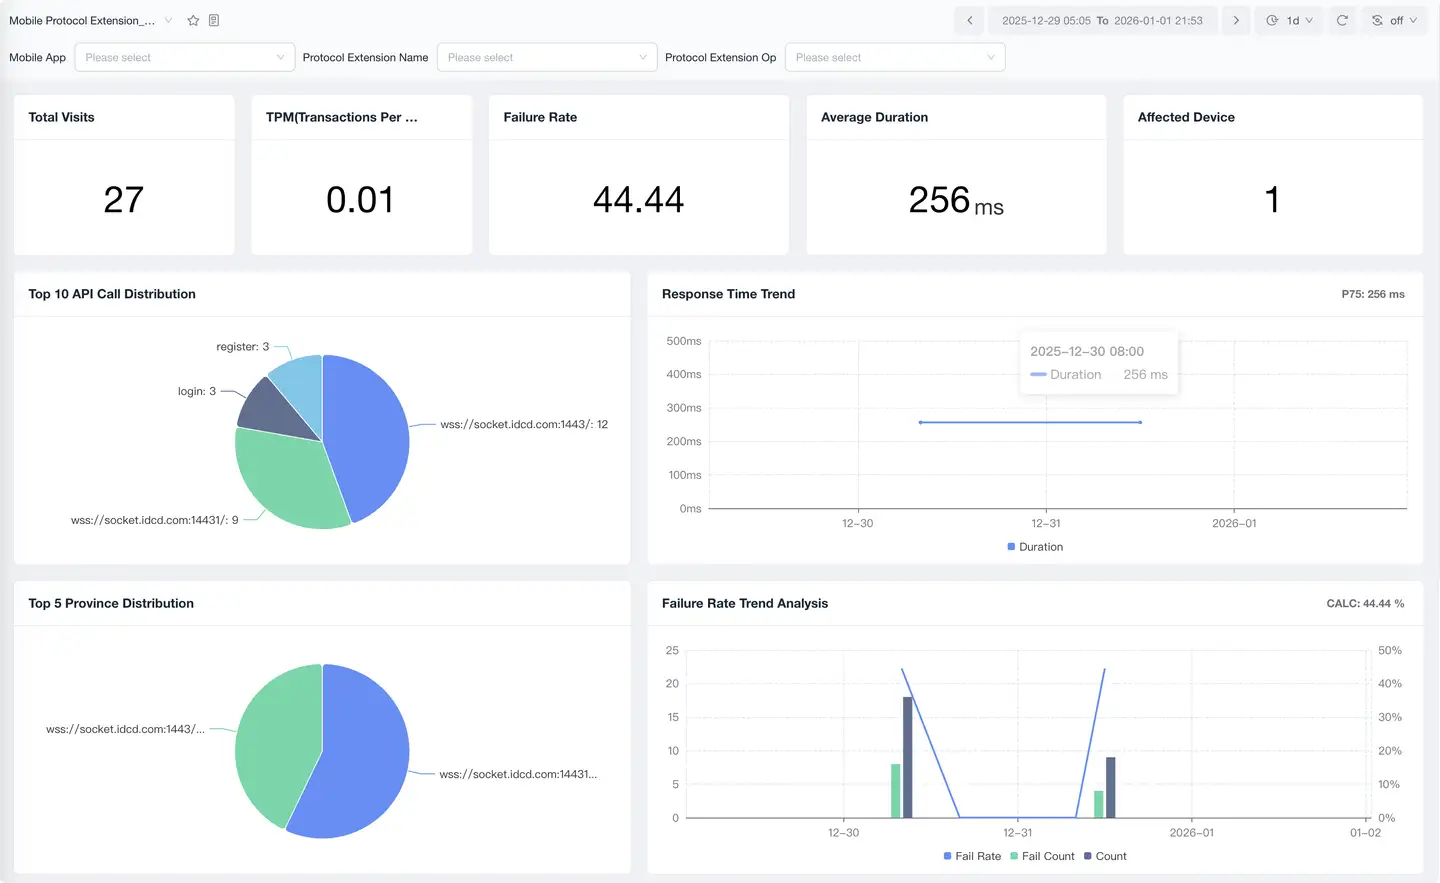
Coverage Scenarios:
- Business operations analysis
- User behavior insights
- System performance monitoring
-
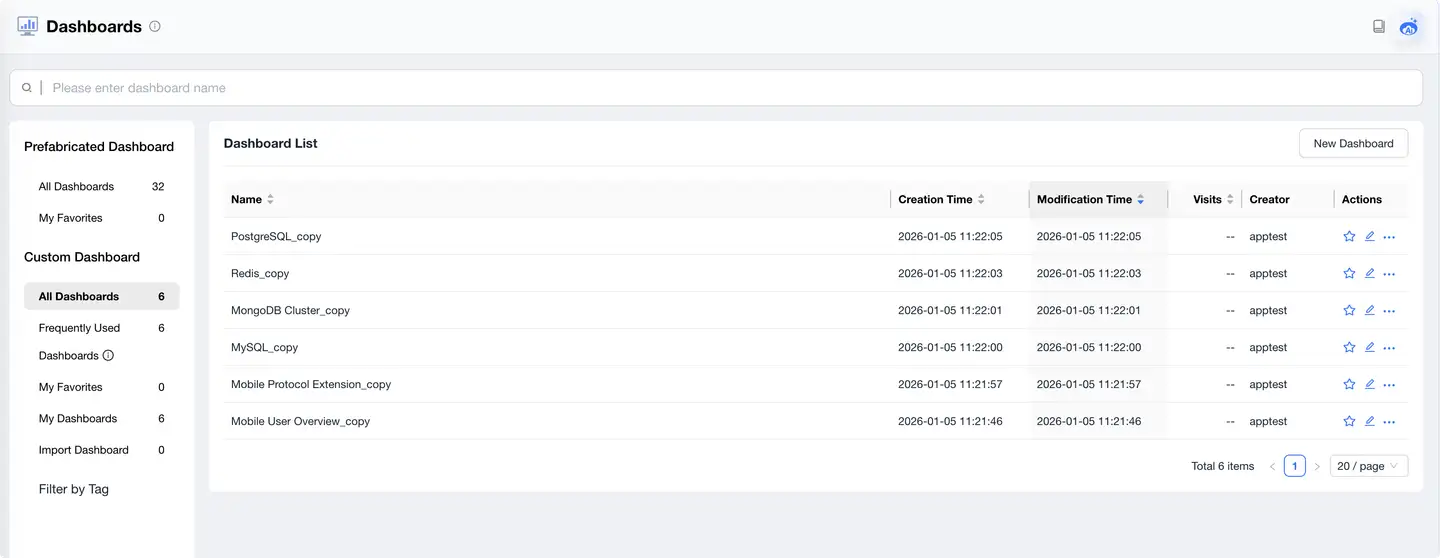
How to Use:
- Browse the template library and select an appropriate scenario
- Click [Copy Template]
 3. Modify the name (default is original name + "_copy")
4. Start personalized adjustments
3. Modify the name (default is original name + "_copy")
4. Start personalized adjustments
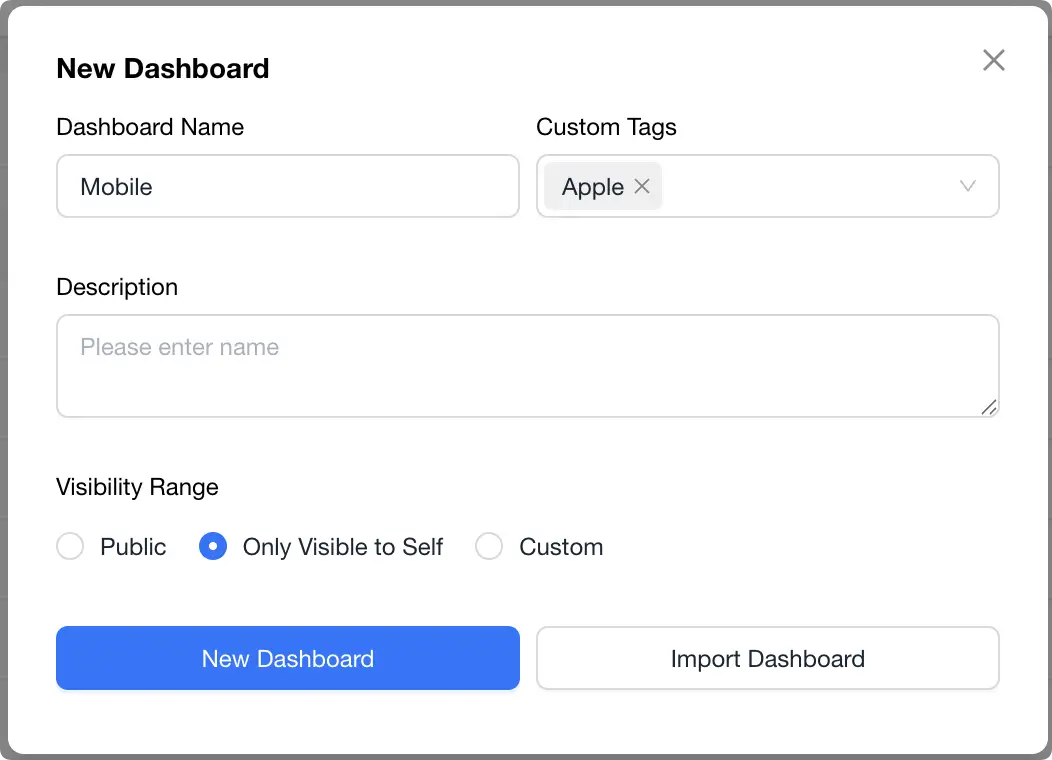
✨ Creating from Blank (For Experienced Users)
Basic Configuration:
-
Dashboard Name
- Recommendation: Use a name that clearly expresses the purpose
- Limit: Maximum 64 characters
- Examples: "Order Conversion Analysis", "User Behavior Dashboard"
-
Business Tags
- Purpose: Facilitate categorization and quick search
- Limit: Single tag maximum 14 characters
- How to Add:
- Enter new tags directly
- Select from existing tags
-
Description
- Content: Brief explanation of purpose and key metrics
- Limit: Maximum 256 characters
- Recommendation: Include key information for team understanding
-
Access Permissions
- Public: Visible to entire workspace
- Private: Visible only to creator
- Custom:
- Select specific members or user groups
- Support setting view/edit permissions
- Suitable for team collaboration scenarios
📋 Importing Existing Dashboard
Suitable Scenarios:
- Cross-environment migration of data dashboards
- Sharing best practices between teams
- Backup and restoration
Operation Steps:
- Click [Import Dashboard]
- Select local JSON configuration file
- Confirm import and adjust configuration
🎯 Best Practice Recommendations
-
Naming Conventions
- Use "Business-Scenario" format
- Example: "Order Center-Experience Analysis"
-
Permission Settings
- Recommend setting to private when creating tests
- Invite team members to collaborate after confirming everything is correct
-
Tag Management
- Establish a unified tag system
- Make good use of tags for categorization
-
Collaboration Efficiency
- Add clear description information promptly
- Regularly organize and update outdated content
Tip: For first-time users, we recommend starting with templates. This allows you to quickly understand best practices and improve dashboard building efficiency.