VisBoard
Feature Overview
The VisBoard delivers professional-grade data visualization capabilities for the observability platform.It features built-in multi-scenario visualization templates with drag-and-drop layout and flexible component configuration, enabling rapid creation of specialized dashboards tailored to specific business needs. You can easily adjust styles and data sources without deep coding knowledge, achieving intuitive presentation of complex data to fully address diverse display requirements such as business monitoring, risk alerts, and trend analysis.
Access Entry
In the left navigation bar, select All Apps, then choose Observe and explore > VisBoard from the pop-up lite applications list.
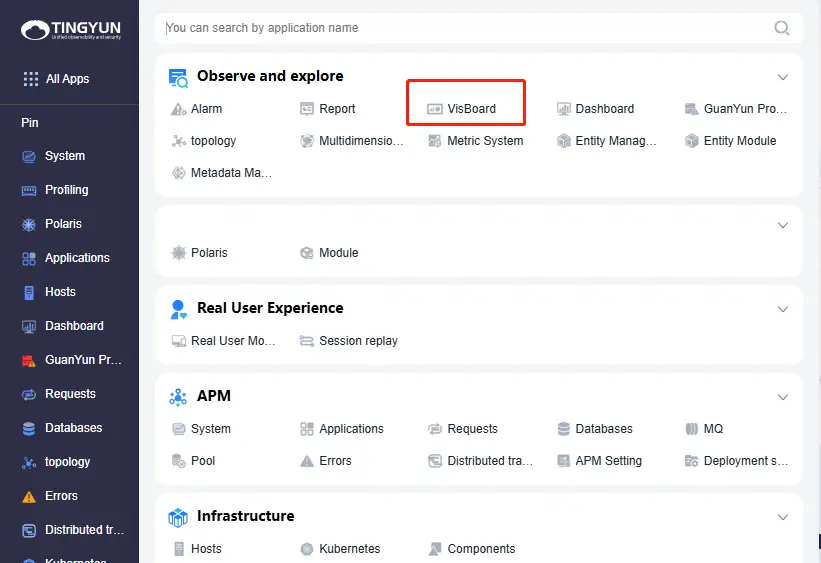
Alternatively, you can click the VisBoard lite application in the left dock bar to access it.
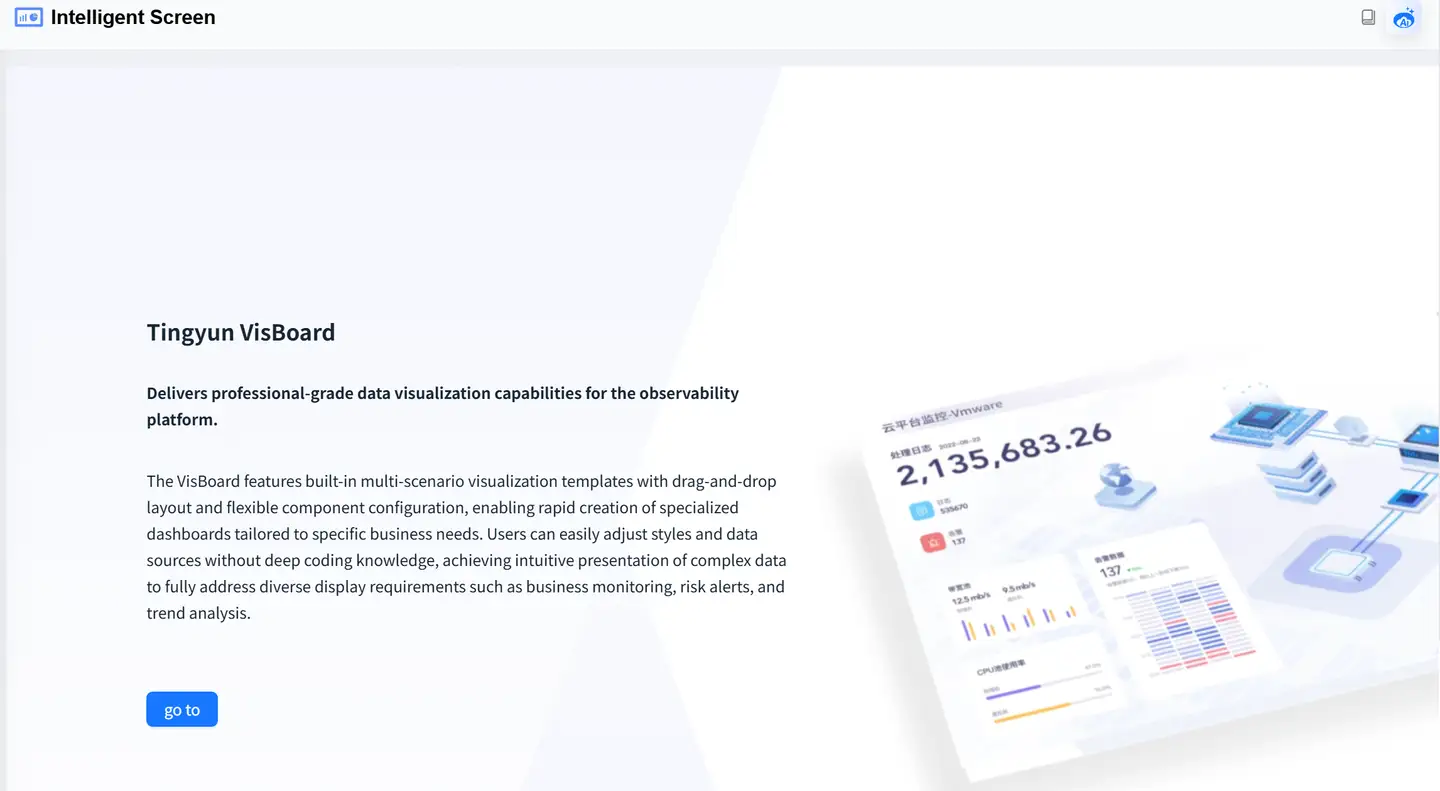
Click the "go to" button.
Documentation Links
- Feature Overview: Detailed descriptions of VisBoard's functional operations.
- API Integration Specification: API integration specifications for various components.
- Component Guide: Detailed usage guide for built-in VisBoard components.
- Component Development Guide: Guide for developing custom components.