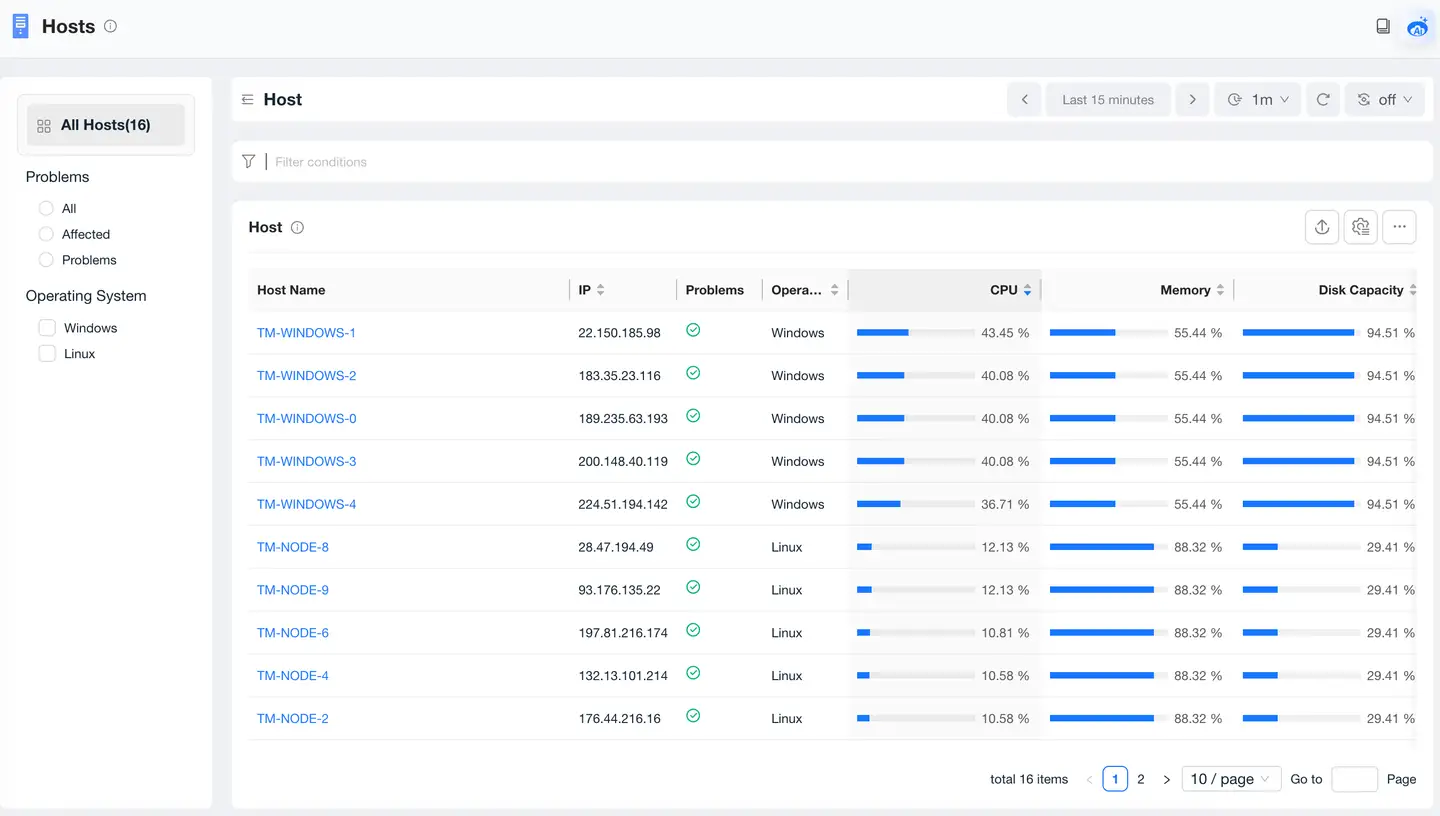
Host Monitoring
Host Monitoring List
Through the host monitoring page, you can view the current running status of all monitored hosts in Linux, Windows, and AIX operating systems. Click the icon blocks at the top of the page to see the host name, IP, CPU, memory, disk capacity, and network throughput metrics of the corresponding type of currently monitored hosts. You can sort by the value of different metrics to quickly identify hosts with full capacity indicators and find hosts with tight current resources for expansion or service migration. The color of the dot before the host name indicates the data reception status. Green indicates normal agent data reception, and red indicates abnormal.
Host Overview
-
Metrics: Displays key host metrics including CPU usage, memory usage, network I/O, and disk I/O. Supports clicking the All Metrics button in the upper right corner to view all metric trend charts of the host.
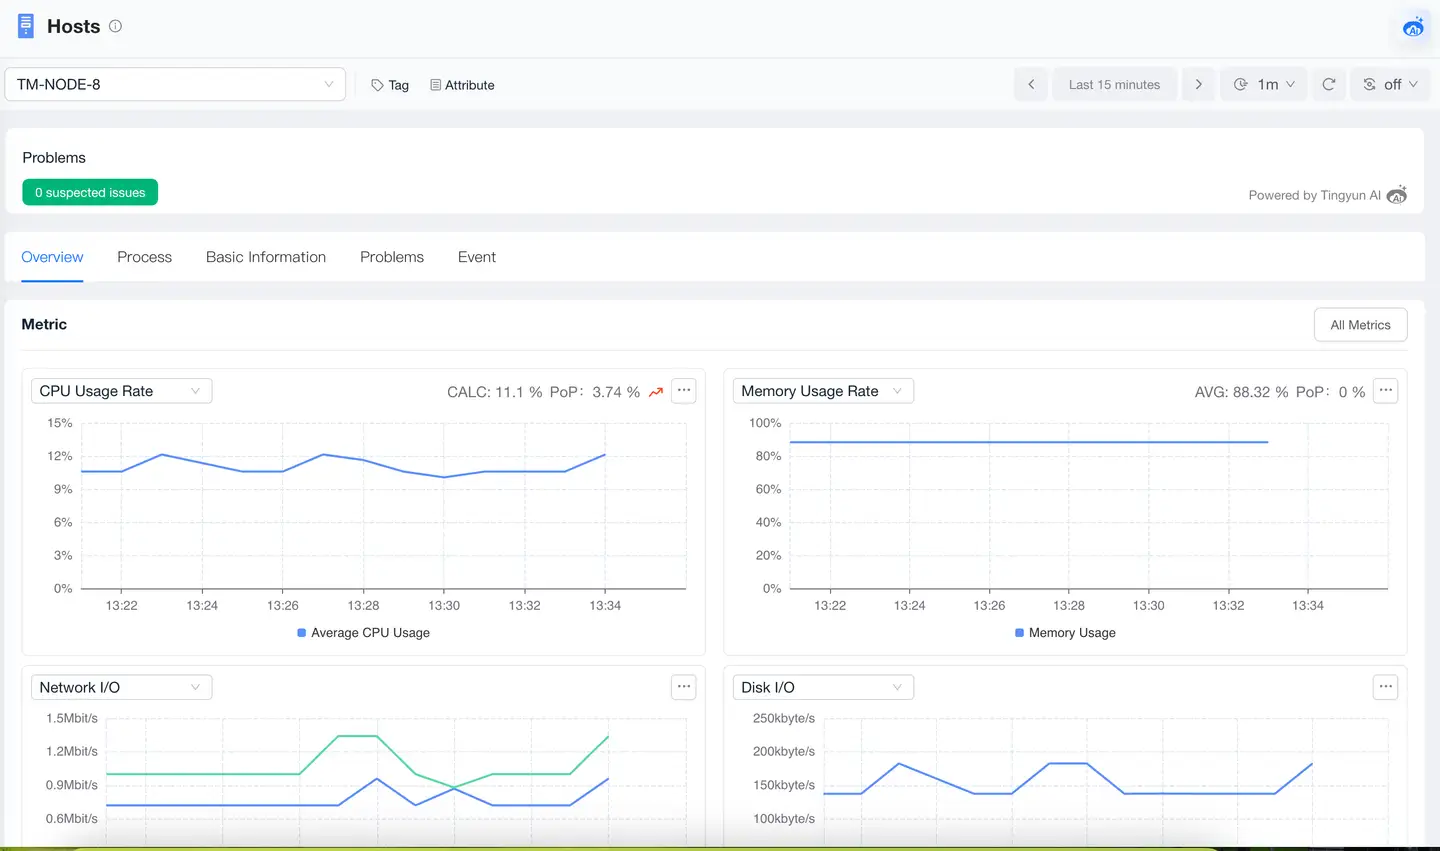
-
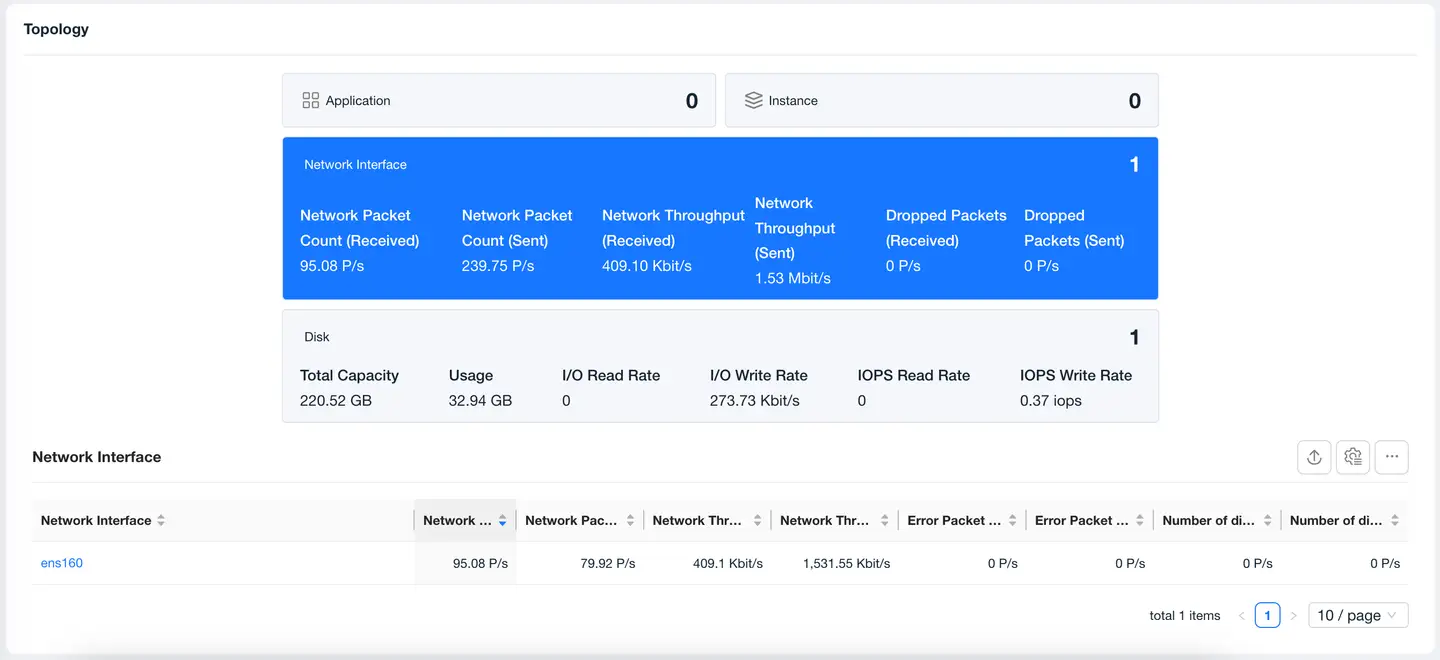
Relationships
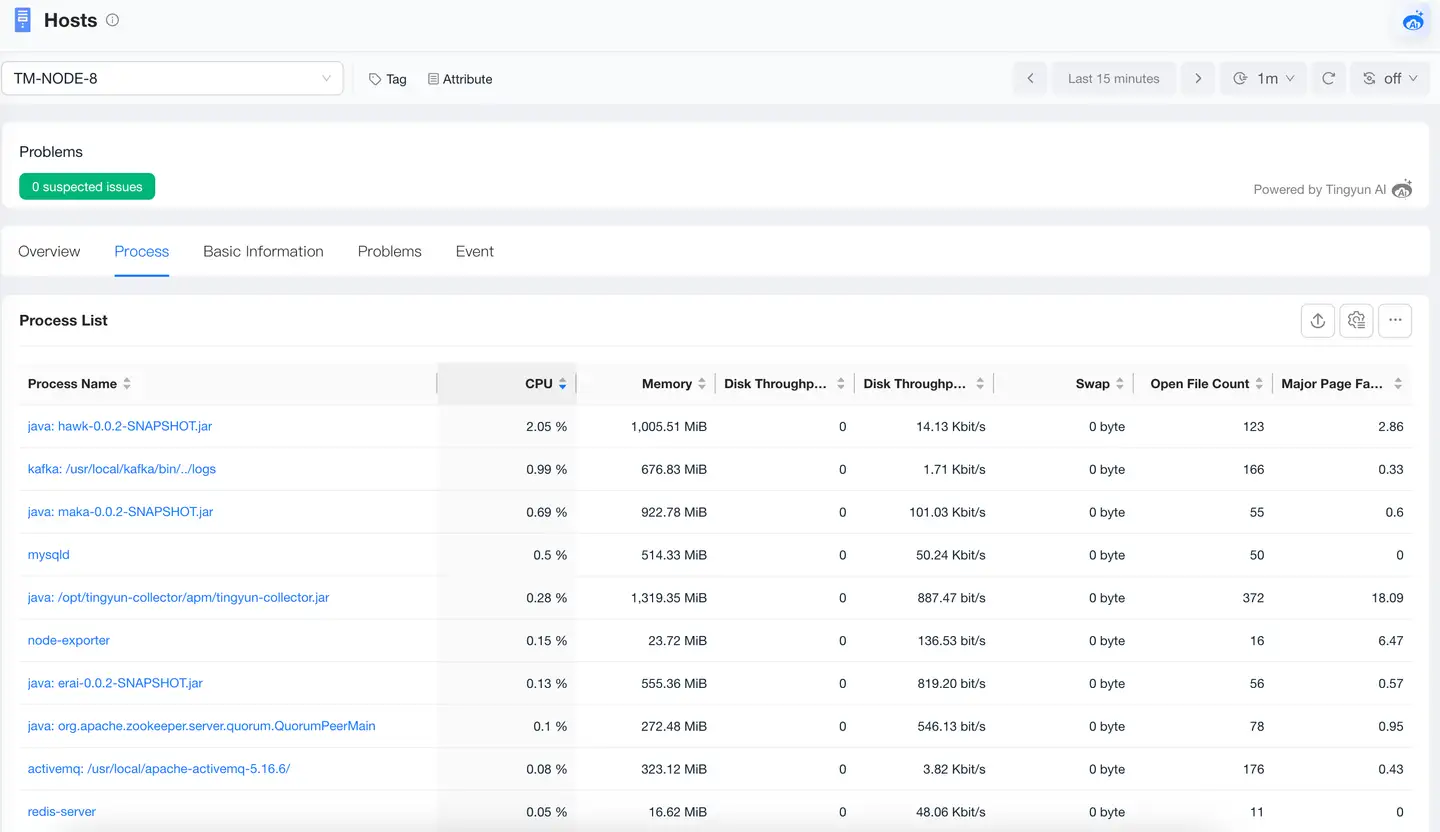
Processes
Infra can perform centralized monitoring of processes on hosts. In the process page, you can view process performance metrics that users care about. A process refers to a collection of related processes, such as Nginx's one master process forking multiple worker processes. Infra will merge master and worker processes into one process. Here, different processes can be roughly understood as different applications. Infra will automatically detect application types such as Nginx, MySQL, Oracle, Tomcat, JBoss, Apache HTTP Server, Redis, etc., and categorize them as different processes. The processes that Infra supports monitoring are as follows:
-
Java Web Containers: Tomcat, WebSphere, WebLogic, JBoss.
-
Java Applications: Such as Spring Boot, etc.
-
Databases: Oracle, MySQL, MongoDB, PostgreSQL.
-
Cache Services: Redis, Memcached.
-
Web Servers: Nginx, Apache HTTP Server.
-
Processes that have met any of the following conditions 3 times in the last 5 minutes:
- CPU usage > 5%
- Memory usage > 5%
- Disk throughput ratio > 5% and disk throughput > 1MB
Through charts, you can quickly view the process start time, CPU utilization, memory usage, disk throughput, Swap usage, number of open files, etc.
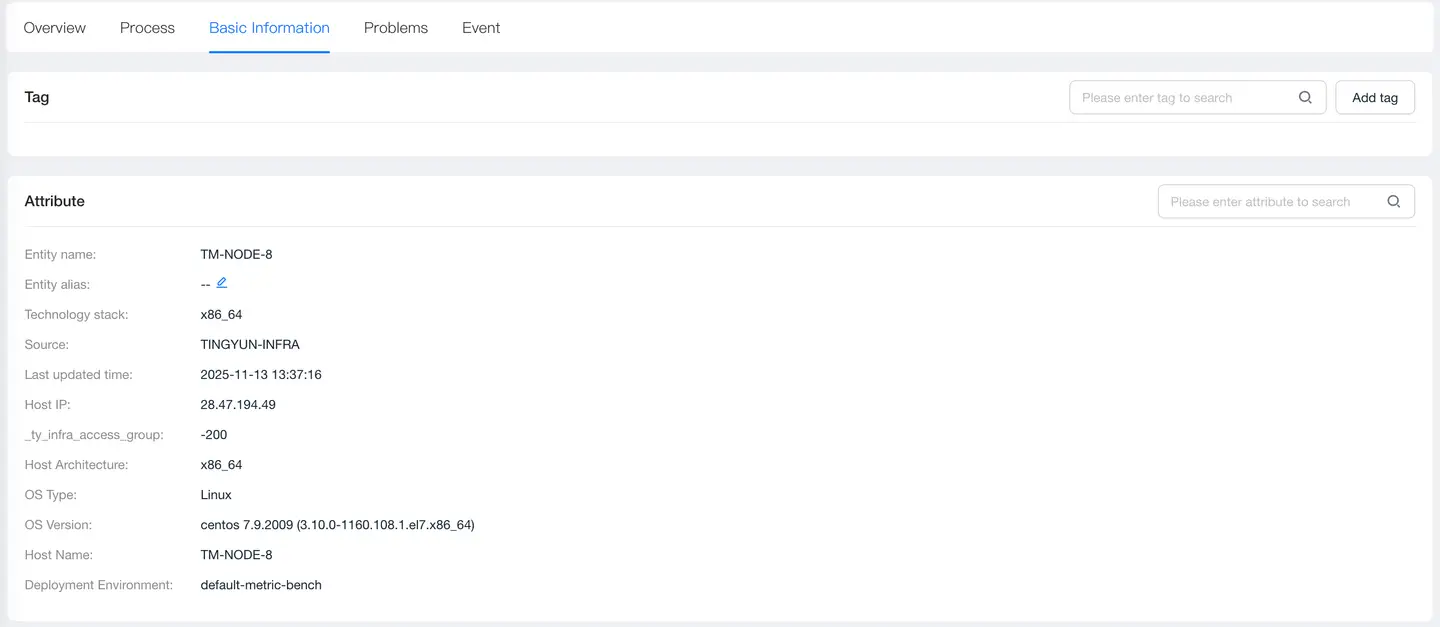
Basic Information
Basic information includes tags and attributes:
-
The tags module displays the list of tags currently configured for the host and supports users to dynamically add or delete tags, facilitating host classification, filtering, and management through custom tags to improve operational efficiency.
-
The attributes module displays the host's attribute information, including entity name, entity alias, technology stack, source, latest update time, and other attribute information.
Problems
The Problems page displays all Problems of the host, including problem description, impact scope, and possible causes, helping users quickly identify potential failures. Click Problem ID to view the root cause, impact scope, and other information of the problem.
Events
Events display host events.