Kubernetes Monitoring
Cluster
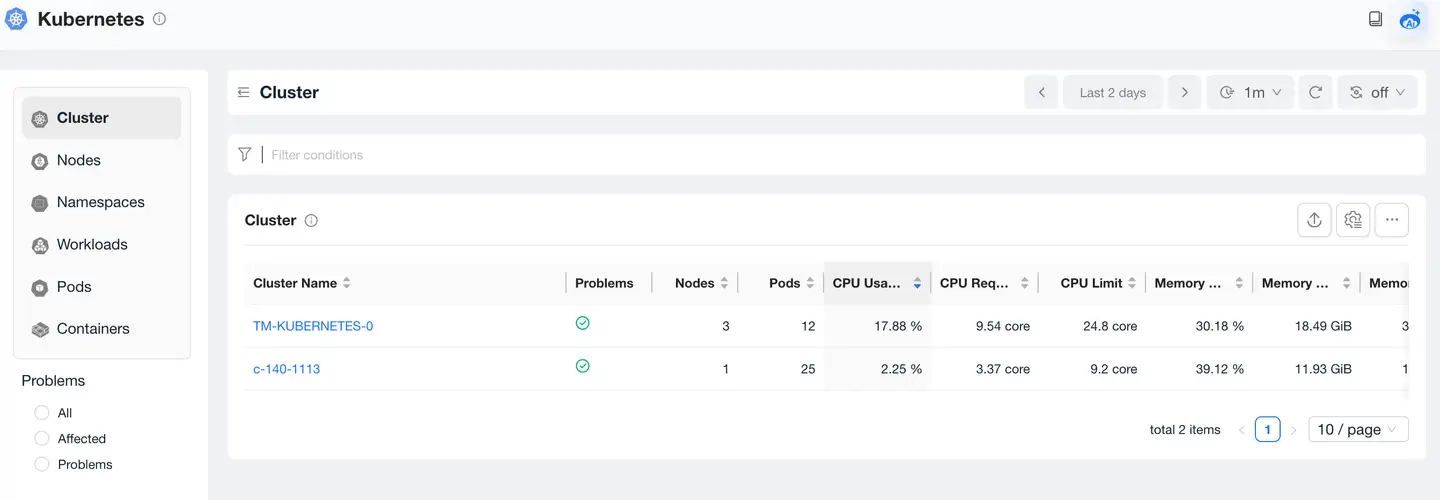
Cluster List
In cloud-native environments, through the Kubernetes cluster list, you can view the status of all currently monitored Kubernetes clusters, including Cluster name, Problems, Node count, Pod count, CPU usage, CPU requests, CPU limits, memory usage, memory usage, memory limits, and other information.
Cluster Overview
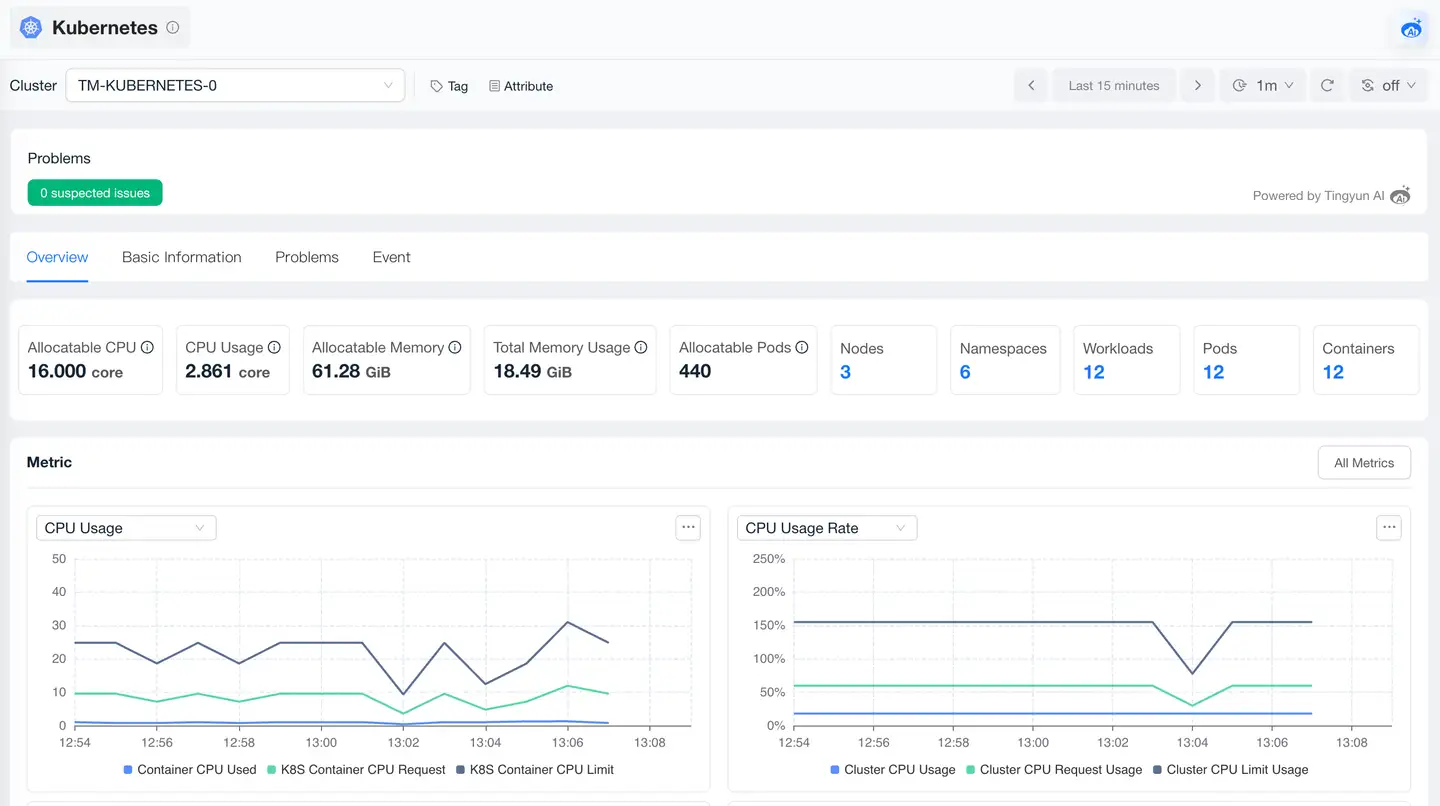
The cluster overview page is used to view the main information of the cluster, including metrics and relationships.
-
Metrics: Cluster performance charts can view the historical trends of CPU utilization and memory utilization of the current Kubernetes cluster to determine whether expansion is needed. You can also view the resource usage of requests, limits, and available containers in the cluster.
-
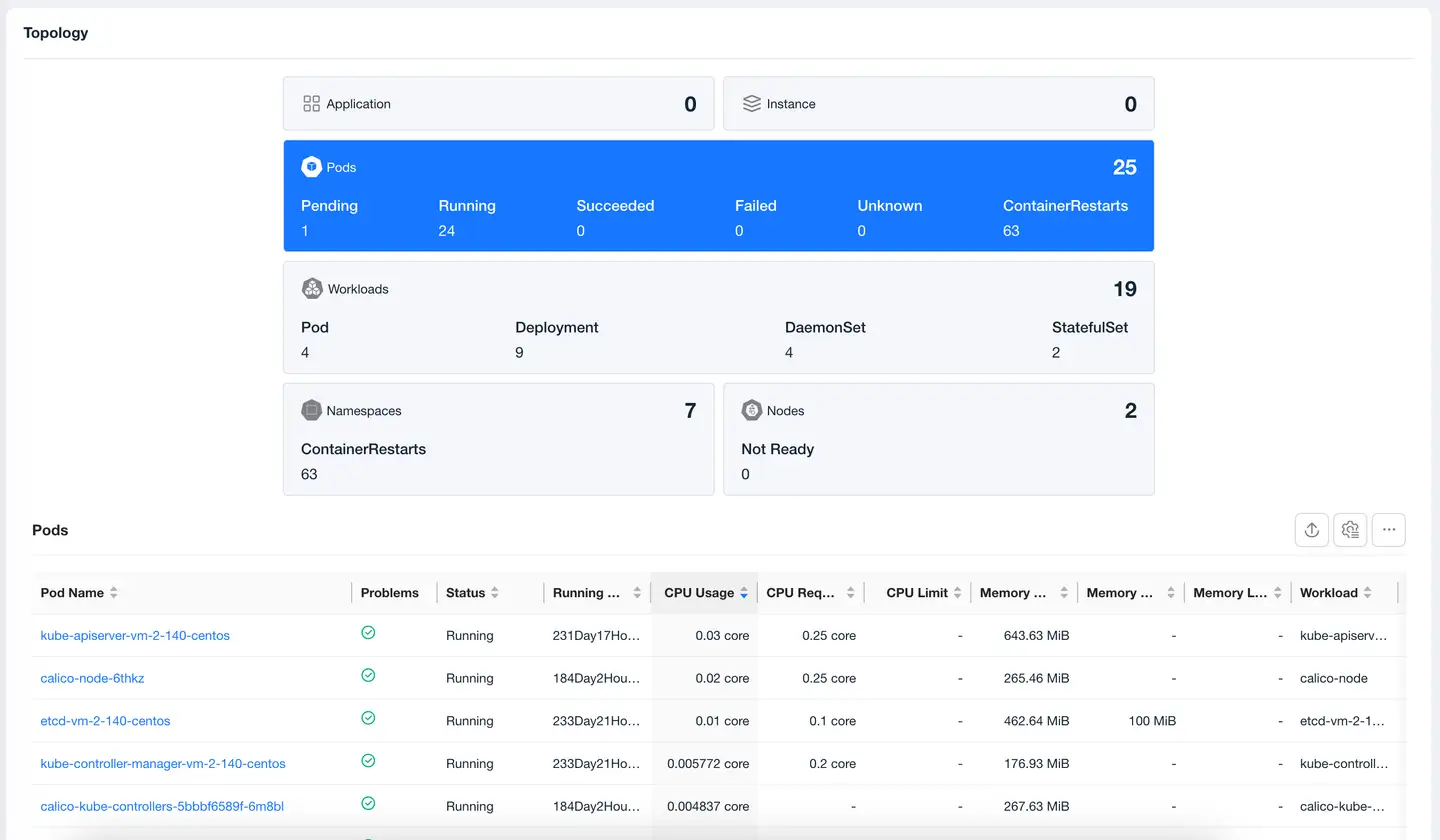
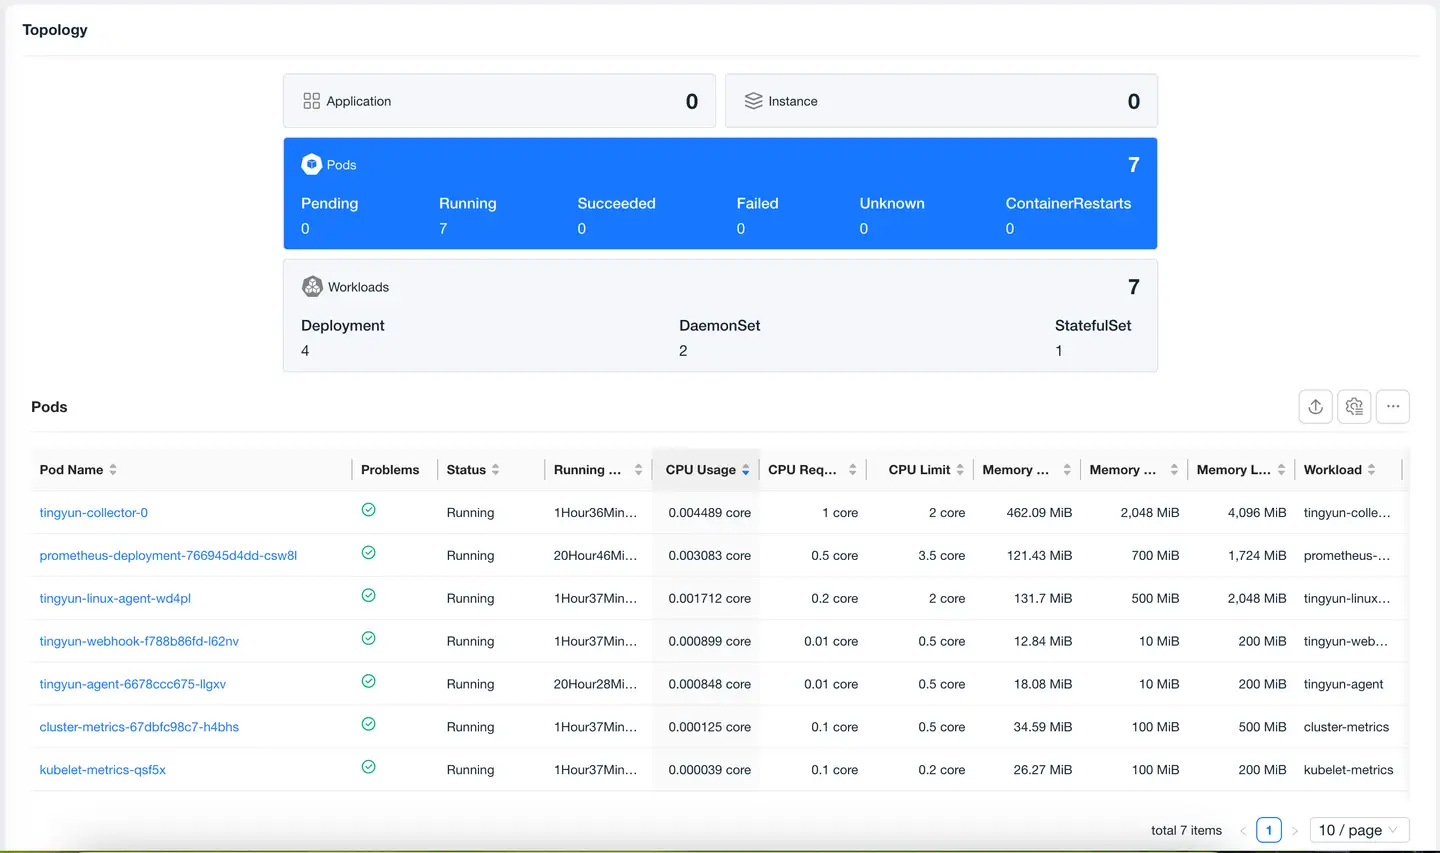
Topology:
Basic Information
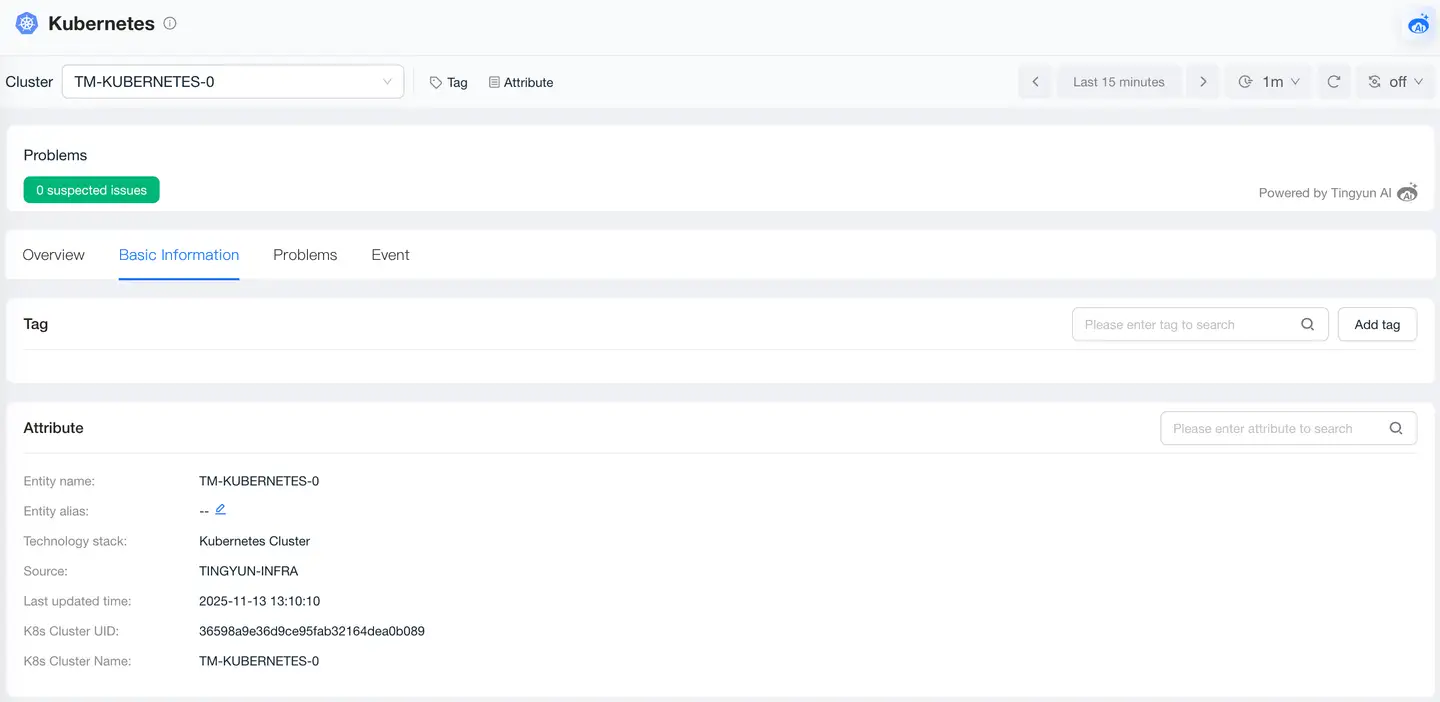
Basic information includes tags and attributes.
- The tags module displays the list of tags currently configured for the Cluster and supports users to dynamically add or delete tags, facilitating Cluster classification, filtering, and management through custom tags to improve operational efficiency.
- The attributes module displays the Cluster's attribute information, including entity name, entity alias, technology stack, source, latest update time, Kubernetes cluster name, and other key attribute information.
Problems
The Problems page displays all Problems of the Cluster, including problem description, impact scope, and possible causes, helping users quickly identify potential failures. Click Problem ID to view the root cause, impact scope, and other information of the problem.
Events
The Events list section displays events that occur in the Kubernetes cluster.
Nodes
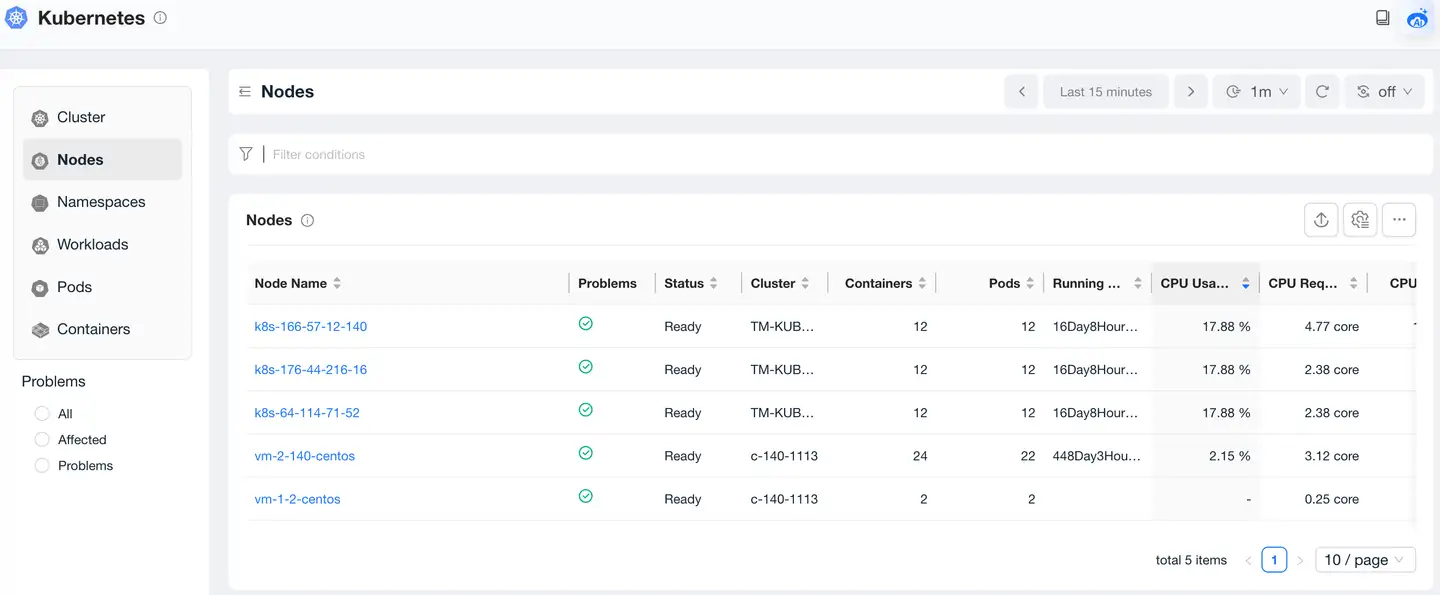
Nodes List
The Node list shows information about all Nodes in the current k8s cluster, including Node running status, whether there are anomalies such as high CPU utilization, insufficient disk distribution, etc., CPU and memory usage information, etc. Click on a Node to view Node details.
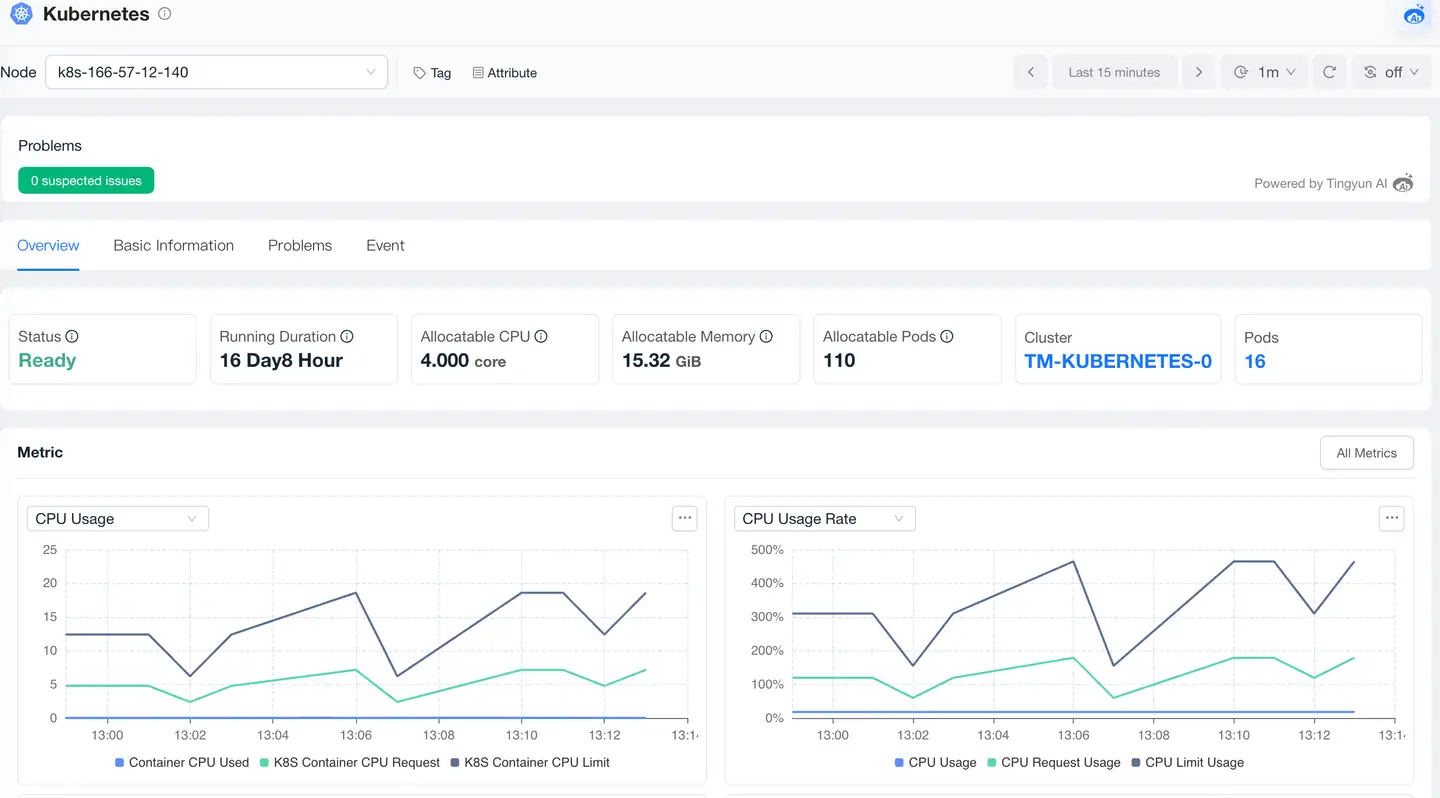
Nodes Overview
Analyze Nodes from aspects such as metrics, relationships, basic information, problems, and events.
Namespaces
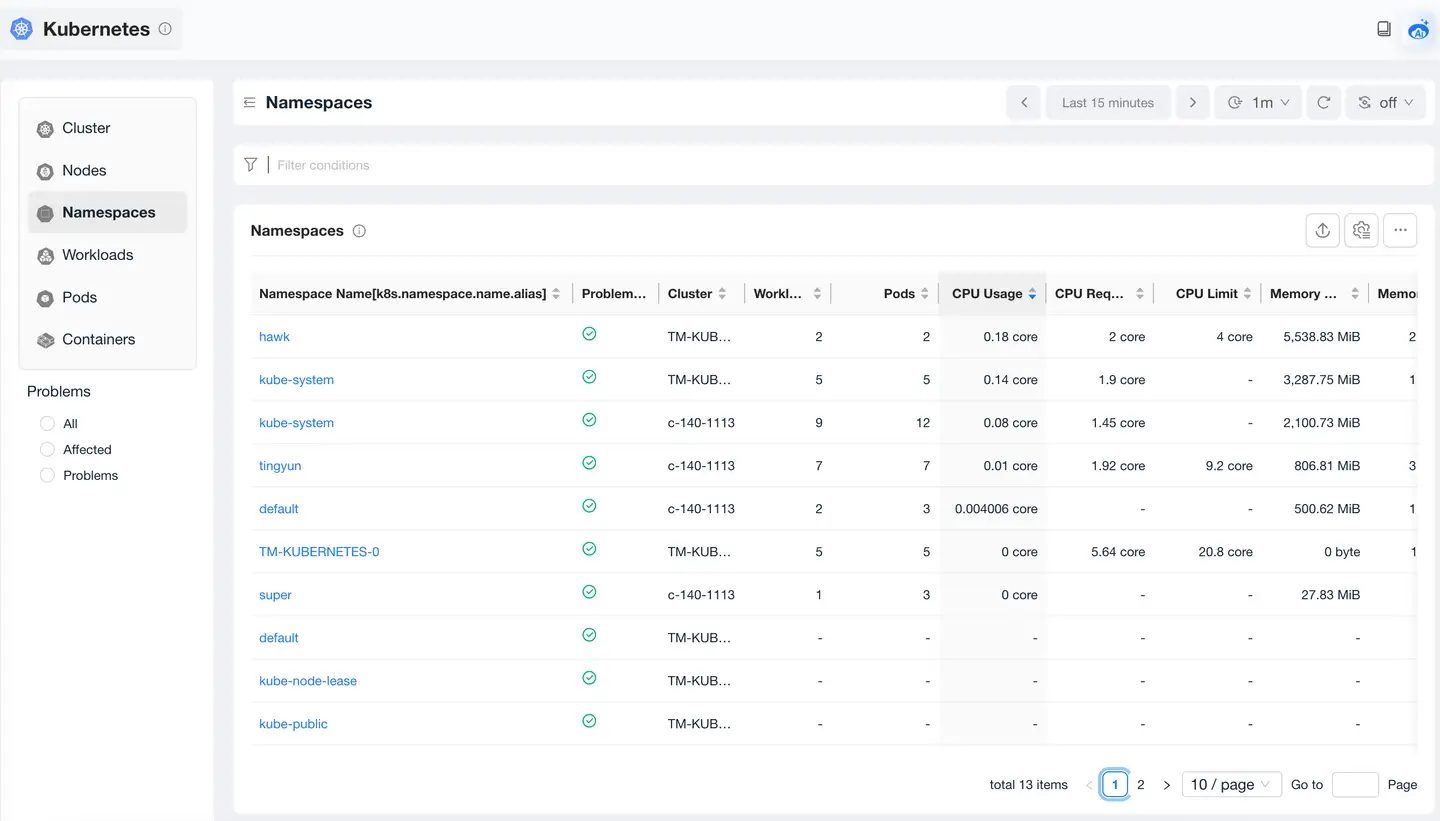
Namespaces List
The Namespace list will display detailed information of filtered Namespaces. The list fields show Namespace, Workloads, CPU requests, CPU limit, CPU request, CPU limit, and other information. In the Namespace page, you can view relevant statistical metrics of all Namespaces. Users can query by Namespace to help locate specific Namespace problems.
Namespaces Overview
-
Metrics: Displays trend charts of CPU usage and memory usage changes for the Namespace.
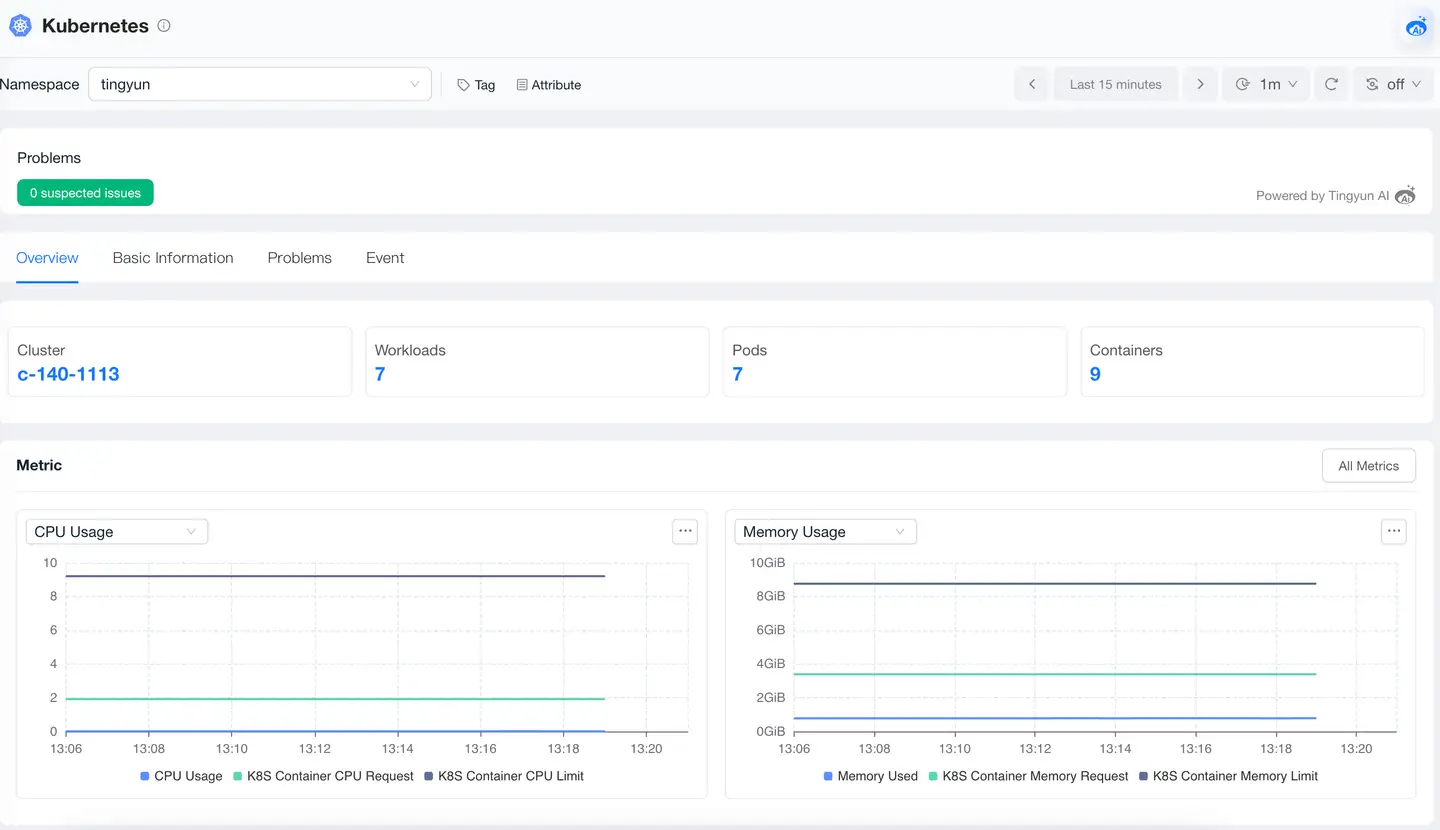
-
Relationships: Displays the status of Pods and Workloads.
Workloads
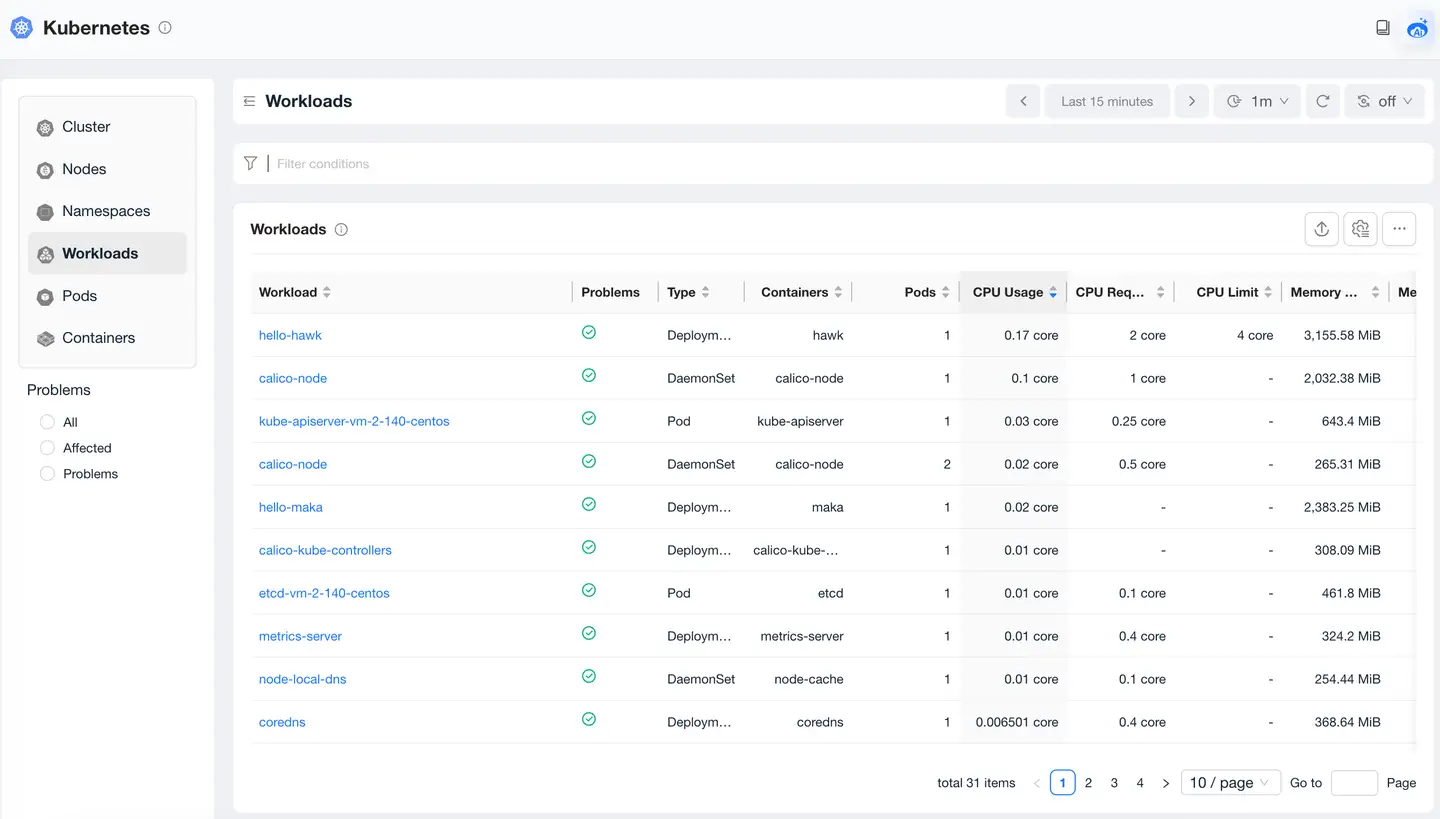
The Workloads page is used to view Workload-related metrics to help users locate specific Workload problems. Users can query by combining dimensions such as name, Namespace, deployment environment, type (StatefulSet, Deployment, DaemonSet three types), etc.
Workloads List
The Workload list will display detailed information of filtered Workloads. The list fields include name, type, Pods, Namespace, deployment environment, and other information.
Workloads Overview
Analyze Workloads from aspects such as metrics, relationships, basic information, problems, and events.
Pods
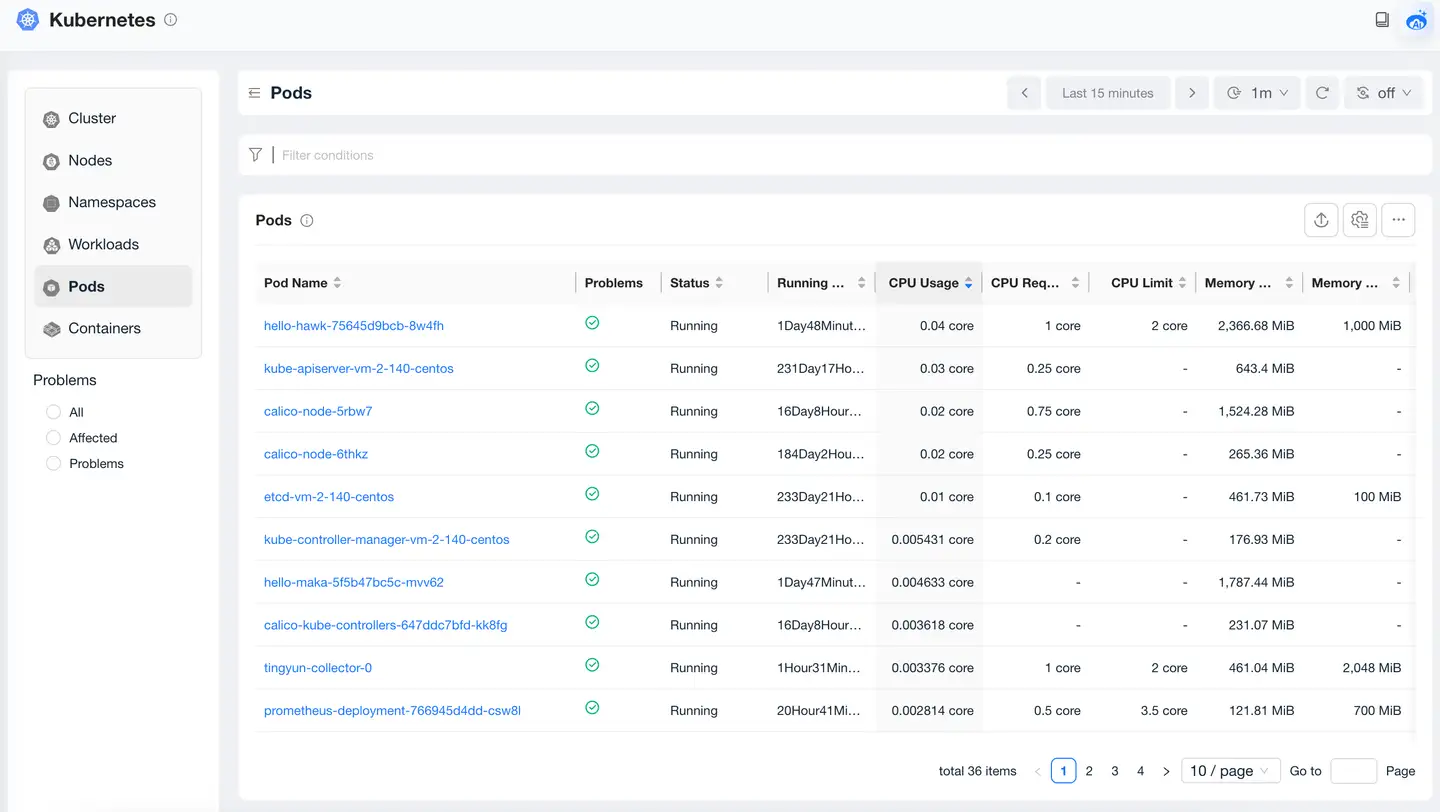
The Pods page is used to view specific Pods-related metrics to help users locate specific Pods problems. Users can query by combining dimensions such as Namespace, Pod name, Node name, Node IP, etc.
Pods List
The Pod list will display detailed information of filtered Pods, including running status, belonging Namespace, CPU usage, memory usage, network throughput, disk throughput, restart count, and other information.
Pods Overview
Analyze Pods from aspects such as metrics, relationships, basic information, problems, and events.
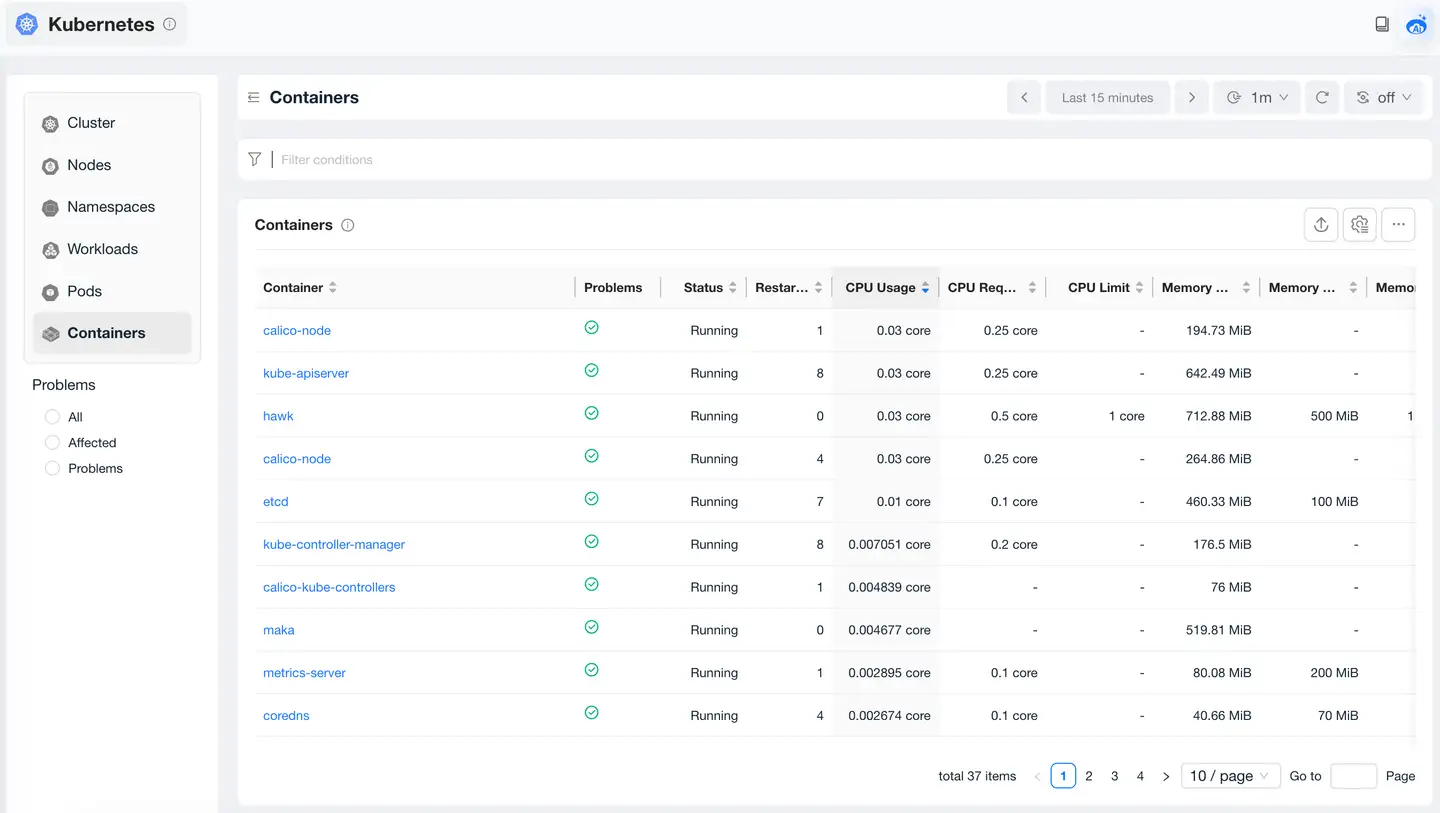
Containers
Containers List
Containers Overview
Analyze Containers from aspects such as metrics, relationships, basic information, problems, and events.